. 2015 Dec;12(12):1139-42.
doi: 10.1038/nmeth.3648. Epub 2015 Nov 2.

Tissue cartography: compressing bio-image data by dimensional reduction

Affiliations

Tissue cartography: compressing bio-image data by dimensional reduction

Idse Heemskerk et al. Nat Methods. 2015 Dec.

Abstract

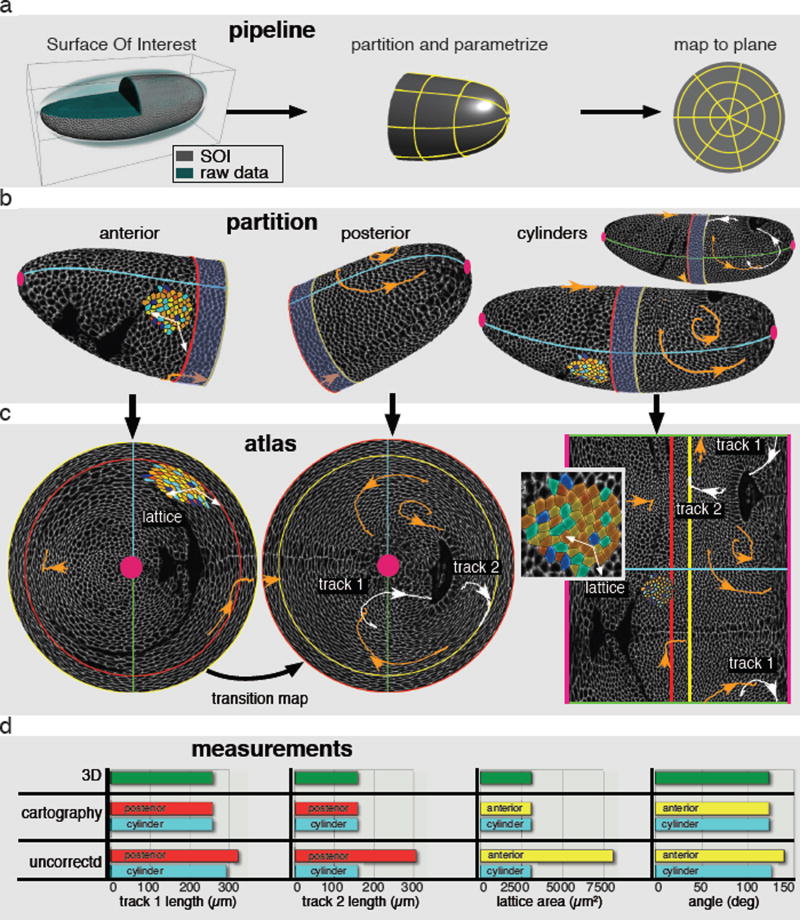
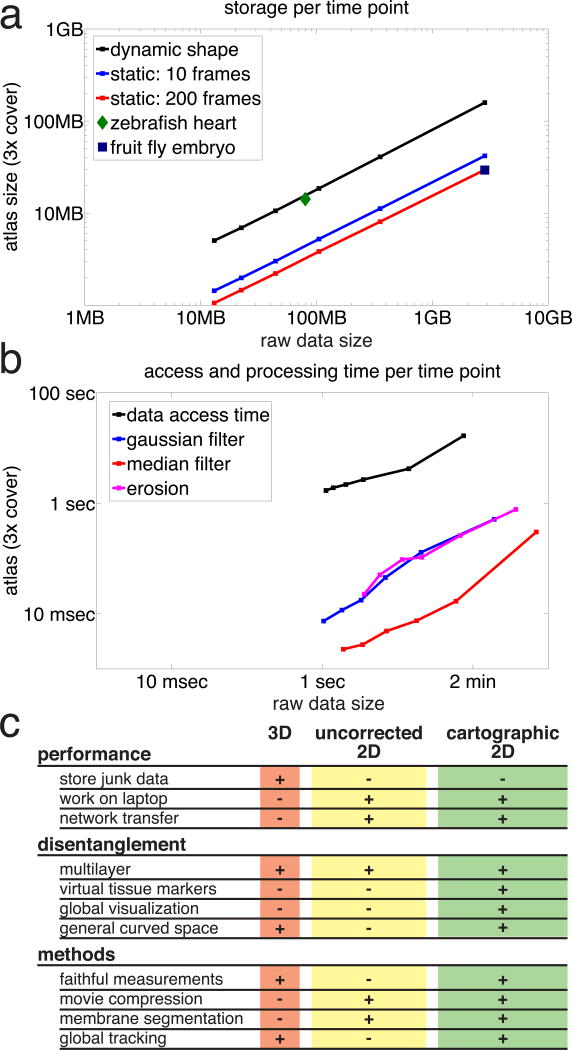
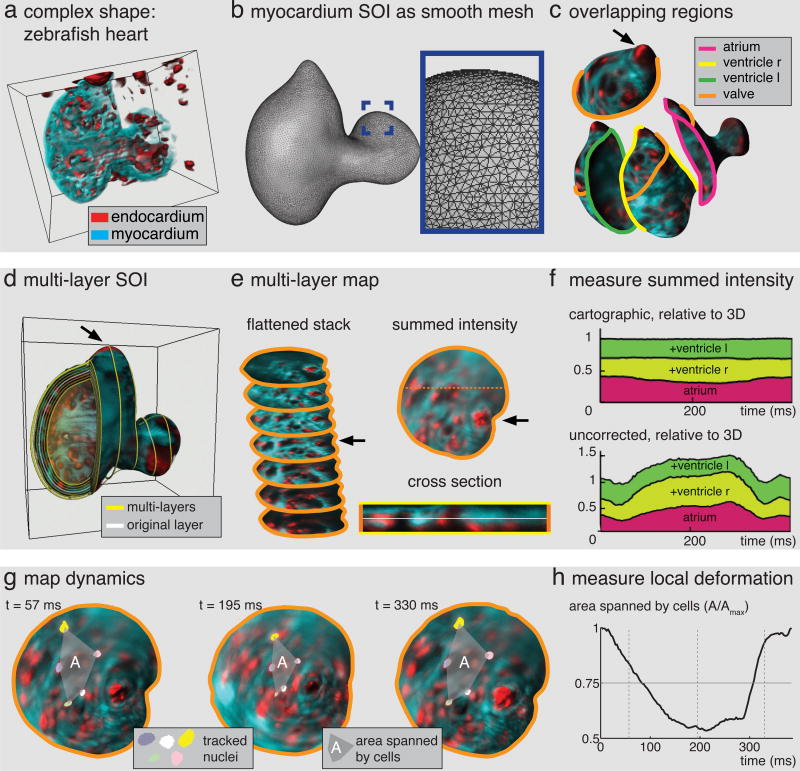
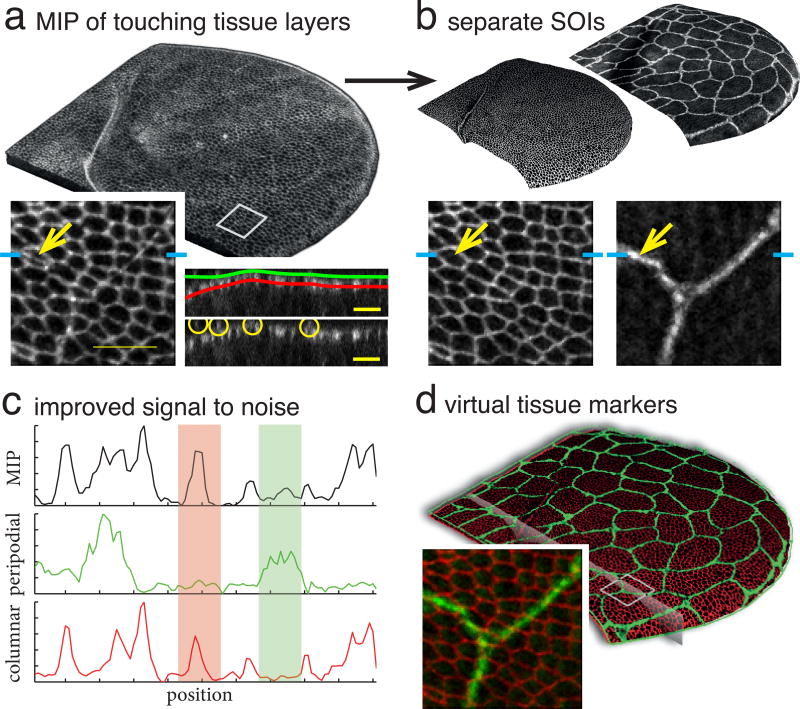
The high volumes of data produced by state-of-the-art optical microscopes encumber research. We developed a method that reduces data size and processing time by orders of magnitude while disentangling signal by taking advantage of the laminar structure of many biological specimens. Our Image Surface Analysis Environment automatically constructs an atlas of 2D images for arbitrarily shaped, dynamic and possibly multilayered surfaces of interest. Built-in correction for cartographic distortion ensures that no information on the surface is lost, making the method suitable for quantitative analysis. We applied our approach to 4D imaging of a range of samples, including a Drosophila melanogaster embryo and a Danio rerio beating heart.


Figures

Fig. 1
Fig. 1. Tissue cartography on Drosophila melanogaster embryo undergoing gastrulation
(a) The pipeline from left to right: identification of a SOI (grey) in the raw data (cyan), followed by partitioning into overlapping regions and parameterization (yellow lines). Finally, the image data is mapped to the parameter plane. (b) Partition of the apical embryo surface in anterior, posterior and cylinder regions. Solid lines represent region boundaries. Red: posterior, yellow: anterior, cyan and green: cuts in cylinder regions, pink: poles. Blue shaded domain indicates overlap of anterior and posterior regions. Membrane labeled surface data of one time point is shown in grey scale. Cell trajectories in orange and white. Also shown is a representative patch of segmented cells color-coded for coordination number with white vectors highlighting two edges. (c) Atlas of the embryo, showing anterior, posterior and cylinder maps from left to right. Color code as above. Inset shows close up of segmented cell patch in cylinder map. (d) Comparison of 3D to cartographic and uncorrected 2D measurements. Color code corresponds to region boundary as in (b). From left to right: Length of track 1 and 2 measured in the posterior hemi-embryo and cylinder region. Area of lattice and angle between highlighted vectors measured in anterior hemi-embryo and cylinder region.
Fig. 2
Fig. 2. Performance gain from tissue cartography
(a) Storage per time point in atlas versus raw data. Atlas normalized by number of surface coverings. Color codes for time dependence. Black: dynamic shapes require storage of atlas and geometric metadata for each time point; blue: static shapes with 10 time points only require storage of geometric metadata once, reducing the average storage per time point; red: as blue for 200 time points, further reducing average storage. Blue Square indicates average storage for the embryo data from Fig 1, green diamond for heart data from Fig 3. (b) Access and processing times for atlas and raw data in (a). Black: time required to load the data. Colors: typical processing times. Blue: Gaussian filter, magenta: erosion, red: theoretical data transfer at 5 MB/s of dynamic surface from (a). (c) Feature table of 3D, uncorrected 2D, and cartographic projections, comparing performance in routine tasks, data disentanglement, and feasibility of data post-processing methods.
Fig. 3
Fig. 3. Tissue cartography for a complex dynamic surface
(a) Zebrafish heart, red: endocardium, cyan: myocardium. (b) Smooth triangulation of myocardium Surface Of Interest. Inset shows zoom into highlighted region on atrium. (c) Overlapping regions on SOI, solid lines indicate region boundaries. For clarity, only the orange boundary is shown on the other regions. Arrow indicates valve. (d) Multi-layer SOI for zebrafish heart in (a), yellow lines indicate layers. White layer highlights surface in (b). (e) Conformal maps from orange region to plane for multiple layers arranged in flattened stack. Summed intensity projection on right with position of cross section below indicated by dashed line. In cross section, layer in (c) is highlighted in white. (f) Cartographic intensity measurements from different layers and regions add up faithfully for all times. Top: total intensity of regions in (c) for all layers, excluding overlap, normalized by 3D summed intensity within surface mask. Bottom: uncorrected summed intensity shows large error. Colors match region colors in (b). (g) Maps vary smoothly with time. Three time points show a group of tracked nuclei connected by a dashed line. (h) Area enclosed by tracked cells over time, normalized by maximum.
Fig. 4
Fig. 4. Data improvement and virtual tissue markers from SOIs
(a) Maximum intensity projection of membrane labeled D. melanogaster pupal wing. Note difficulty in distinguishing two tissue layers. Left inset: detail with arrow indicating peripodial membrane. Right insets: cross section through data close to the fold with SOIs superimposed on top and yellow circles innoisdicating peripodial membrane on bottom. (b) Separated SOIs showing same inset region as (a). (c) Intensity profiles of cross section through inset regions in (ab) at position indicated by cyan ticks shows disentanglement of signal from different layers. Red and green highlights respectively show MIP signal contributions from columnar and peripodial layers. (d) Recombining separated signal in different colors creates Virtual Tissue Markers. 3D rendering of both layers, plane indicates cross section used for (c).

References

    1. Krzic U, Gunther S, Saunders TE, Streichan SJ, Hufnagel L. Multiview light-sheet microscope for rapid in toto imaging. Nat. Methods. 2012;9:730–733. - PubMed
    1. Tomer R, Khairy K, Amat F, Keller PJ. Quantitative high-speed imaging of entire developing embryos with simultaneous multiview light-sheet microscopy. Nat. Methods. 2012;9:755–763. - PubMed
    1. Chen B-C, et al. Lattice light-sheet microscopy: imaging molecules to embryos at high spatiotemporal resolution. Science. 2014;346:1257998. - PMC - PubMed
    1. Bosveld F, et al. Mechanical control of morphogenesis by Fat/Dachsous/Four-jointed planar cell polarity pathway. Science. 2012;336:724–727. - PubMed
    1. Reynaud EG, Peychl J, Huisken J, Tomancak P. Guide to light-sheet microscopy for adventurous biologists. Nat. Methods. 2015;12:30–34. - PubMed

Publication types

MeSH terms

LinkOut - more resources