. 2015 Nov 5;527(7576):110-3.
doi: 10.1038/nature15544. Epub 2015 Oct 28.

Conformational control of DNA target cleavage by CRISPR-Cas9

Affiliations

Conformational control of DNA target cleavage by CRISPR-Cas9

Samuel H Sternberg et al. Nature. .

Abstract

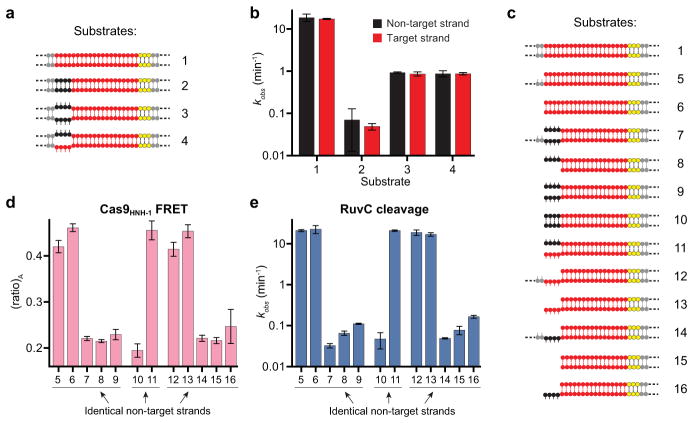
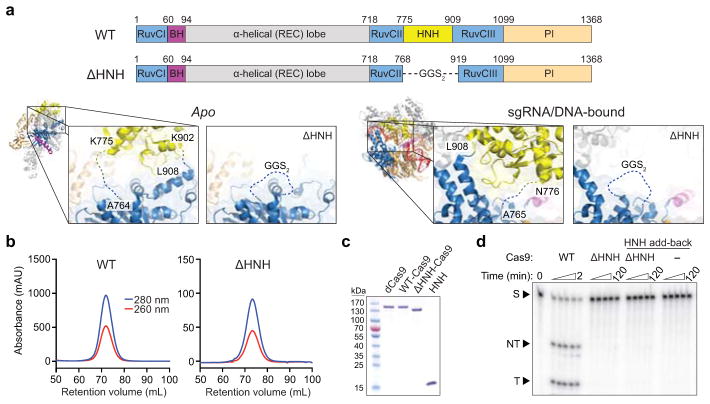
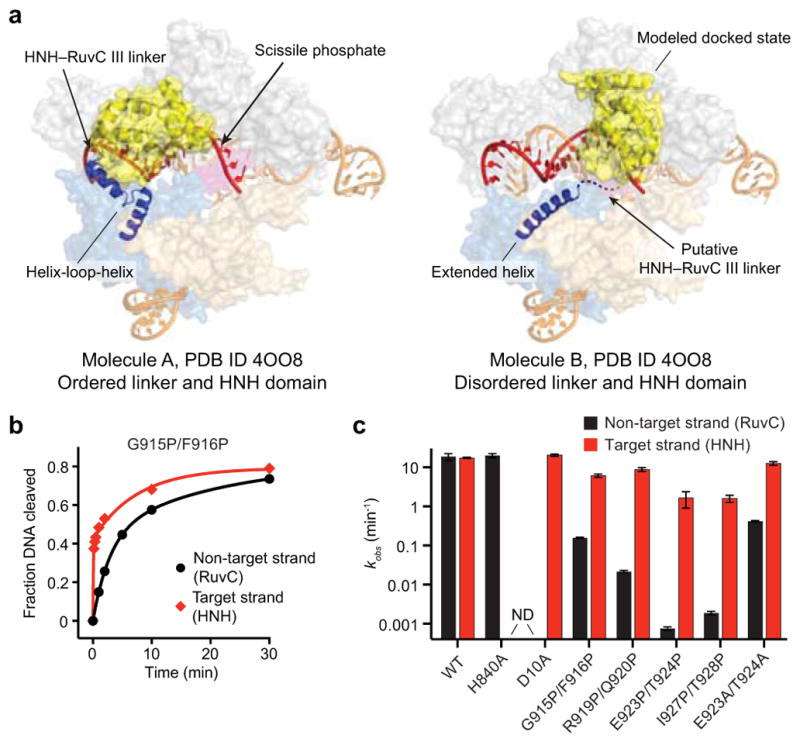
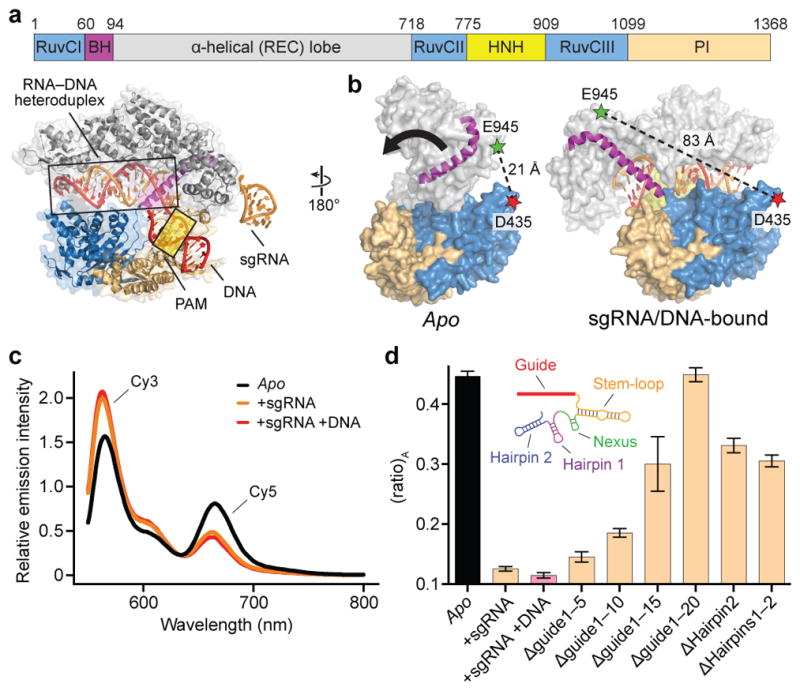
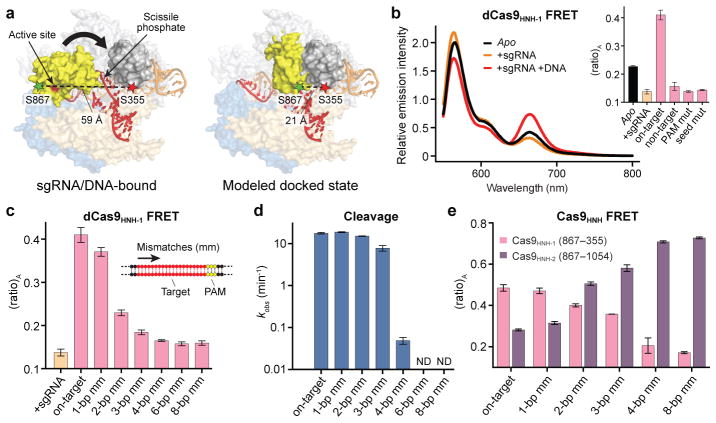
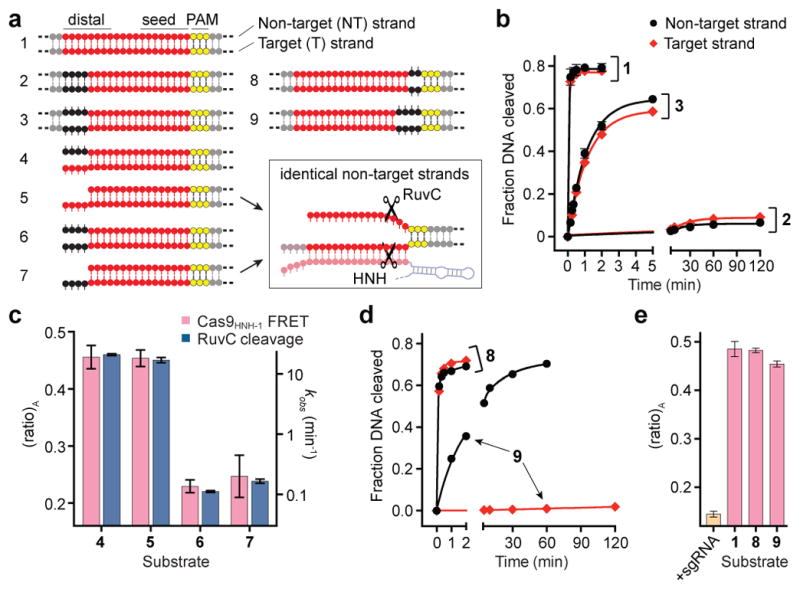
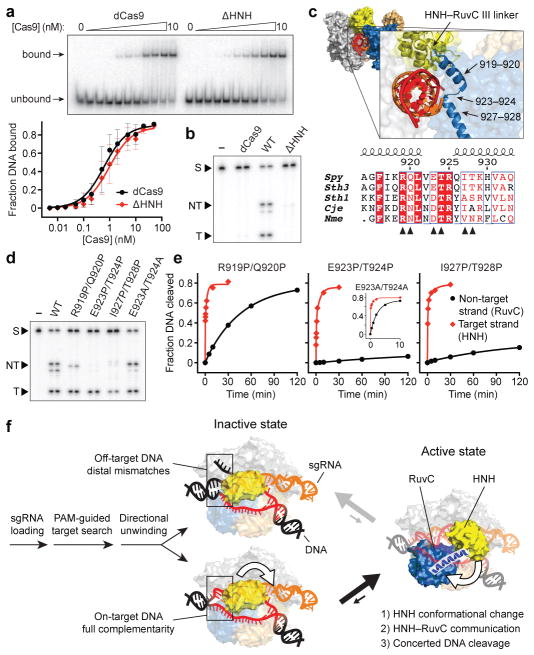
Cas9 is an RNA-guided DNA endonuclease that targets foreign DNA for destruction as part of a bacterial adaptive immune system mediated by clustered regularly interspaced short palindromic repeats (CRISPR). Together with single-guide RNAs, Cas9 also functions as a powerful genome engineering tool in plants and animals, and efforts are underway to increase the efficiency and specificity of DNA targeting for potential therapeutic applications. Studies of off-target effects have shown that DNA binding is far more promiscuous than DNA cleavage, yet the molecular cues that govern strand scission have not been elucidated. Here we show that the conformational state of the HNH nuclease domain directly controls DNA cleavage activity. Using intramolecular Förster resonance energy transfer experiments to detect relative orientations of the Cas9 catalytic domains when associated with on- and off-target DNA, we find that DNA cleavage efficiencies scale with the extent to which the HNH domain samples an activated conformation. We furthermore uncover a surprising mode of allosteric communication that ensures concerted firing of both Cas9 nuclease domains. Our results highlight a proofreading mechanism beyond initial protospacer adjacent motif (PAM) recognition and RNA-DNA base-pairing that serves as a final specificity checkpoint before DNA double-strand break formation.


Figures

Extended Data Figure 1
Extended Data Figure 1. Biochemical preparation and DNA cleavage activity of dye-labeled Cas9
a, Size exclusion chromatograms of Cy3/Cy5-labeling reactions with cysteine-free Cas9 (C80S/C574S) or the two double-cysteine Cas9 variants used to generate Cas9hinge and Cas9HNH-1. Reactions contained 10 μM Cas9 and 200 μM Cy3- and Cy5-maleimide, and were separated on a Superdex 200 10/300 column (GE Healthcare). Cysteine-free Cas9 was unreactive. b, Sodium dodecyl sulfate-polyacrylamide gel electrophoresis (SDS-PAGE) analysis of unlabeled and dye-labeled Cas9 variants. The gel was scanned for Cy3 and Cy5 fluorescence (right) before being stained with Coommassie blue (left). For gel source data, see Supplementary Figure 1. c, Representative radiolabeled DNA cleavage assay with wild-type (WT) Cas9 and doubly-labeled Cas9 variants used in this study, resolved by denaturing PAGE (left); quantified data and exponential fits are shown on the right. S, substrate; NT, cleaved non-target strand; T, cleaved target strand. Error bars represent the standard deviation from three experiments.
Extended Data Figure 2
Extended Data Figure 2. Fluorescence control experiments with Cas9hinge and dCas9hinge, and representative analysis of fluorescence emission spectra to calculate (ratio)A
a, Fluorescence emission spectra of 50 nM Cas9hinge in the presence of increasing concentrations of full-length sgRNA. Protein and sgRNA concentrations were calculated under non-denaturing conditions using theoretical extinction coefficients. b, Fluorescence emission spectra of: (1) Cy3-labeled Cas9hinge, (2) Cy5-labeled Cas9hinge, and (3) an equal mixture of Cy3-Cas9hinge and Cy5-Cas9hinge upon excitation at 530 nm. The minor fluorescence peak for Cy5 in the mixed sample results from residual absorbance of Cy5-Cas9hinge at 530 nm and not from intermolecular FRET (compare spectra 3 to 4, which is a sum of spectra 1 and 2). c, Fluorescence emission spectra of Cas9hinge in the presence of sgRNA substrates specific to Streptococcus pyogenes (Spy) or Neisseria meningitidis (Nme) Cas9. d, Determination of the (ratio)A parameter, which is proportional to FRET efficiency. Shown for apo-Cas9hinge are: (1) an emission spectrum of Cy3/Cy5-Cas9hinge upon excitation of the donor at 530 nm; (2) an emission spectrum of donor only Cy3-Cas9hinge upon excitation of the donor at 530 nm, normalized to 1; (3) the extracted fluorescence of the acceptor via energy transfer, obtained by subtracting 2 from 1; and (4) an emission spectrum of Cy3/Cy5-Cas9hinge upon direct excitation of the acceptor at 630 nm. (ratio)A is calculated by dividing the integrated intensity (650–800 nm) of 4 by the integrated intensity of 2. e, (ratio)A data for dCas9hinge in the presence of the same sgRNA substrates tested with nuclease-active Cas9hinge in Figure 1e. Error bars represent the standard deviation from three experiments.
Extended Data Figure 3
Extended Data Figure 3. Modeling of the HNH domain docked at the cleavage site, and design of the Cas9HNH-2 FRET construct
a, The scissile phosphate and flanking nucleotides of a DNA substrate co-crystallized with the phage T4 endonuclease VII (endo VII; PDB ID 2QNC; left) was aligned with the scissile phosphate and flanking nucleotides of the DNA target strand in the sgRNA/DNA-bound Cas9 crystal structure (PDB ID 4UN3; middle). Structural alignment of the Cas9 HNH domain with endo VII (middle) results in a model for how the Cas9 HNH domain docks at the cleavage site (right). Catalytic residues are labeled, target strands are shown in red and pink, and a magnesium ion is depicted as a blue sphere. b, A conservation rendering of the sgRNA/DNA-bound Cas9 crystal structure, generated using ConSurf, shows that the most highly conserved patches of the HNH domain, including the active site, are solvent exposed in the observed conformation. The HNH domain is omitted from the view on the left for clarity. c, Zoom-in view of the HNH domain in its observed conformation (left) and the model for the docked state (right), colored as in b. The DNA target strand fits snugly in a groove on the HNH domain in the model, with the most highly conserved patches located in the immediate vicinity of the scissile phosphate. DNA and sgRNA are colored red and orange, respectively. d, The conformational flexibility of the HNH domain in available Cas9 crystal structures is revealed by structural alignment of the nuclease lobe (RuvC and PI domains) from two sgRNA/DNA-bound structures (PDB IDs 4UN3 and 4OO8) and the sgRNA-bound structure (PDB ID 4ZT0). The modeled docked state from a is shown. e, Design of Cas9HNH-2 FRET construct. Measured distances between ~N1054 and S867 in the sgRNA/DNA-bound Cas9 structure and a model of the HNH domain docked at the cleavage site are indicated. Putative conformational changes of the HNH domain are shown with a black arrow.
Extended Data Figure 4
Extended Data Figure 4. Evidence that variable (ratio)A values for dCas9HNH-1 reflect distinct conformational states/dynamics, and FRET data for Cas9HNH-2
a, DNA binding assay with dCas9 and either on-target DNA or off-target DNAs containing 2, 4, or 8-bp mismatches at the PAM-distal end. Binding fits are shown as solid lines and yield equilibrium dissociation constants (Kd) of 0.80, 6.7, 19, and 20 nM, respectively. Given these values, 99%, 96%, 89%, and 89% of dCas9 should be bound to DNA under the conditions used for FRET experiments in Figure 2c (50 nM dCas9HNH-1, 200 nM DNA). b, (ratio)A data for 50 nM dCas9HNH-1 in the presence of 1 μM sgRNA and either 200 nM, 400 nM, or 1 μM off-target DNAs containing 2- or 4-bp mismatches. Data for sgRNA only and on-target DNA are shown for comparison. c, DNA cleavage time courses for the indicated DNA substrates using wild-type Cas9. Exponential fits are shown as solid lines, and extracted rate constants are shown in Figure 2d. d, Fluorescence emission spectra of Cas9HNH-2 in the presence of the indicated substrates. The inset shows (ratio)A values; mut, mutation. Error bars in a and b–d represent the standard deviation from three-to-five and three experiments, respectively.
Extended Data Figure 5
Extended Data Figure 5. Additional experimental support for dependence of RuvC nuclease activity on HNH conformational changes
a, Panel of DNA substrates tested in b, with on-target (1) at top. Matched and mismatched positions of DNA target strand sequences relative to the sgRNA are colored red and black, respectively, with the PAM in yellow. Some substrates contain internal mismatches between the two DNA strands; dashed lines indicate additional flanking sequence. b, Kinetics of non-target (black) and target (red) strand cleavage for the indicated DNA substrates. c, Panel of DNA substrates tested in d and e, depicted as in a. d, (ratio)A data for Cas9HNH-1 in the presence of the indicated DNA substrates. e, Non-target strand cleavage kinetics of the RuvC domain for the indicated DNA substrates. Error bars in b, d, e represent the standard deviation from three experiments.
Extended Data Figure 6
Extended Data Figure 6. Design, purification, and DNA cleavage activity of ΔHNH-Cas9
a, Domain organization of WT- and ΔHNH-Cas9 (top), showing the residues that were replaced with a GGS2 linker to generate ΔHNH-Cas9. Zoom-in view of connections between the HNH domain and RuvC II and III motifs in the apo (left) and sgRNA/DNA-bound (right) Cas9 crystal structures, as well as in the ΔHNH-Cas9 construct. Disordered linkers and the introduced GGS2 linker are shown as dashed lines. b, Size exclusion chromatograms of WT- and ΔHNH-Cas9 using a Superdex 200 16/60 column (GE Healthcare). c, SDS-PAGE analysis of dCas9 (D10A/H840A), WT-Cas9, ΔHNH-Cas9, and the purified HNH domain (residues 776–907). Expected molecular weights are 159 kDa, 159 kDa, 142 kDa, and 16 kDa, respectively. For gel source data, see Supplementary Figure 1. c, Representative radiolabeled DNA cleavage assay with WT-Cas9, ΔHNH-Cas9, ΔHNH-Cas9 in the presence of excess HNH domain, and HNH domain alone, resolved by denaturing PAGE.
Extended Data Figure 7
Extended Data Figure 7. Structural analysis and perturbation of the HNH–RuvC III linker
a, Molecules A (left) and B (right) of the sgRNA/DNA-bound Cas9 crystal structure (PDB ID 4OO8). Molecule A has an ordered HNH domain and HNH–RuvC III linker, whereas these are both disordered in molecule B; the missing density for the HNH domain is replaced with the modeled docked state (right). Another prominent difference is the N-terminal region of the RuvC III motif (blue helices), which rearranges from a helix-loop-helix in molecule A into an extended helix in molecule B. Proline pairs were inserted to prevent formation of this extended helix. b, Target (red) and non-target (black) strand cleavage time courses with the indicated Cas9 variant. Exponential fits are shown as solid lines. c, Kinetics of target (red) and non-target (black) strand cleavage for the indicated DNA substrates. ND, cleavage not detected. Error bars in b and c represent the standard deviation from three experiments.
Figure 1
Figure 1. Full-length sgRNA drives inward lobe closure of Cas9
a, Domain organization of S. pyogenes Cas9 (top) and X-ray crystal structure of sgRNA/DNA-bound Cas9 (PDB ID 4UN3, ref. 16) (bottom), with HNH domain omitted for clarity. BH, bridge helix; REC, recognition; PI, PAM-interacting. b, Design of Cas9hinge FRET construct. Measured distances between D435 and E945 in apo (PDB ID 4CMP, ref. 13) and sgRNA/DNA-bound Cas9 structures are indicated. Inward lobe closure is exemplified by movement of the BH (arrow). Regions of the PI domain, sgRNA, and DNA are omitted for clarity. c, Fluorescence emission spectra for Cas9hinge in the presence of the indicated substrates. d, (ratio)A data for Cas9hinge. Inset: schematic of full-length sgRNA coloured by motif. Error bars represent the standard deviation; n=3.
Figure 2
Figure 2. FRET experiments reveal an activated conformation of the HNH nuclease domain
a, Design of Cas9HNH-1 FRET construct. Measured distances between S355 and S867 in the sgRNA/DNA-bound Cas9 structure and a model of the HNH domain docked at the cleavage site are indicated, as are putative conformational changes of the HNH domain (arrow). The model was generated using an HNH homolog structure (PDB ID 2QNC, ref. 21). b, Fluorescence emission spectra for dCas9HNH-1 in the presence of the indicated substrates. Inset: (ratio)A values; mut, mutation. c, (ratio)A data for dCas9HNH-1. Mismatches were introduced sequentially from the PAM-distal end of the target. d, Cleavage rate constants using wild-type Cas9. ND, cleavage not detected. e, (ratio)A data for catalytically active Cas9HNH-1 and Cas9HNH-2. Error bars in b–e represent the standard deviation; n=3.
Figure 3
Figure 3. RuvC nuclease activity is allosterically controlled by HNH conformational changes
a, Tested DNA substrates, with on-target (1) at top. Matched and mismatched positions of DNA target strand sequences relative to the sgRNA are coloured red and black, respectively, with the PAM in yellow. Some substrates contain internal mismatches between the two DNA strands; dashed lines indicate additional flanking sequence. Schematic at bottom right depicts identical non-target strand substrates presented to the RuvC nuclease domain in substrates 5 and 7. b, Non-target (black) and target (red) strand cleavage time courses for the indicated DNA substrates using wild-type Cas9. Exponential fits are shown as solid lines. c, (ratio)A data for Cas9HNH-1 (red bars, left y-axis) and non-target strand cleavage kinetics of the RuvC domain (blue bars, right y-axis) for the indicated DNA substrates. d, Non-target and target strand cleavage time courses for the indicated DNA substrates using wild-type Cas9. Exponential fits are shown as solid lines. e, (ratio)A data for Cas9HNH-1. Error bars in b–e represent the standard deviation; n=3.
Figure 4
Figure 4. Mechanism of communication between the HNH and RuvC nuclease domains to achieve concerted DNA cleavage
a, Target DNA binding assay with dCas9 and ΔHNH–Cas9, resolved by native PAGE (top); for gel source data, see Supplementary Figure 1. Quantified data are below; binding fits are shown as solid lines. b, Target DNA cleavage assay with dCas9, wild-type (WT) Cas9, and ΔHNH–Cas9, resolved by denaturing PAGE. S, substrate; NT, cleaved non-target strand; T, cleaved target strand. c, Zoom-in view of the sgRNA/DNA-bound Cas9 structure (top) highlights two α-helices connecting the HNH domain C-terminus and RuvC III N-terminus. Bottom shows sequence alignment of this region, and residues mutated to proline or alanine are indicated (arrows). d, Target DNA cleavage assay with the indicated Cas9 variants, resolved by denaturing PAGE. e, Target (red) and non-target (black) strand cleavage time courses with the indicated Cas9 variants (for WT-Cas9 data, see Fig. 3b). Exponential fits are shown as solid lines. Error bars in a and e represent the standard deviation; n=5 or 3, respectively. f, Model for conformational control of target cleavage by CRISPR-Cas9.

References

    1. van der Oost J, Westra ER, Jackson RN, Wiedenheft B. Unravelling the structural and mechanistic basis of CRISPR-Cas systems. Nat Rev Microbiol. 2014;12:479–492. - PMC - PubMed
    1. Barrangou R, Marraffini LA. CRISPR-Cas systems: Prokaryotes upgrade to adaptive immunity. Mol Cell. 2014;54:234–244. - PMC - PubMed
    1. Jinek M, et al. A programmable dual-RNA-guided DNA endonuclease in adaptive bacterial immunity. Science. 2012;337:816–821. - PMC - PubMed
    1. Hsu PD, Lander ES, Zhang F. Development and applications of CRISPR-Cas9 for genome engineering. Cell. 2014;157:1262–1278. - PMC - PubMed
    1. Doudna JA, Charpentier E. Genome editing. The new frontier of genome engineering with CRISPR-Cas9. Science. 2014;346:1258096. - PubMed

Publication types

MeSH terms