. 2015 Nov 5;527(7576):95-9.
doi: 10.1038/nature15526. Epub 2015 Oct 28.

Differential responses to lithium in hyperexcitable neurons from patients with bipolar disorder

Collaborators, Affiliations

Differential responses to lithium in hyperexcitable neurons from patients with bipolar disorder

Jerome Mertens et al. Nature. .

Erratum in

  • Erratum: Differential responses to lithium in hyperexcitable neurons from patients with bipolar disorder.
    Mertens J, Wang QW, Kim Y, Yu DX, Pham S, Yang B, Zheng Y, Diffenderfer KE, Zhang J, Soltani S, Eames T, Schafer ST, Boyer L, Marchetto MC, Nurnberger JI, Calabrese JR, Oedegaard KJ, McCarthy MJ, Zandi PP, Alda M, Nievergelt CM; Pharmacogenomics of Bipolar Disorder Study; Mi S, Brennand KJ, Kelsoe JR, Gage FH, Yao J. Mertens J, et al. Nature. 2016 Feb 11;530(7589):242. doi: 10.1038/nature16182. Epub 2015 Nov 25. Nature. 2016. PMID: 26605530 No abstract available.

Abstract

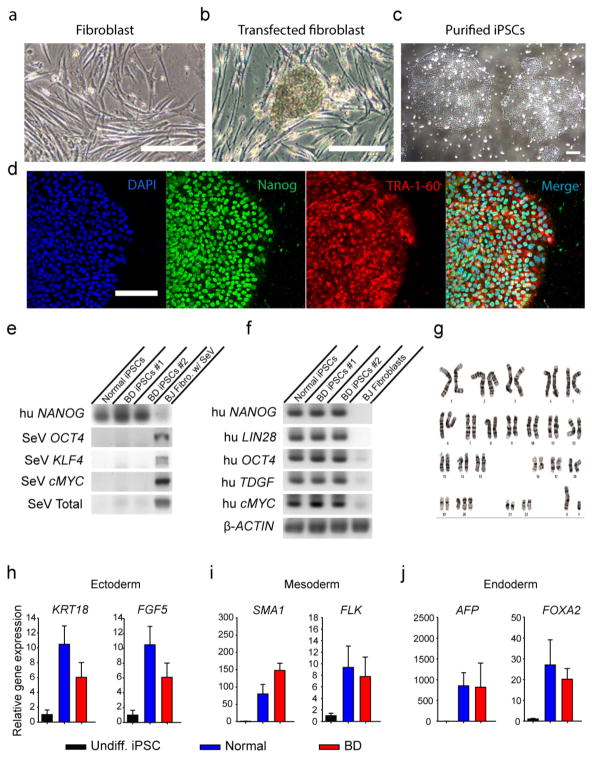
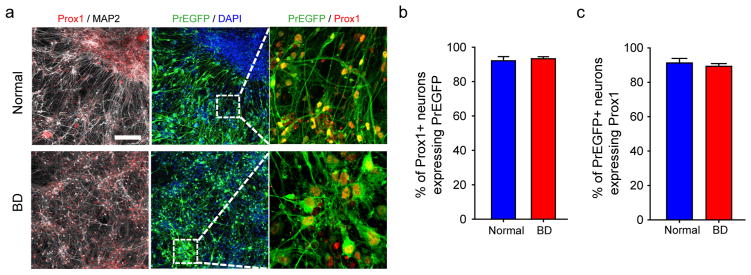
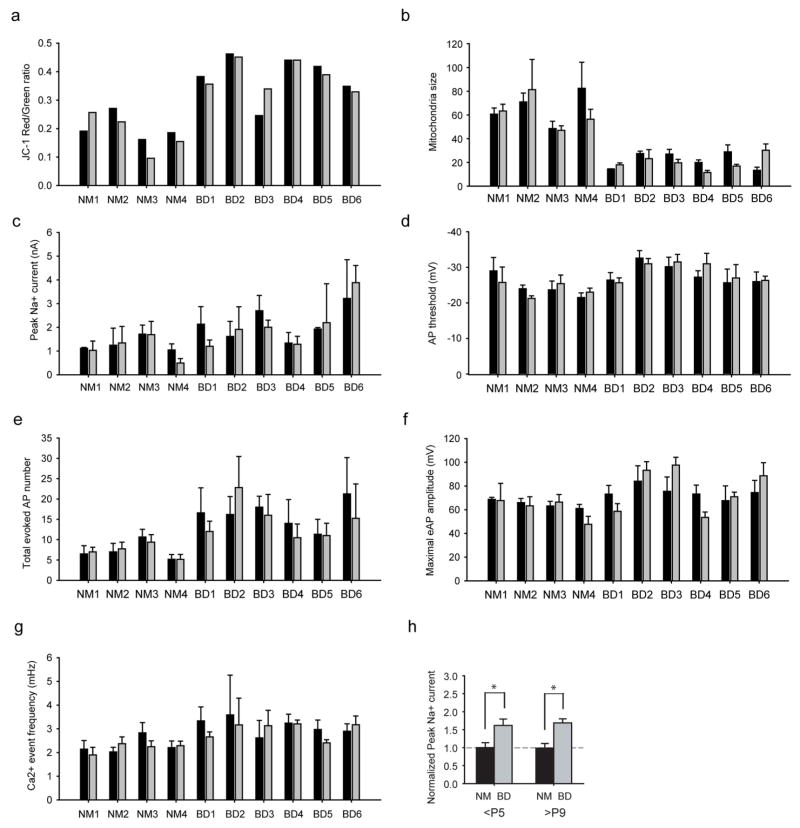
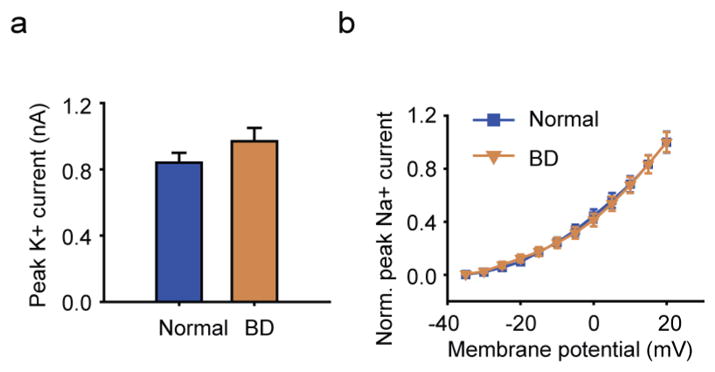
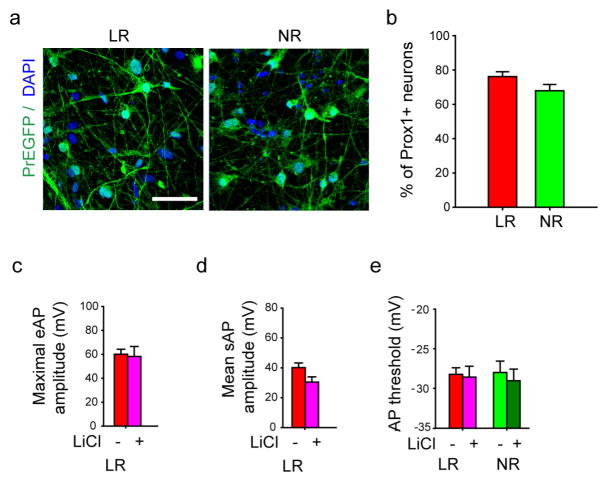
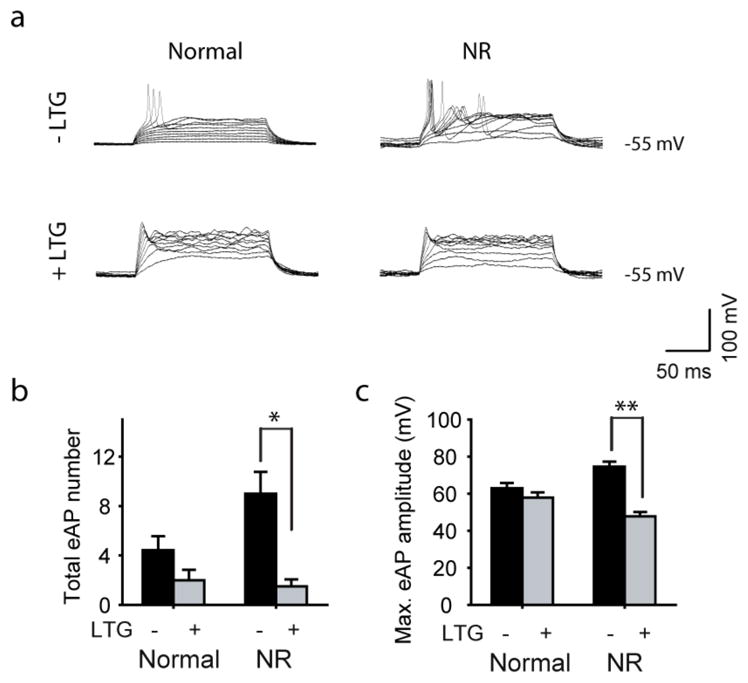
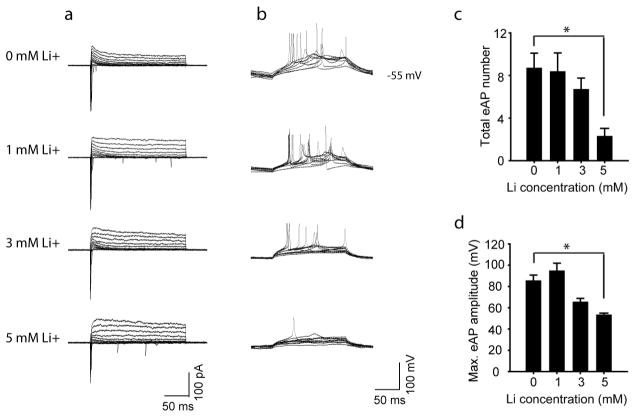
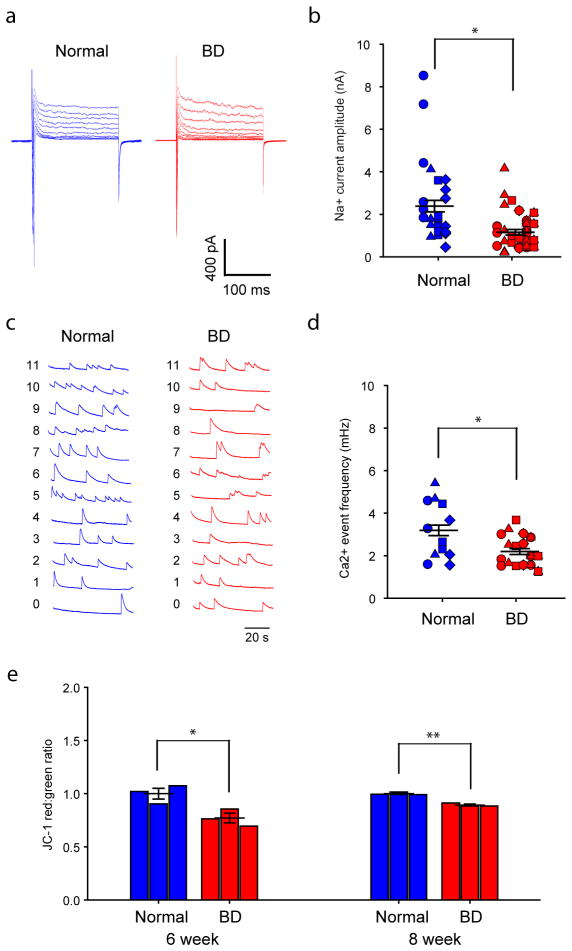
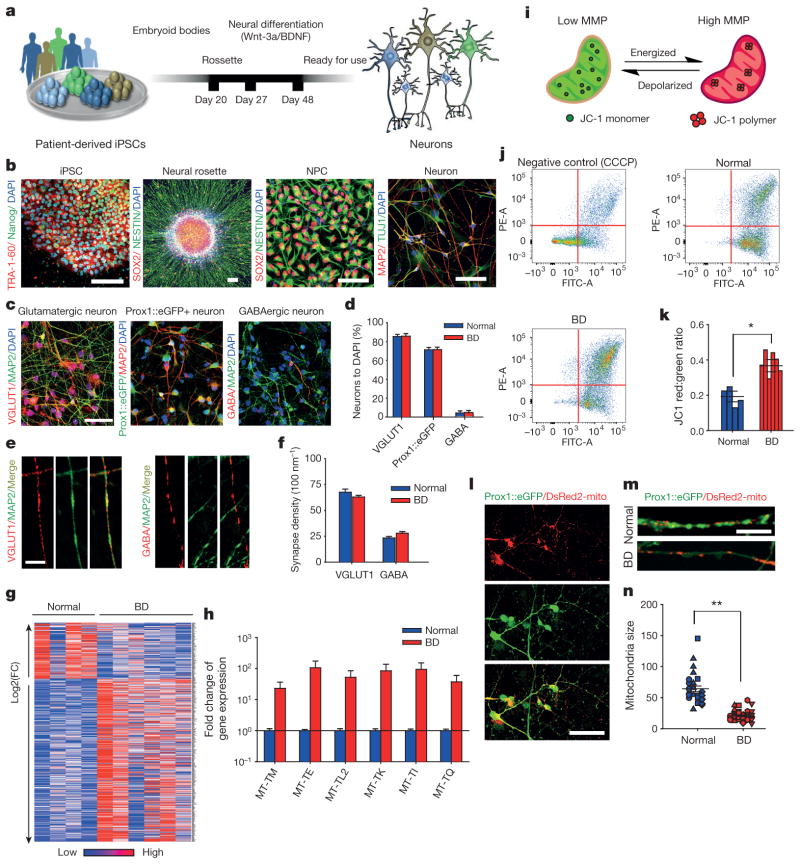
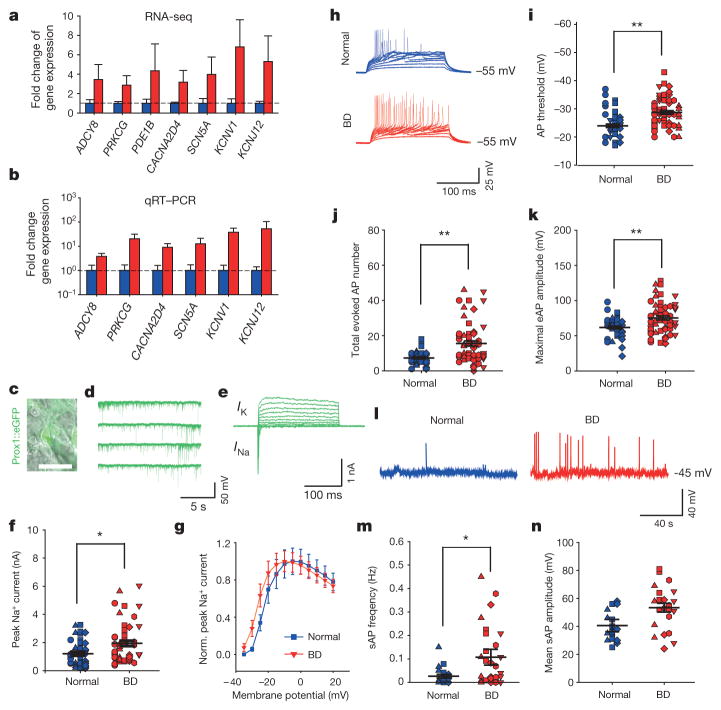
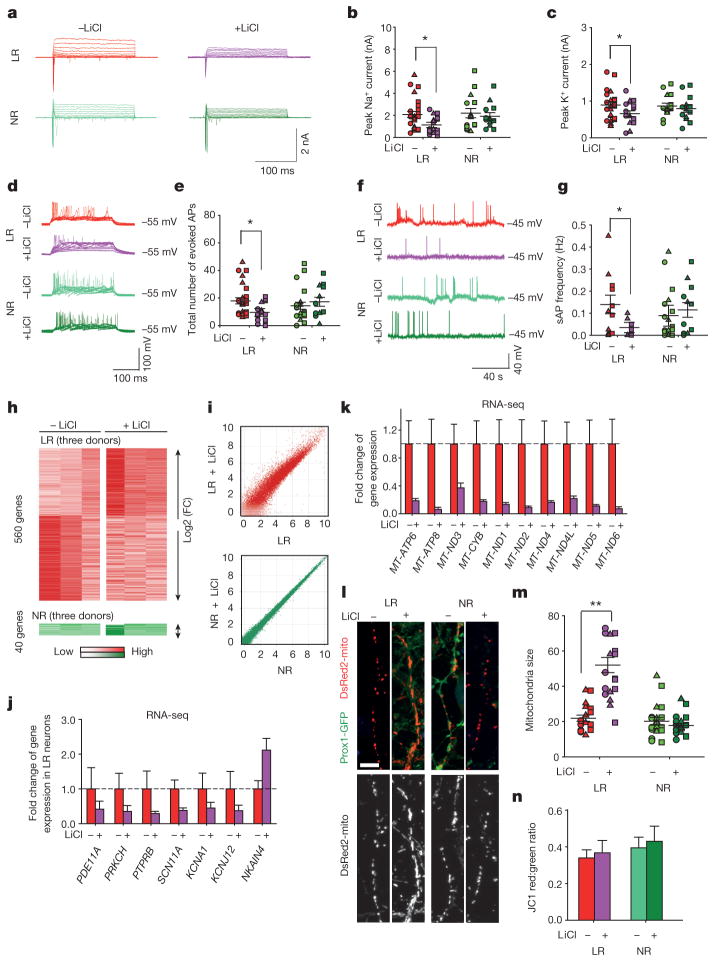
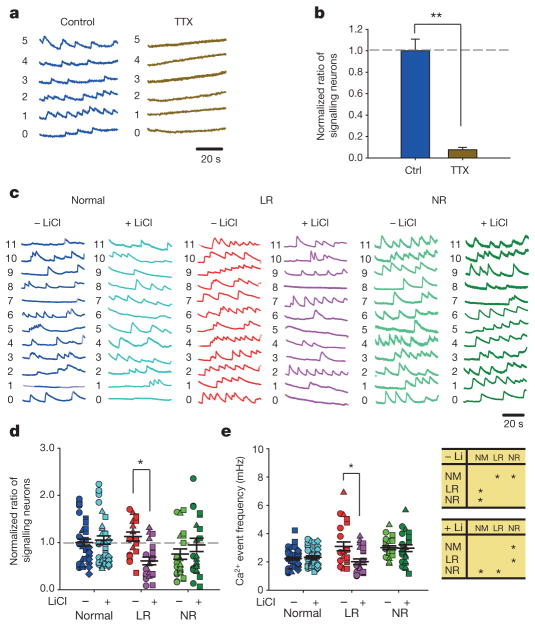
Bipolar disorder is a complex neuropsychiatric disorder that is characterized by intermittent episodes of mania and depression; without treatment, 15% of patients commit suicide. Hence, it has been ranked by the World Health Organization as a top disorder of morbidity and lost productivity. Previous neuropathological studies have revealed a series of alterations in the brains of patients with bipolar disorder or animal models, such as reduced glial cell number in the prefrontal cortex of patients, upregulated activities of the protein kinase A and C pathways and changes in neurotransmission. However, the roles and causation of these changes in bipolar disorder have been too complex to exactly determine the pathology of the disease. Furthermore, although some patients show remarkable improvement with lithium treatment for yet unknown reasons, others are refractory to lithium treatment. Therefore, developing an accurate and powerful biological model for bipolar disorder has been a challenge. The introduction of induced pluripotent stem-cell (iPSC) technology has provided a new approach. Here we have developed an iPSC model for human bipolar disorder and investigated the cellular phenotypes of hippocampal dentate gyrus-like neurons derived from iPSCs of patients with bipolar disorder. Guided by RNA sequencing expression profiling, we have detected mitochondrial abnormalities in young neurons from patients with bipolar disorder by using mitochondrial assays; in addition, using both patch-clamp recording and somatic Ca(2+) imaging, we have observed hyperactive action-potential firing. This hyperexcitability phenotype of young neurons in bipolar disorder was selectively reversed by lithium treatment only in neurons derived from patients who also responded to lithium treatment. Therefore, hyperexcitability is one early endophenotype of bipolar disorder, and our model of iPSCs in this disease might be useful in developing new therapies and drugs aimed at its clinical treatment.


Conflict of interest statement

The authors declare no competing financial interests.

Figures

Extended Data Figure 1
Extended Data Figure 1. Generation of iPSCs from patients with BD and healthy people
a, Human fibroblasts generated from punch biopsy. b, The iPSC colonies appeared after fibroblasts were reprogrammed using the Sendai virus. c, Purified iPSC colonies were cultured in Matrigel-coated plate. d, Immunostaining of iPSCs with DAPI and pluripotency markers Nanog and TRA-1-60. e, RT–PCR results showing that the introduced Sendai virus genes were cleared from the generated iPSCs. f, RT–PCR results showing that the generated iPSCs expressed human pluripotency markers NANOG, LIN28, OCT4, TDGF and cMYC. g, Representative karyotyping image of generated iPSCs showing normal chromosomal structure. hj, Bar graphs of quantitative RT–PCR showing that the iPSCs can randomly differentiate into cells expressing the markers for endoderm, mesoderm and ectoderm. Data are representative for a total of 20 iPS cell lines from 10 patients (2 clones per patient). Scale bar, 50 μm. Bars, mean ±s.e.m.
Extended Data Figure 2
Extended Data Figure 2. Lentiviral transduction of Prox1::eGFP efficiently labels Prox1-positive DG granule cell-like neurons
a, Sample immunostaining images showing the expression of Prox1 and Prox1::eGFP in the normal and BD neurons. Scale bar, 100 μm. b, Bar graph showing that, both in the normal and in BD groups, more than 90% of Prox1::eGFP-positive neurons express nuclear Prox1 protein. Normal, 92.1 ±2.4%, n = 4 lines; BD, 93.3 ±1.2%, n =12 lines. c, Bar graph showing that, both in the normal and in BD groups, approximately 90% of Prox1-positive DG-like neurons express Prox1::eGFP. Bars, mean ±s.e.m.
Extended Data Figure 3
Extended Data Figure 3. Bar graphs summarizing the similarity between different cell lines of the same subject and comparison of low and high passage cells
a, b, Bar graph comparing the MMP (n = 20 lines) (a) and mitochondria size (n = 68 images from 20 lines) (b) of different cell lines of one subject. cf, Electrophysiological recording experiments, including peak Na+ currents (n = 92 neurons from 20 lines) (c), AP threshold (94 neurons from 20 lines) (d), total evoked AP number (n = 97 neurons from 20 lines) (e) and maximal AP amplitude (n = 96 neurons from 20 lines) (f). g, Bar graph comparing the frequency of Ca2+ transient events. Black bar, cell line/clone 1; grey bar, cell line/clone 2 (178 videos from 20 lines). h, Bar graph showing the normalized peak Na+ current in normal (NM) and BD neurons derived from <P5 and >P9 cell lines (P5: normal, n = 40 neurons from 8 lines; BD, n = 52 from 12 lines. P9: normal, n = 11 from 2 lines; BD, n =23 from 5 lines). Student’s t-test, *P < 0.05. Bars, mean ±s.e.m.
Extended Data Figure 4
Extended Data Figure 4. K+ currents in the BD neurons
a, Average peak values of K+ currents in the BD and normal neurons. b, Normalized average K+ currents at different membrane potentials (normal, n = 35 neurons from 7 lines; BD, n = 41 from 10 lines). Student’s t-test. Bars, mean ±s.e.m.
Extended Data Figure 5
Extended Data Figure 5. Prox1:eGFP expression in the BD LR and NR neurons and AP amplitude and threshold of BD neurons
a, Sample immunostaining images showing the expression of Prox1::eGFP in the BD LR and NR neurons. Scale bar, 50 μm. b, Quantitative analysis revealed a similar percentage of Prox1::eGFP-positive DG-like neurons in the LR and NR groups (n = 32 images from 4 lines). c, d, Bar graphs showing the Li-induced effects in the maximal amplitude of evoked APs (LR without Li treatment, n = 27 neurons from 5 lines; with Li treatment, n = 18 from 5 lines) (c) and mean amplitude of spontaneous APs (LR without Li, n = 11 neurons from 3 lines; with Li, n = 10 from 3 lines) (d) of the LR neurons. e, Bar graph showing that the threshold of AP firing was not changed by Li (LR without Li, n = 11 neurons from 3 lines; with Li, n = 10 from 3 lines). Bars, mean ±s.e.m.
Extended Data Figure 6
Extended Data Figure 6. AP firing in the BD NR neurons treated with lamotrigine (LTG)
a, Representative traces of APs evoked during 300 ms stepwise depolarization periods in the normal and NR neurons with and without 100 μm lamotrigine treatment. b, c, Bar graphs summarizing the effects of lamotrigine on the total number (b) and maximal amplitude (c) of evoked APs in the normal and BD NR neurons (normal: without lamotrigine, n = 7 neurons; with lamotrigine, n = 8. BD NR: without lamotrigine, n = 5; with lamotrigine, n =6). Student’s t-test, *P <0.05; **P <0.001. Bars, mean ±s.e.m.
Extended Data Figure 7
Extended Data Figure 7. Effect of Li on the normal neurons
a, Representative traces of Na+/K+ currents in the normal neurons treated with Li at different concentrations. b, Representative traces of APs evoked during 300 ms stepwise depolarization periods in the normal neurons treated with Li at different concentrations. c, d, Bar graphs summarizing the effects of different concentrations of Li on the total number (c) and maximal amplitude (d) of evoked APs in the normal neurons (n = 4 neurons). Student’s t-test. *P < 0.05. Bars, mean ±s.e.m.
Extended Data Figure 8
Extended Data Figure 8. Reversal of hyperexcitability in old BD neurons
a, b, Sample traces (a) and scatter graph (b) showing that the 8-week-old BD neurons exhibited weaker Na+ currents than the normal neurons (normal, n = 28 neurons from 4 lines; BD, n = 37 from 6 lines). c, d, Sample traces (c) and scatter graph (d) showing that the 8-week-old BD neurons exhibited a lower frequency of Ca2+ transient events than the normal neurons (n =30 videos from 10 patients). e, Scatter graphs showing the MMP of 6- and 8-week-old BD and normal neurons (normal, n = 3 lines; BD, n =3 lines). Student’s t-test, *P <0.05; **P < 0.001. Bars, mean ±s.e.m.
Extended Data Figure 9
Extended Data Figure 9. The Prox1::eGFP-positive BD cells have similar expression of differentially expressed genes to the whole differentiation culture
a, Sorting of cells strongly expressing Prox1::eGFP using flow cytometry. b, Bar graph showing that Prox1::eGFP expression is enriched in the selected cells. c, Enrichment of differentially expressed genes in the Prox1 + DG-like neurons (c) and non-DG cells (d) (n = 6 patients). Bars, mean ± s.e.m.
Extended Data Figure 10
Extended Data Figure 10. Representative icons of the subjects in the figures
a, Representative icons of the patients with BD and healthy people used in the experiments shown in the figures. Identical symbols indicate the same subject.
Figure 1
Figure 1. Hippocampal DG granule cell-like neurons derived from patients with BD show gene expression and mitochondrial abnormalities
a, Schematic: generation of DG-like neurons from BD iPSCs. b, Immunostainings of iPSCs for TRA-1–60 and Nanog, neural rosettes and neural progenitor cells for SOX2 and Nestin, and neurons for MAP2 and TUJ1. c, Immunostainings of neurons labelled with VGLUT1, MAP2, Prox1::eGFP and GABA. Scale bars, 50 μm for b and c. d, Quantification of VGLUT1-positive glutamatergic neurons (normal, n = 8; BD, n = 12 lines), Prox1::eGFP-positive DG-like neurons (normal, n = 8; BD, n = 12 lines) and GABAergic neurons (normal, n = 4; BD, n = 12 lines). e, Immunostaining of dendritic glutamatergic synapses and axonal GABAergic synapses. Scale bar, 5μm. f, Quantification of glutamatergic and GABAergic synapse densities (VGLUT1: normal, n = 30 neurons from 8 lines; BD, n = 78 from 12 lines. GABA: normal, n = 30 from 6 lines; BD, n = 88 from 12 lines). g, Heat map of differential gene expression in normal and BD neurons. h, Bar graph summarizing differential expression of mitochondrial genes in BD and normal neurons. i, Schematic rationale of JC-1. j, JC-1 flow cytometry graphs showing that, as a control, CCCP diminishes neuronal MMP and that BD neurons have elevated MMP. k, Quantification of elevated MMP in BD neurons compared with normal (normal, n = 8 lines from 4 subjects; BD, n = 12 lines from 6 subjects). l, m, Neurons expressing DsRed2-mito and Prox1::eGFP. Scale bars, 50 μm (l) and 20 μm (m). n, DsRed2-mito puncta sizes reduced in BD neurons. Identical symbols indicate same subject (normal, n = 29 cells from 8 lines; BD, n = 39 from 12 lines). Student’s t-test, *P < 0.05; **P < 0.001. Bars, mean ± s.e.m.
Figure 2
Figure 2. Hippocampal neurons derived from patients with BD show hyperexcitability
a, b, Average expression of representative genes involved in the PKA/PKC and AP firing systems revealed by RNA-seq (a) and qRT–PCR (b) analysis (normal, n = 4; BD, n = 6 lines). ce, Patch-clamp recording on Prox1::eGFP-expressing DG-like neurons (c) showed spontaneous postsynaptic currents (d) and Na+/K+ currents (e). Scale bar, 20 μm. f, Average peak values of Na+ currents during stepwise depolarization (normal, n = 40 neurons from 8 lines; BD, n = 52 from 12 lines). g, Normalized average Na+ currents at different membrane potentials. hk, Sample trace (h), average firing threshold (i), average total number (j) and maximal amplitude (k) of APs evoked during 300 ms stepwise depolarization. Identical symbols indicate same subject (for AP threshold: normal, n = 39 neurons from 8 lines; BD, n = 55 from 12 lines; for total AP number: normal, n = 39 from 8 lines; BD, n = 58 from 12 lines; for maximal amplitude: normal, n = 39 from 8 lines; BD, n = 57 from 12 lines). ln, Sample trace (l), average frequency (m) and mean amplitude (n) of spontaneous APs (for AP frequency: normal, n = 29 neurons from 6 lines; BD, n = 30 from 8 lines). Student’s t-test, *P < 0.05; **P < 0.001. Bars, mean ± s.e.m.
Figure 3
Figure 3. Li rescues hyperexcitability in hippocampal neurons derived from iPSCs of patients with BD
a, Na+/K+ currents recorded from BD LR and NR neurons with and without Li. b, c, Effects of Li on average peaks of Na+ currents (b) and K+ currents (c) in the LR and NR neurons. Identical symbols indicate same subject (LR without Li, n = 26 neurons from 5 lines; with Li, n = 19 from 5 lines). d, Representative traces of APs evoked during 300 ms stepwise depolarization periods. e, Scatter graph showing Li-induced decrease in the average total AP number of the LR neurons (LR without Li treatment, n = 27 neurons from 5 lines; with Li treatment, n = 18 from 5 lines). f, Representative traces of spontaneous APs. g, Spontaneous AP firing frequency in Li-treated LR neurons (LR without Li, n = 11 neurons from 3 lines; with Li, n = 10 from 3 lines). h, i, Heat maps (h) and MA plots (i) showing effects of Li treatment on gene expression in LR and NR neurons. j, k, Effects of Li on the average expression of representative PKA/PKC/AP (j) and mitochondrial genes (k) in the LR neurons (with Li, n = 3; without Li, n = 3 lines). l, m, Sample images of neurons (l) and bar graph (m) showing the effects of Li treatment on mitochondria morphology. Scale bar, 10 μm (n = 19 neurons from 6 lines). n, No effects of Li treatment on MMP of the BD neurons (n = 6 lines for each group). Student’s t-test, *P < 0.05; **P < 0.001. Bars, mean ± s.e.m.
Figure 4
Figure 4. Somatic Ca2+ imaging analysis reveals hyperactivity in the neural network formed by the BD iPSC-derived neurons
a, b, Sample traces (a) and bar graph (b) showing neuronal Ca2+ transients abolished by tetrodotoxin (n =10 images). c, Representative Ca2+ traces in normal, BD LR and NR neurons. d, Effects of Li treatment on the average ratio of neurons exhibiting Ca2+ events. Identical symbols indicate the same subject (n = 23 images from 6 lines). e, Scatter graph (left) and analysis of variance (ANOVA) (right) showing the average Ca2+ event frequencies in normal and BD neurons treated with Li (normal, n = 43 images from 8 lines; LR, n =23 from 6 lines; NR, n = 23 from 6 lines). Student’s t-test (b) and ANOVA (d, e), *P <0.05; **P < 0.001. Bars, mean ±s.e.m.

Comment in

References

    1. Sharma R, Markar HR. Mortality in affective disorder. J Affect Disord. 1994;31:91–96. - PubMed
    1. Dusetzina SB, et al. Treatment use and costs among privately insured youths with diagnoses of bipolar disorder. Psychiatr Serv. 2012;63:1019–1025. - PMC - PubMed
    1. Martinowich K, Schloesser RJ, Manji HK. Bipolar disorder: from genes to behavior pathways. J Clin Invest. 2009;119:726–736. - PMC - PubMed
    1. Andreazza AC, Young LT. The neurobiology of bipolar disorder: identifying targets for specific agents and synergies for combination treatment. Int J Neuropsychopharmacol. 2014;17:1039–1052. - PubMed
    1. Chang A, Li PP, Warsh JJ. cAMP-Dependent protein kinase (PKA) subunit mRNA levels in postmortem brain from patients with bipolar affective disorder (BD) Brain Res Mol Brain Res. 2003;116:27–37. - PubMed

Publication types