. 2015 Nov 5;527(7576):105-9.
doi: 10.1038/nature15548. Epub 2015 Oct 28.

Autophagy mediates degradation of nuclear lamina

Affiliations

Autophagy mediates degradation of nuclear lamina

Zhixun Dou et al. Nature. .

Abstract

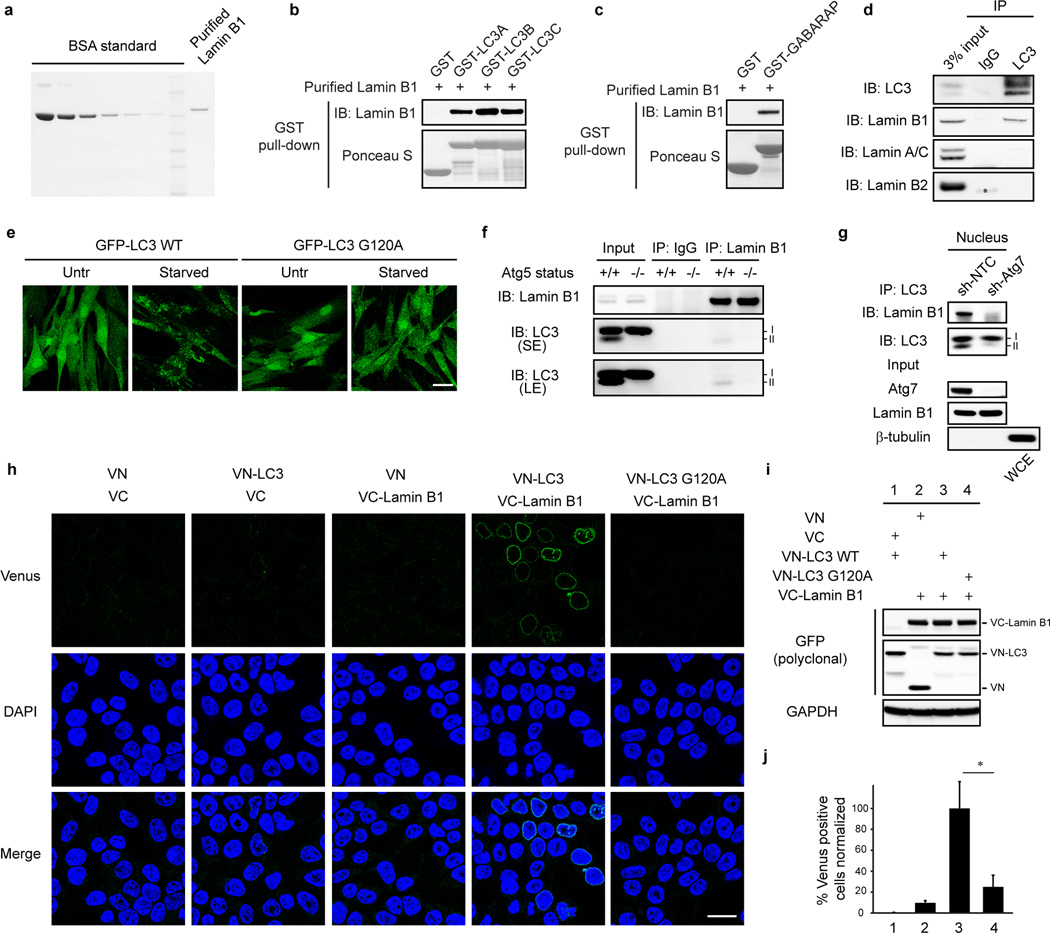
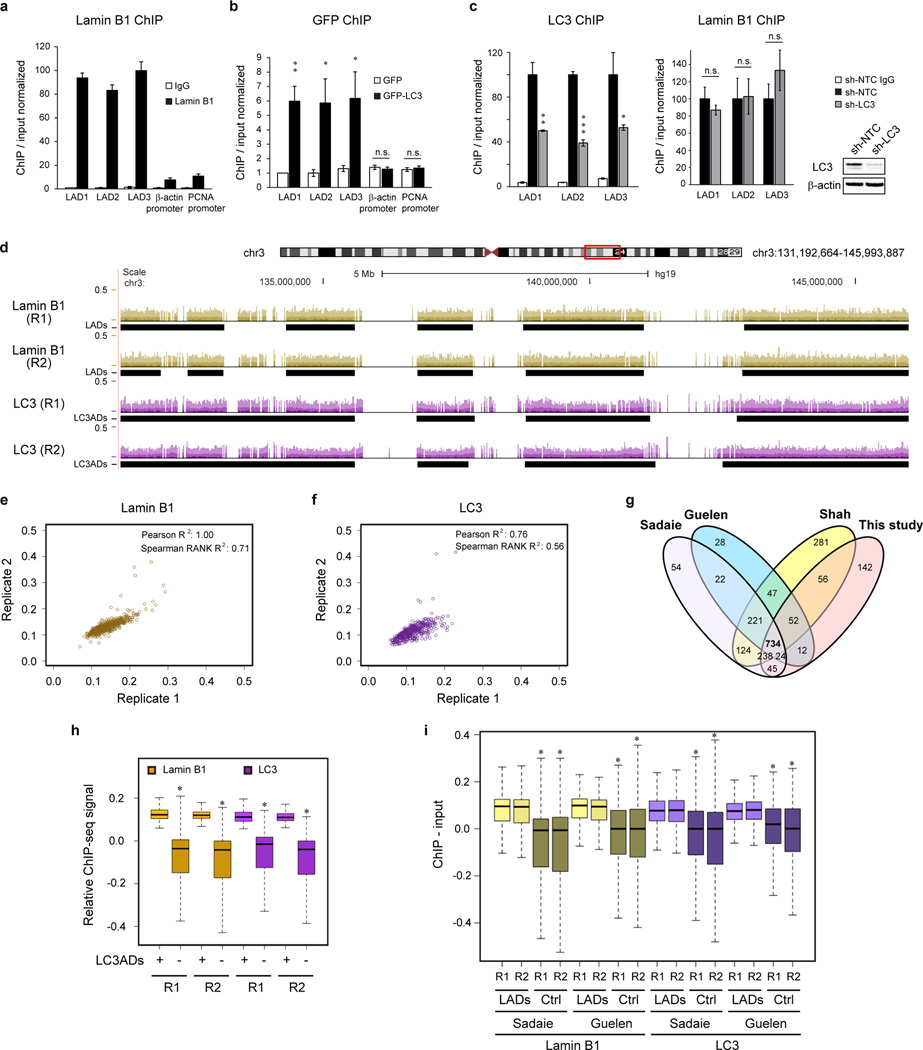
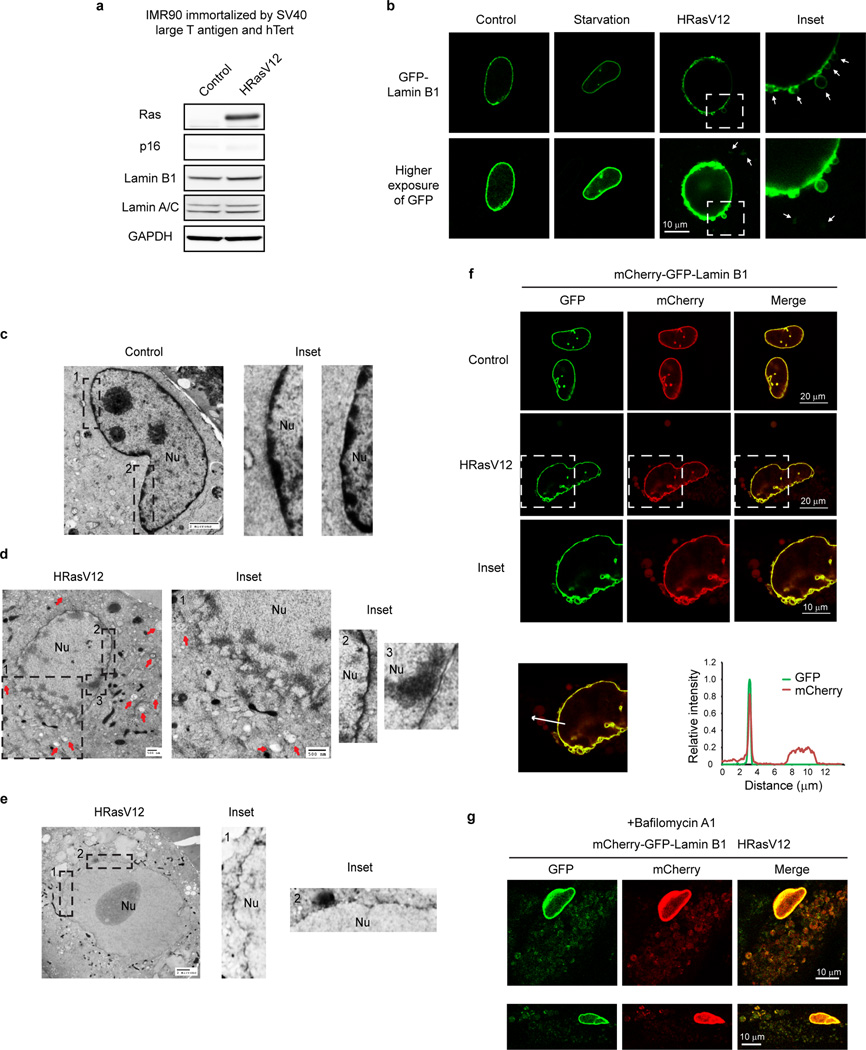
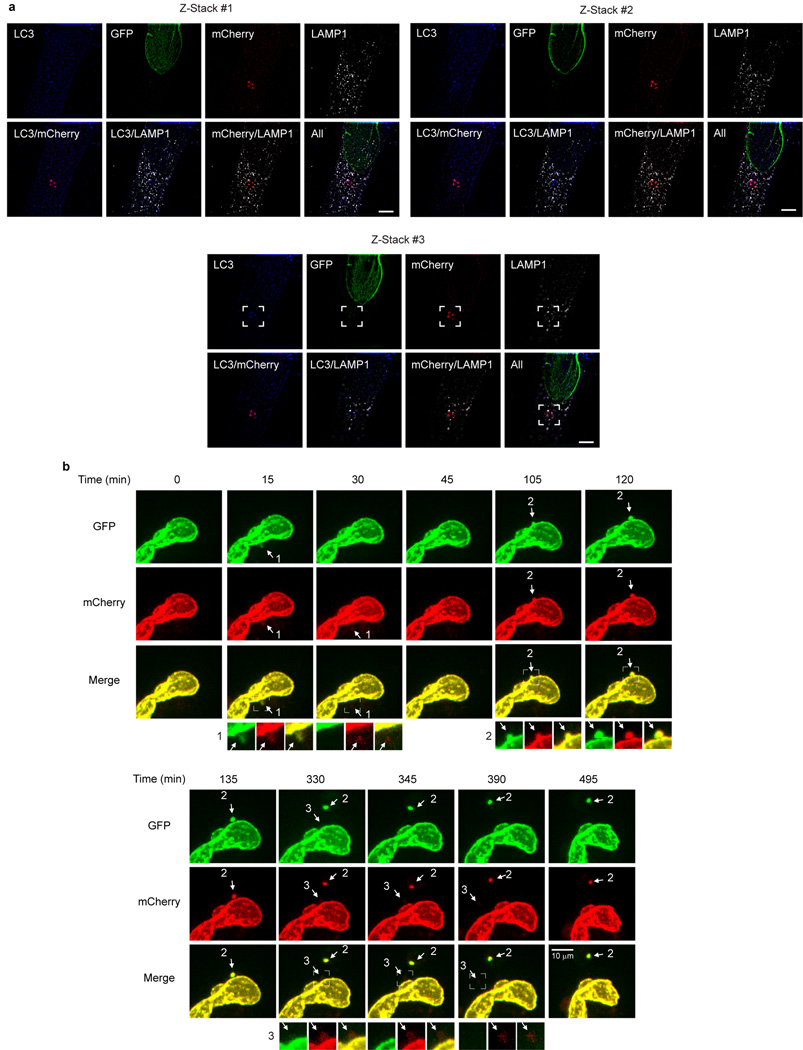
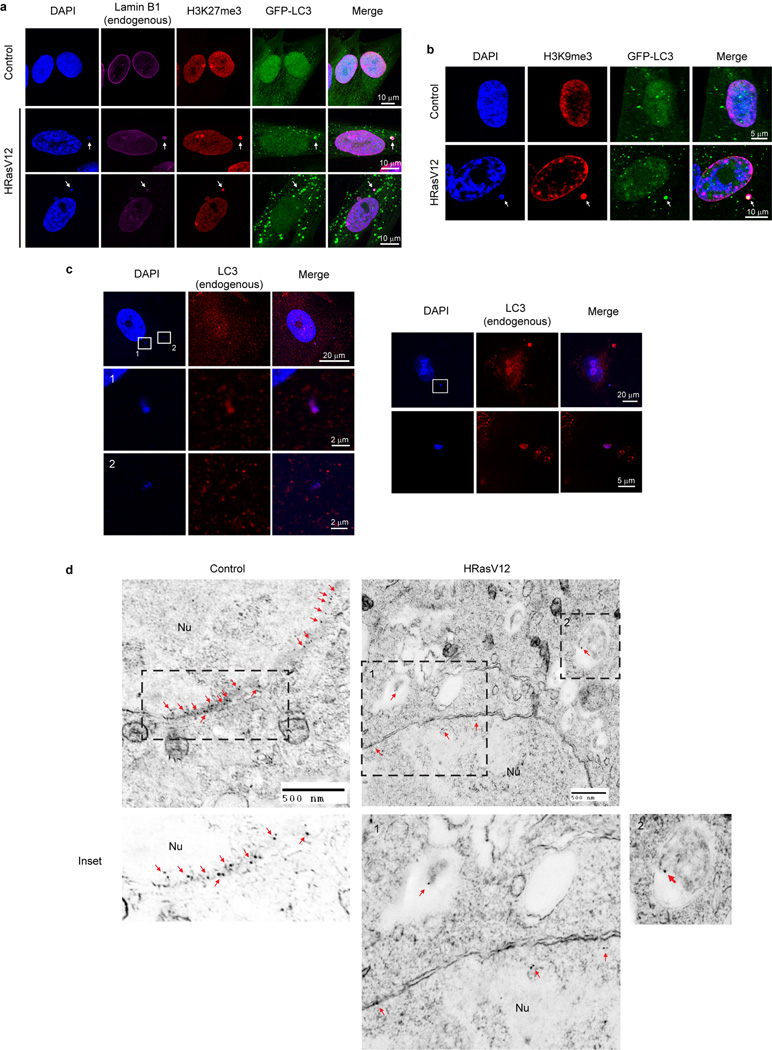
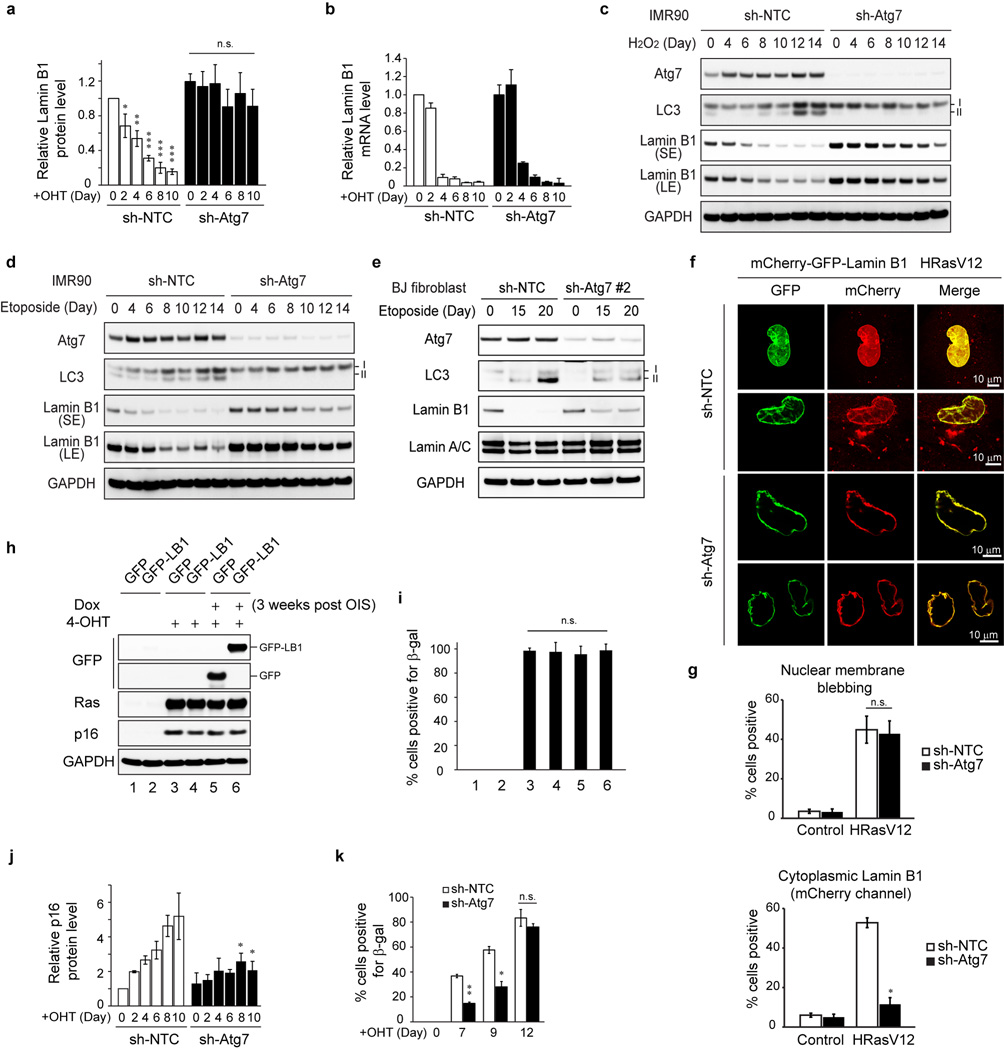
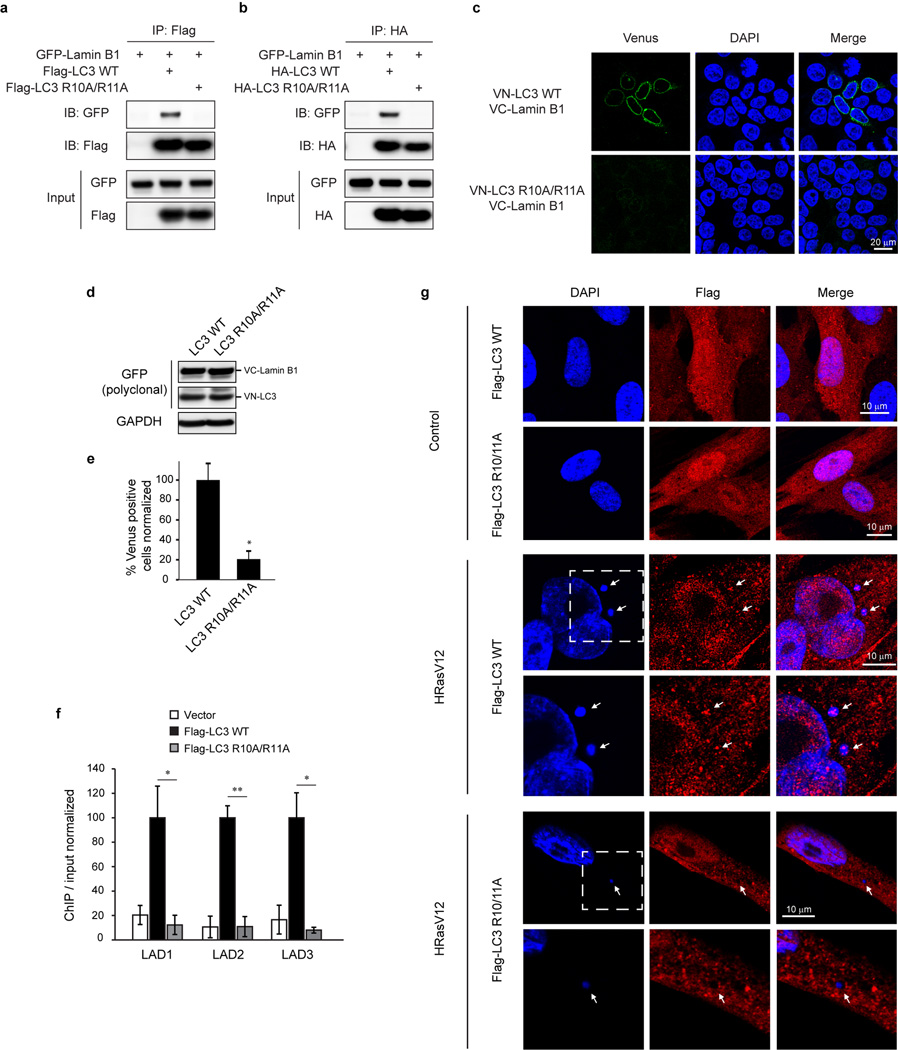
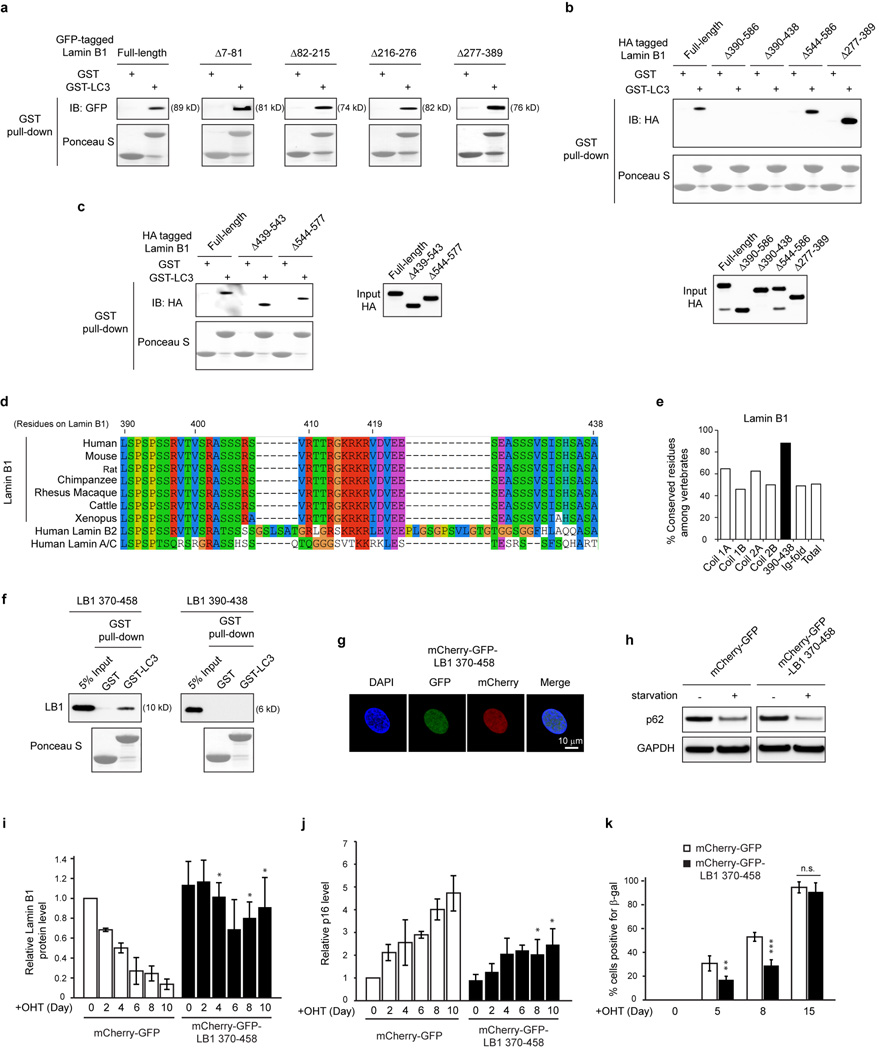
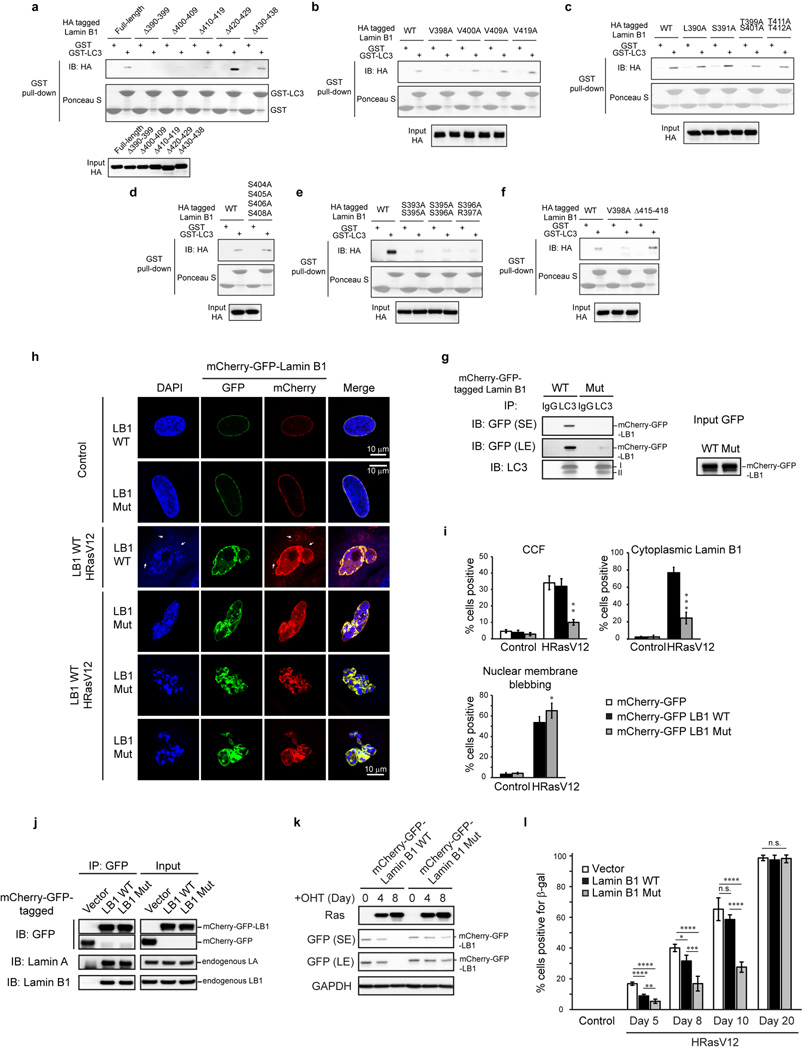
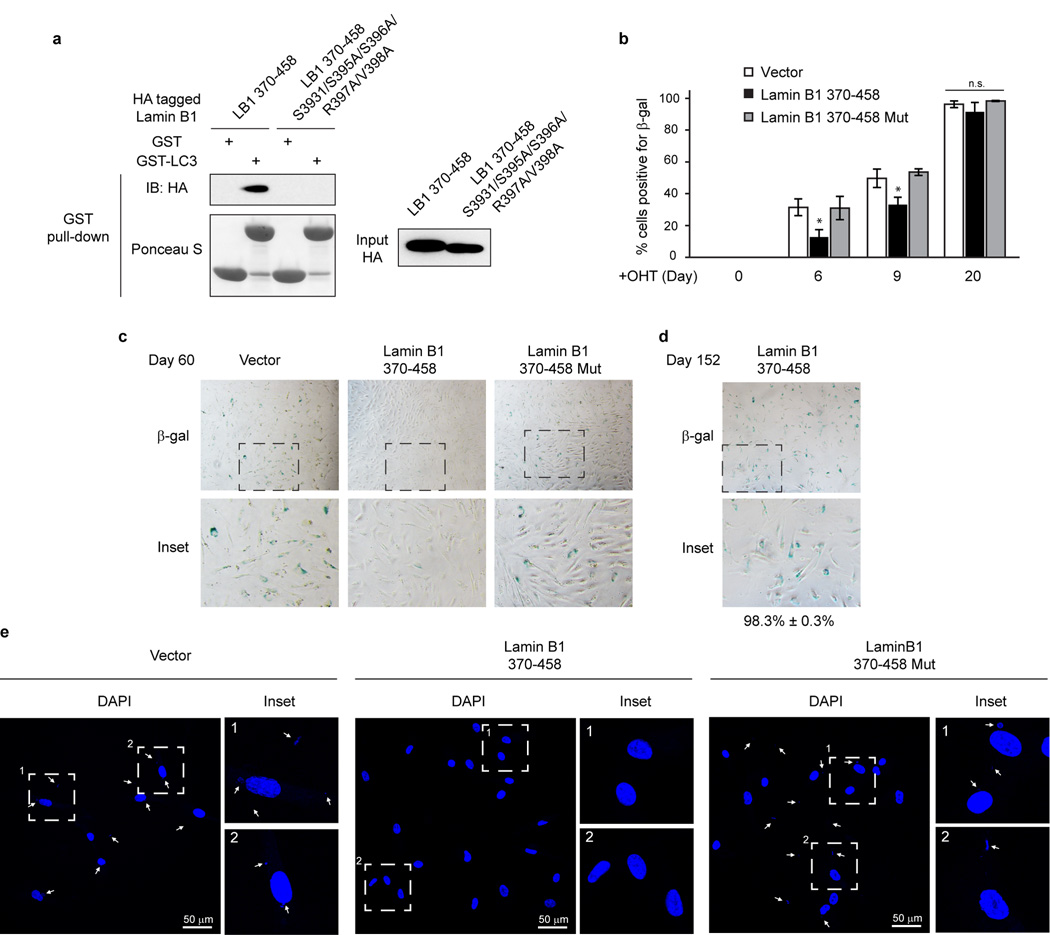
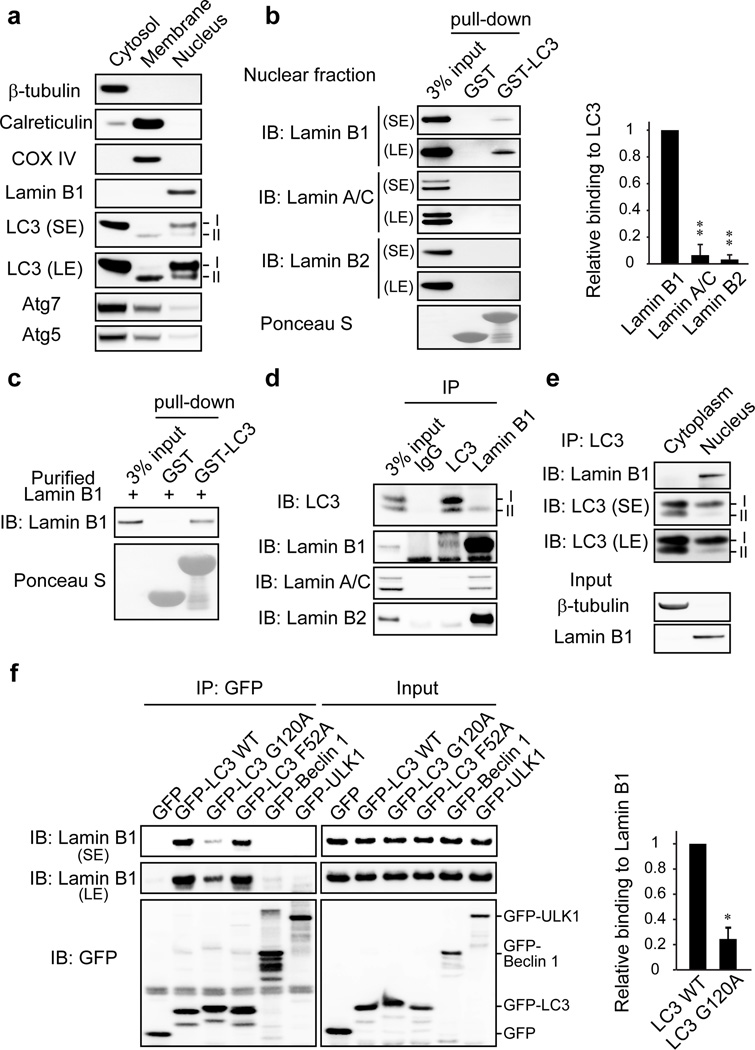
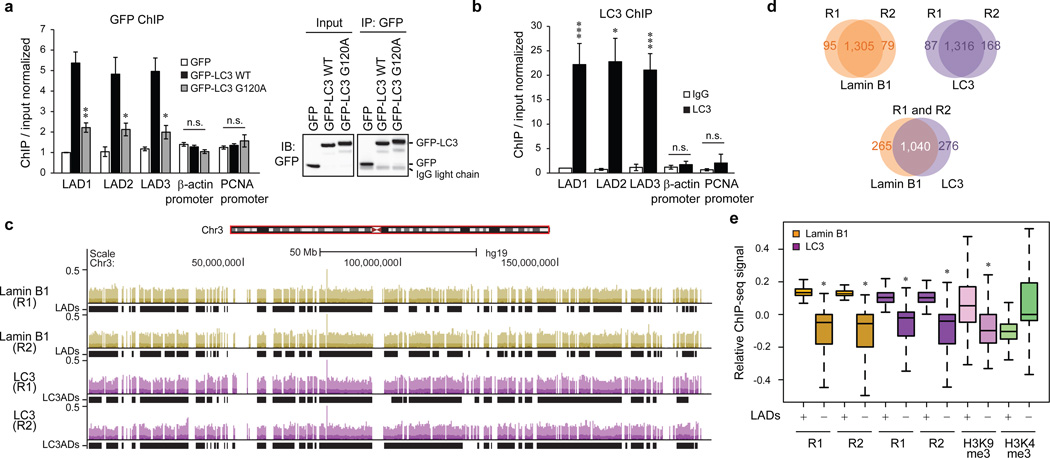
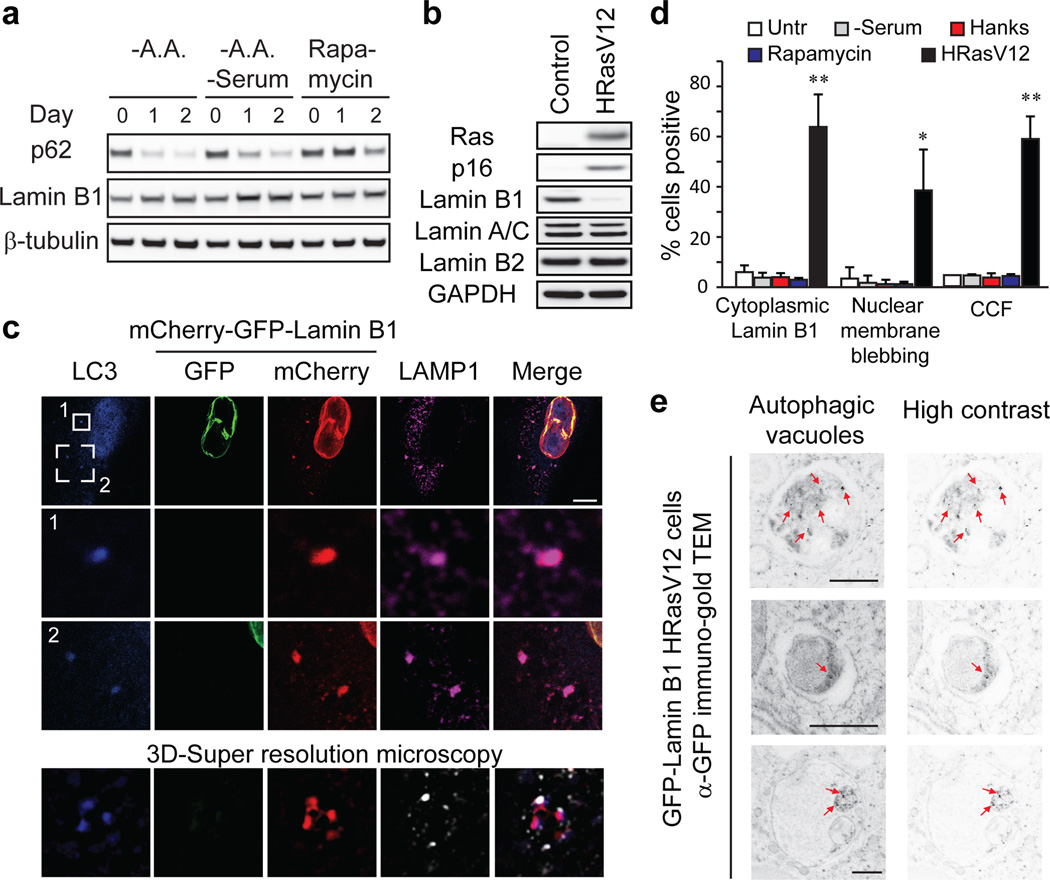
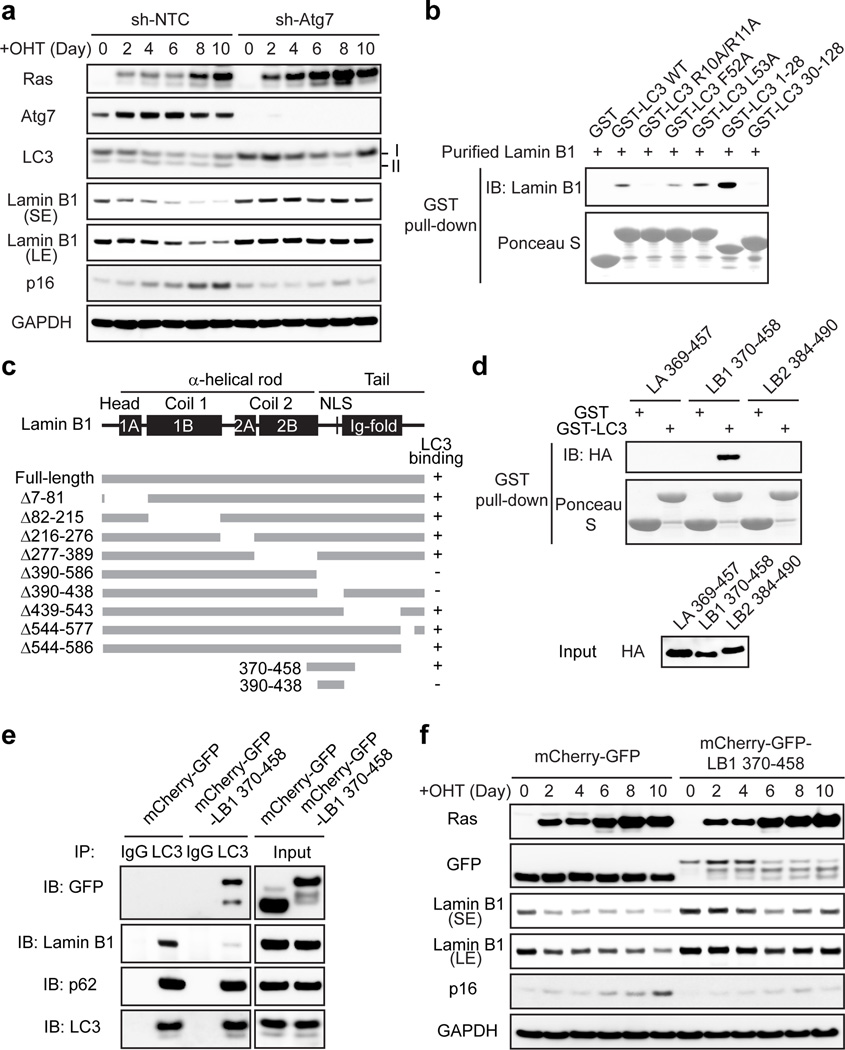
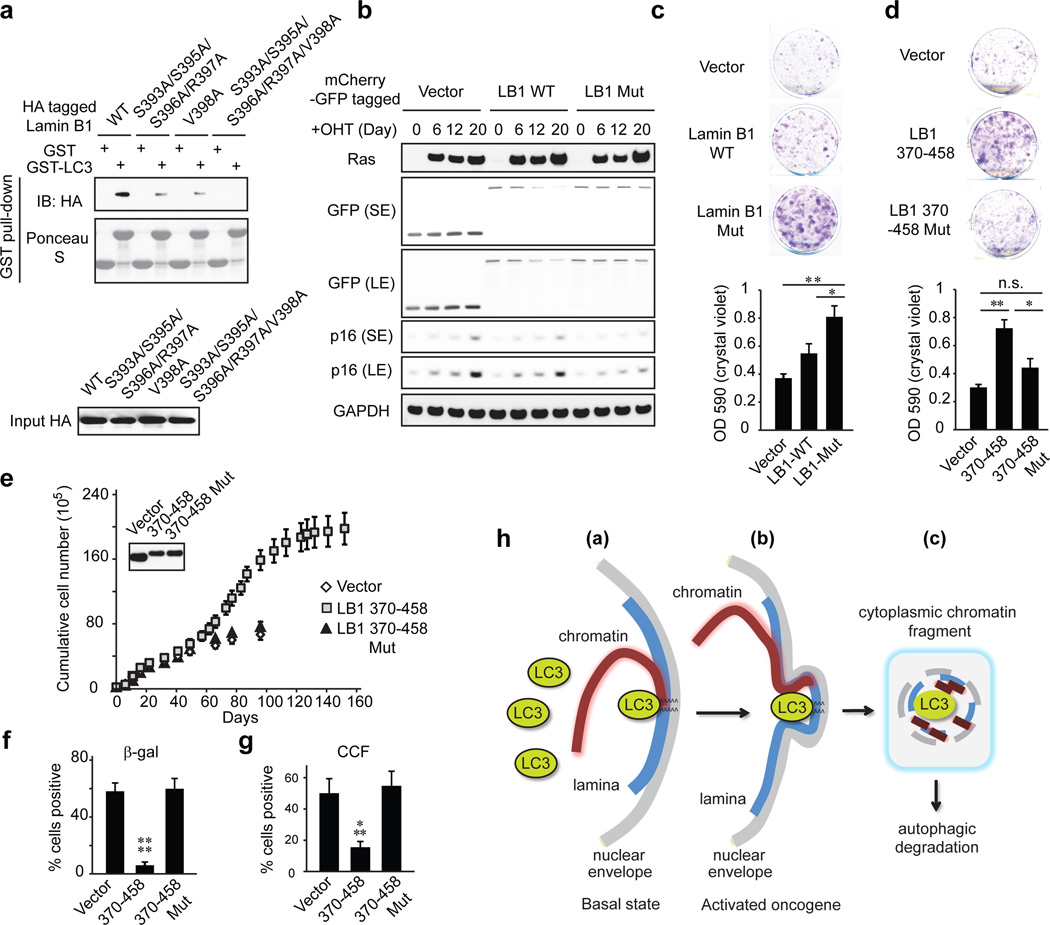
Macroautophagy (hereafter referred to as autophagy) is a catabolic membrane trafficking process that degrades a variety of cellular constituents and is associated with human diseases. Although extensive studies have focused on autophagic turnover of cytoplasmic materials, little is known about the role of autophagy in degrading nuclear components. Here we report that the autophagy machinery mediates degradation of nuclear lamina components in mammals. The autophagy protein LC3/Atg8, which is involved in autophagy membrane trafficking and substrate delivery, is present in the nucleus and directly interacts with the nuclear lamina protein lamin B1, and binds to lamin-associated domains on chromatin. This LC3-lamin B1 interaction does not downregulate lamin B1 during starvation, but mediates its degradation upon oncogenic insults, such as by activated RAS. Lamin B1 degradation is achieved by nucleus-to-cytoplasm transport that delivers lamin B1 to the lysosome. Inhibiting autophagy or the LC3-lamin B1 interaction prevents activated RAS-induced lamin B1 loss and attenuates oncogene-induced senescence in primary human cells. Our study suggests that this new function of autophagy acts as a guarding mechanism protecting cells from tumorigenesis.


Figures

Extended Data Figure 1
Extended Data Figure 1. Characterization of LC3 and Lamin B1 association
a, Protein gel staining of purified Lamin B1 protein. b, c, Purified Lamin B1 protein was subjected to GST pulldown. d, Endogenous LC3 IP in HEK293T cells. e, IMR90 stably expressing GFP-LC3 constructs were starved and imaged. f, Endogenous co-IP in wild-type and Atg5 knock-out MEFs. g, Nuclear fractions of control and Atg7 knockdown IMR90 cells were analyzed by LC3 IP. h–j, BiFC analysis of LC3-Lamin B1 interaction. HeLa were transfected with indicated combination of split Venus constructs and analyzed as followed. h, Cells were fixed and imaged. i, Lysates were analyzed by immunoblotting. j, Cells were scored for Venus positivity. Bars are the mean ± s.d.; n=4, with over 500 cells; * P < 0.001; unpaired two-tailed Student’s t-test.
Extended Data Figure 2
Extended Data Figure 2. LC3 interacts with LADs on chromatin
a, b, ChIP-qPCR of proliferating IMR90. c, ChIP-qPCR of LC3 knockdown IMR90. Bars are the mean ± s.e.m (a, b), s.d. (c); n=3; * P < 0.05, ** P < 0.005, *** P < 0.0001; n.s., non-significant; unpaired two-tailed Student’s t-test. d–i, ChIP-sequencing analyses. d, related to Fig. 2c, a zoom-in window of chromosome 3. e, f, Analyses of two replicates at LADs and LC3ADs. g, Per-nucleotide overlap of published datasets with the LADs called from this study. Number unit: megabase. h, Enrichment over LC3ADs. * P < 2.2×10⁻¹⁶; one-sided Wilcoxon test. i, Analysis of our Lamin B1 and LC3 ChIP-seq at LADs defined by other studies, and randomly sampled non-LADs loci (Ctrl). * P < 2.2×10⁻¹⁶; one-sided Wilcoxon test.
Extended Data Figure 3
Extended Data Figure 3. Lamin B1 degradation upon HRasV12-induced senescence
a, Related to Fig. 3b. Immunoblotting of immortalized IMR90. b, GFP-Lamin B1 stably expressing IMR90 were treated as indicated and imaged. Cytoplasmic signals are indicated by arrows. c–e, TEM analyses of IMR90. Nu: nucleus. f, IMR90 stably expressing mCherry-GFP-Lamin B1 were imaged and quantified. g, Cells as in f were treated with bafilomycin A1 and imaged under confocal microscopy.
Extended Data Figure 4
Extended Data Figure 4. Imaging analyses of mCherry-GFP-Lamin B1 HRasV12 cells
a, Related to Fig. 3c. mCherry-GFP-Lamin B1 stably expressing IMR90 were imaged by 3D-super resolution microscopy. Sections shown span the top, middle, and bottom layers of the cell. The mCherry channel was deliberately under-exposed to prevent over-saturation of the cytoplasmic signals. Scale bar: 5 µm. The insets are presented in Fig. 3c. b, Live-cell imaging of mCherry-GFP-Lamin B1 HRasV12 IMR90. Images shown are the maximum-projection combining all Z-sections. Nucleus-to-cytoplasm transport events are labelled sequentially as indicated. Note the initial yellow signal, followed by disappearance of GFP then mCherry, in events 1 and 3; event 2 was not yet degraded by the end of the imaging.
Extended Data Figure 5
Extended Data Figure 5. CCF and Lamin B1 are targeted by autophagy
a, b, IMR90 stably expressing GFP-LC3 and HRasV12 were stained with indicated antibodies and imaged under confocal microscopy. Cytoplasmic events are labelled by arrows. c, HRasV12 IMR90 were stained with LC3 antibody. d, Related to Fig. 3e, immuno-TEM analysis of GFP-Lamin B1 IMR90. Cells were stained with a GFP antibody and conjugated with 10 nm gold-particles. Nu: nucleus. Gold-particles are indicated by arrows.
Extended Data Figure 6
Extended Data Figure 6. Knockdown of Atg7 attenuates Lamin B1 downregulation
a, Related to Fig. 4a, quantification of Lamin B1 immunoblots. Bars are the mean ± s.e.m.; n=3; * P < 0.05, ** P < 0.005, *** P < 0.0001, compared with sh-NTC Day 0; n.s., non-significant. b, RT-qPCR of cells as in Fig. 4a. Data are the mean normalized to GAPDH ± s.e.m.; n=3. c, d, IMR90 were treated as indicated and analyzed by immunoblotting. e, BJ were treated with etoposide and analyzed by immunoblotting. f, g, Atg7 knockdown inhibits mCherry-GFP-Lamin B1 nucleus-to-cytoplasm transport. Bars are mean ± s.d.; n=4, over 100 cells; * P < 0.0001. h, i, ER:HRasV12 BJ stably expressing Dox-inducible GFP or GFP-Lamin B1 were either left uninduced (#1 and #2), or induced with 4-OHT for 3 weeks (#3 to #6). Cells were then induced with Dox (in the presence of 4-OHT) for additional 2 weeks (#5 and #6). i, Quantification of β-gal positivity. Bars are the mean ± s.d.; n=4, over 200 cells. j, Related to Fig. 4a, quantification of p16 immunoblots. Bars are the mean ± s.e.m.; n=3; * P < 0.05, compared to corresponding sh-NTC controls. k, ER:HRas IMR90 were scored for β-gal positivity. Bars are the mean ± s.d.; n=4, over 200 cells; * P < 0.0005, ** P < 0.0001. One-way ANOVA coupled with Tukey’s post hoc test for a and i; all other tests are unpaired two-tailed Student’s t-test.
Extended Data Figure 7
Extended Data Figure 7. LC3 R10 and R11 are essential for Lamin B1 binding
a, b, HEK293T cells were transfected as indicated and analyzed by co-IP. c–e, BiFC analyses in HeLa cells transfected with indicated combination of split Venus constructs. Bars are mean ± s.d.; n=4, over 500 cells; * P < 0.0001. f, IMR90 stably expressing indicated constructs were analyzed by Flag ChIP. Bars are mean ± s.e.m.; * P < 0.05, ** P < 0.005; unpaired two-tailed Student’s t-test for e and f. g, LC3 R10 and R11 are necessary for colocalization with CCF in HRasV12 IMR90. CCFs are indicated with arrows.
Extended Data Figure 8
Extended Data Figure 8. Mapping of LC3-Lamin B1 interaction
a, HEK293T cells transfected with indicated constructs were analyzed by GST-LC3B pulldown. b, c, In vitro translated constructs were subjected to GST-LC3B pulldown. d, e, Evolutionary analyses of vertebrate Lamin B1 and the corresponding regions of other lamin isoforms. e, Number of conserved residues normalized to total residues. f, Bacterially purified fragments were analyzed by GST-LC3B pulldown. g, mCherry-GFP-Lamin B1 370–458 localizes to the nucleus. h, Cells were starved and analyzed by immunoblotting. i, j, Related to Fig. 4f, quantification of Lamin B1 and p16 immunoblots. n=3. k, ER-HRasV12 IMR90 were scored for β-gal positivity. n=4, over 200 cells. Bars are the mean ± s.e.m. (i and j), s.d. (k); n.s., non-significant; * P < 0.05; ** P < 0.0005; *** P < 0.0001; unpaired two-tailed Student’s t-test.
Extended Data Figure 9
Extended Data Figure 9. Additional characterization of Lamin B1 substitution mutant
a–f, Related to Fig. 5a, in vitro translated proteins were analyzed by GST-LC3B pulldown. g, LC3 IP in HEK293T cells transfected as indicated. The remaining interaction with the mutant is likely due to the endogenous Lamin B1 that interacts with LC3 and the mutant, as shown in j. h, i, IMR90 were imaged under confocal microscopy and quantified. Bars are the mean ± s.d.; n=4, over 200 cells; * P < 0.05, ** P < 0.005, *** P < 0.0001; unpaired two-tailed Student’s t-test. j, HEK293T transfected were analyzed by IP. k, ER:HRasV12 IMR90 were induced with OHT and harvested for immunoblotting. l, IMR90 were quantified for β-gal positivity. Bars are the mean ± s.d.; n=4, over 200 cells; * P < 0.05, ** P < 0.01, *** P < 0.001, **** P < 0.0001, n.s., non-significant; one-way ANOVA coupled with Tukey’s post hoc test.
Extended Data Figure 10
Extended Data Figure 10. Lamin B1 370–458 fragment extends cellular lifespan
a, In vitro translated proteins were analyzed by GST-LC3B pulldown. b. ER:HRasV12 IMR90 were quantified for β-gal positivity. Bars are the mean ± s.d.; n=4, over 200 cells; * P < 0.05; n.s., non-significant; one-way ANOVA coupled with Tukey’s post hoc test. c,d, Related to Fig. 5f, Representative images of β-gal. e, Related to Fig. 5g, cells were fixed and stained with DAPI. CCFs are indicated by arrows.
Figure 1
Figure 1. LC3 interacts with nuclear lamina protein Lamin B1
a, Proliferating young IMR90 cells were subjected to subcellular fractionation and immunoblotting. SE: short-exposure; LE: long-exposure. b, The nuclear fraction of IMR90 was pulled down with bacterially purified GST or GST-LC3B. c, GST-LC3B pulldown of purified Lamin B1 protein. d, Endogenous IP (immuno-precipitation) in IMR90. e, LC3 IP of IMR90 fractions. f, HEK293T transfected were subjected to GFP IP and immunoblotting. Bars are the mean ± s.e.m.; n=3; * P<0.001. ** P<0.0001; one-way ANOVA coupled with Tukey’s post hoc test (b); unpaired two-tailed Student’s t-test (f). Uncropped blots are in Supplementary Figure.
Figure 2
Figure 2. LC3 associates with LADs on chromatin
a, IMR90 stably expressing GFP-tagged constructs were subjected to GFP ChIP-qPCR. Uncropped blots are in Supplementary Figure. b, LC3 ChIP-qPCR. Bars are the mean ± s.e.m.; n=3; * P<0.05, ** P<0.01, *** P<0.005; n.s., non-significant; unpaired two-tailed Student’s t-test. c–e, ChIP-sequencing analyses in proliferating IMR90. c, Representative tracks over the whole chromosome 3, for both replicates. d, Overlap of LADs and LC3ADs between two replicates and Lamin B1 and LC3. e, ChIP-seq enrichment over LADs (+) and randomly selected non-LADs control regions (−). One-sided Wilcoxon test; * P<2.2×10⁻¹⁶, P=1 for H3K4me3.
Figure 3
Figure 3. Lamin B1 is an autophagy substrate in response to oncogene activation
a, b, Primary IMR90 were treated as indicated and subjected to immunoblotting. A.A.: amino acids. Uncropped blots are in Supplementary Figure. c, IMR90 stably expressing mCherry-GFP-Lamin B1 and HRasV12 were stained with LC3 and LAMP1 antibodies, and analyzed by confocal or 3D-super resolution microscopy. Scale bar: 10 µm. d, mCherry-GFP-Lamin B1 IMR90 were treated as indicated. Bars are the mean ± s.d.; n=4; * P<0.01, ** P<0.001; one-way ANOVA coupled with Tukey’s post hoc test. e, Immuno-TEM analysis of IMR90 stably expressing GFP-Lamin B1 and HRasV12. Gold nanoparticles are indicated by arrows, and are highlighted on right.
Figure 4
Figure 4. Inhibiting autophagy or the LC3-Lamin B1 interaction impairs Lamin B1 degradation
a, ER:HRasV12 IMR90 stably expressing non-targeting control (sh-NTC) or sh-Atg7 hairpin were induced by OHT (4-hydroxytamoxifen) and analyzed by immunoblotting. b, Purified Lamin B1 protein was subjected to pull-down of GST-LC3B wild-type (WT) or mutants. c, Schematic illustration of Lamin B1 mutants in binding to LC3. d, Regions from Lamin A, B1, and B2 were subjected to GST-LC3B pulldown. e, HEK293T transfected were subjected to LC3 IP. f, ER:HRasV12 IMR90 were induced by OHT and analyzed by immunoblotting. Uncropped blots are in Supplementary Figure.
Figure 5
Figure 5. LC3-Lamin B1 interaction is required for Lamin B1 degradation and cellular senescence
a, In vitro translated proteins were subjected to GST-LC3B pulldown. b, BJ ER:HRasV12 were analyzed by immunoblotting. Uncropped blots are in Supplementary Figure. c, d, Colony formation analysis of BJ ER:HRasV12. e, Mid-life BJ stably expressing mCherry-GFP-tagged constructs were recorded for growth. Uncropped blots are in Supplementary Figure. f, Day 60, quantified for β-gal positivity. g, Day 101, quantified for cytoplasmic DAPI. Bars are the mean ± s.e.m. (c and d), s.d. (f and g); n=3 (c and d), n=4 (f and g); * P<0.05, ** P<0.01, *** P<0.001, **** P<0.0001; n.s., non-significant; one-way ANOVA coupled with Tukey’s post hoc test. h, Schematic illustration of autophagy degradation of nuclear lamina.

Comment in

References

    1. Levine B, Kroemer G. Autophagy in the pathogenesis of disease. Cell. 2008;132:27–42. - PMC - PubMed
    1. Mizushima N, Levine B, Cuervo AM, Klionsky DJ. Autophagy fights disease through cellular self-digestion. Nature. 2008;451:1069–1075. - PMC - PubMed
    1. Choi AM, Ryter SW, Levine B. Autophagy in human health and disease. N Engl J Med. 2013;368:1845–1846. - PubMed
    1. Kabeya Y, et al. LC3, a mammalian homologue of yeast Apg8p, is localized in autophagosome membranes after processing. Embo J. 2000;19:5720–5728. - PMC - PubMed
    1. Mizushima N, Yoshimori T, Ohsumi Y. The role of Atg proteins in autophagosome formation. Annu Rev Cell Dev Biol. 2011;27:107–132. - PubMed

Supplemental References

    1. Dou Z, et al. Class IA PI3K p110beta subunit promotes autophagy through Rab5 small GTPase in response to growth factor limitation. Mol Cell. 2013;50:29–42. - PMC - PubMed
    1. Wiederschain D, et al. Single-vector inducible lentiviral RNAi system for oncology target validation. Cell Cycle. 2009;8:498–504. doi:7701. - PubMed
    1. Kirkin V, et al. A role for NBR1 in autophagosomal degradation of ubiquitinated substrates. Mol Cell. 2009;33:505–516. - PubMed
    1. Pan JA, Ullman E, Dou Z, Zong WX. Inhibition of protein degradation induces apoptosis through a microtubule-associated protein 1 light chain 3-mediated activation of caspase-8 at intracellular membranes. Mol Cell Biol. 2011;31:3158–3170. - PMC - PubMed
    1. Zhong Y, et al. Distinct regulation of autophagic activity by Atg14L and Rubicon associated with Beclin 1-phosphatidylinositol-3-kinase complex. Nat Cell Biol. 2009;11:468–476. - PMC - PubMed

Publication types

MeSH terms

Associated data