. 2015 Nov 9;28(5):638-652.
doi: 10.1016/j.ccell.2015.09.022. Epub 2015 Oct 29.

T Cells Engineered against a Native Antigen Can Surmount Immunologic and Physical Barriers to Treat Pancreatic Ductal Adenocarcinoma

Affiliations

T Cells Engineered against a Native Antigen Can Surmount Immunologic and Physical Barriers to Treat Pancreatic Ductal Adenocarcinoma

Ingunn M Stromnes et al. Cancer Cell. .

Abstract

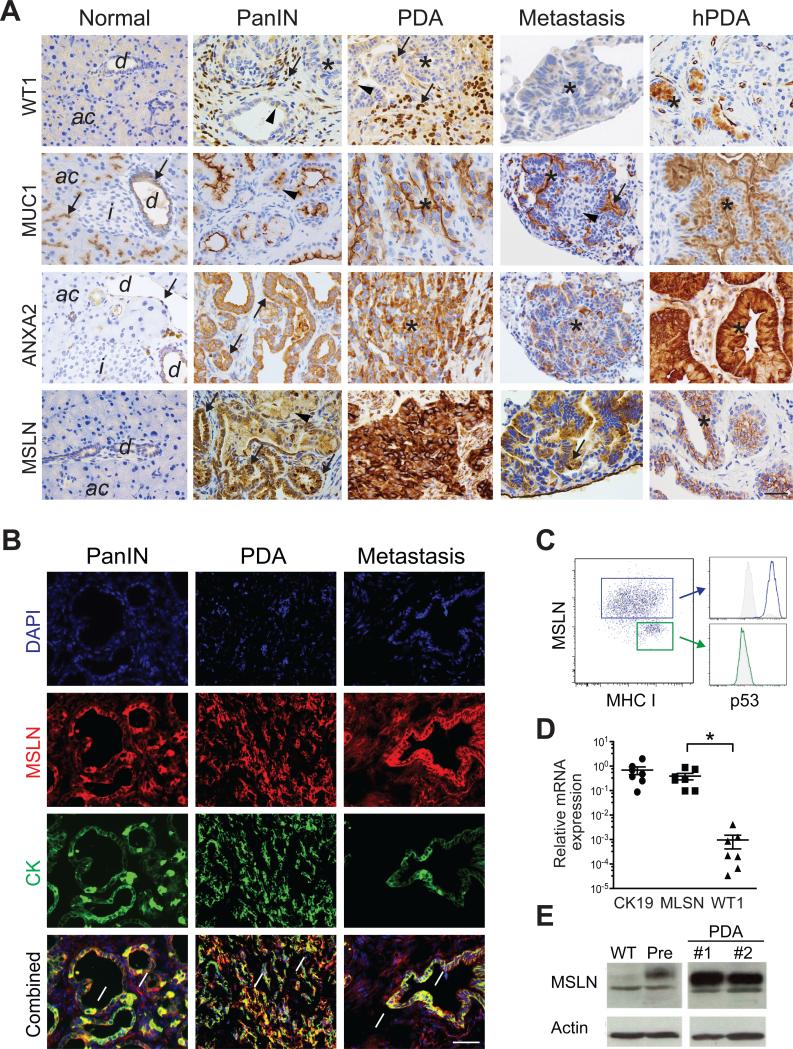
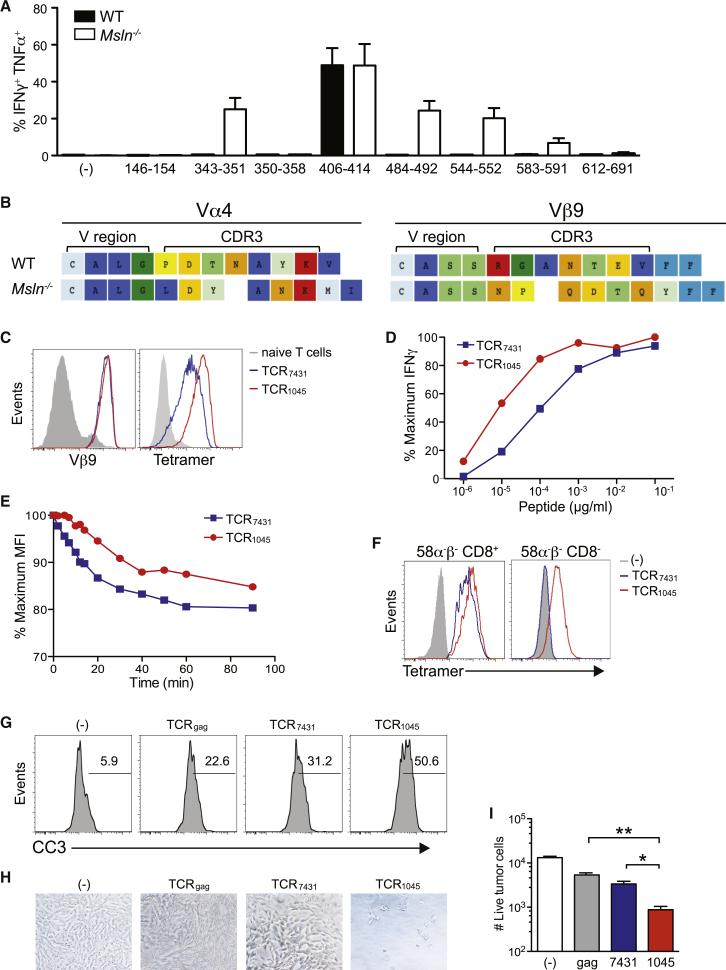
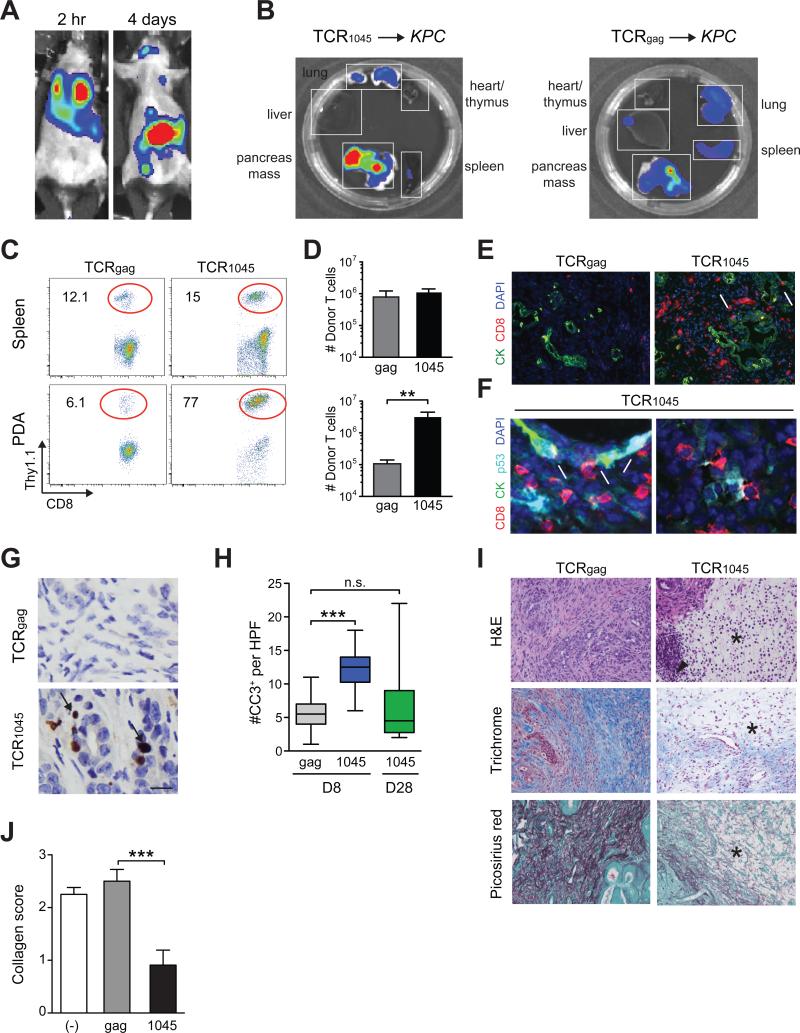
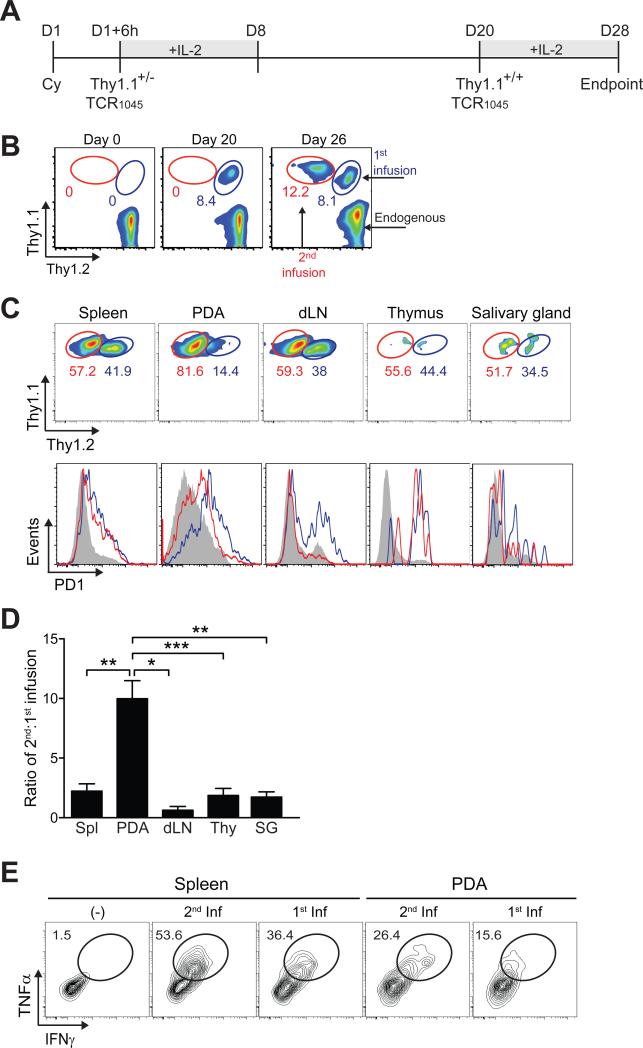
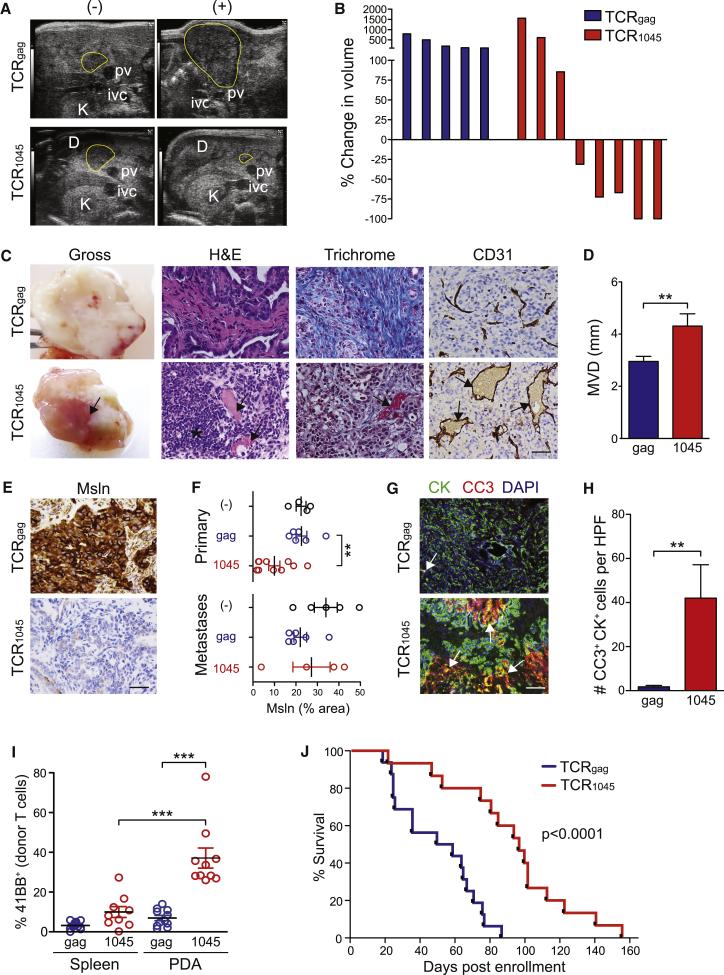
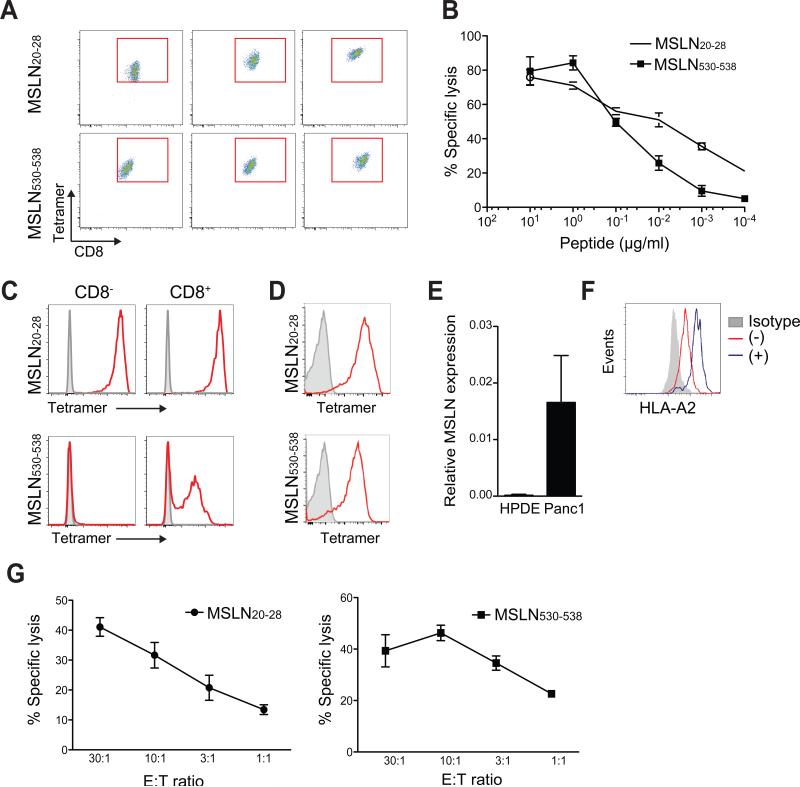
Pancreatic ductal adenocarcinomas (PDAs) erect physical barriers to chemotherapy and induce multiple mechanisms of immune suppression, creating a sanctuary for unimpeded growth. We tested the ability of T cells engineered to express an affinity-enhanced T cell receptor (TCR) against a native antigen to overcome these barriers in a genetically engineered model of autochthonous PDA. Engineered T cells preferentially accumulate in PDA and induce tumor cell death and stromal remodeling. However, tumor-infiltrating T cells become progressively dysfunctional, a limitation successfully overcome by serial T cell infusions that resulted in a near-doubling of survival without overt toxicities. Similarly engineered human T cells lyse PDA cells in vitro, further supporting clinical advancement of this TCR-based strategy for the treatment of PDA.


Figures

Figure 1
Figure 1. Tumor antigen expression in murine and human PDA
(A) Immunohistochemical analyses of target antigens in murine and human (hPDA) tissues. d, duct; ac, acini; i, islets; arrows, high expression; arrowheads, low-moderate expression; *, tumor epithelial cells. Scale bar, 25 μm. (B) Immunofluorescence for MSLN and cytokeratin (CK) in indicated KPC tissues. Arrows, MSLN+CK+ cells. Scale bar, 25 μm. (C) FACs plot of MSLN, MHC I and p53 in early passage (<3X) primary KPC PDA cells. (D) Relative expression of indicated mRNAs in primary KPC PDA cells. Each point represents an independent cell preparation. Mean ± SEM. (E) Immunoblot analyses of primary murine pancreatic ductal cells, primary preinvasive KC cells (Pre) and two independent invasive KPC PDA primary cell preparations. See also Figure S1.
Figure 2
Figure 2. Cloning and expression of the enhanced-affinity TCR1045 MSLN406-414-specific TCR
(A) Epitope mapping of MSLN-specific T cells derived from WT and MSLN−/− mice. (B) CDR3 sequences of Vα4 and Vβ9 chains cloned from the highest avidity MSLN406-414-specific T cell clones isolated from WT and MSLN−/− mice. (C) Expression of MSLN406-414-specific TCR derived from WT (TCR7431) or MSLN−/− (TCR1045) mice in P14 T cells after 2 in vitro stimulations. (D) Functional avidity of engineered T cells assessed by intracellular IFNγ (normalized to maximum response). (E) Dissociation kinetics of tetramer binding. (F) Tetramer binding by 58αβ cells expressing TCR7431 or TCR1045 with or without CD8 co-receptor. (G) Apoptosis of MHC class I+ KPC tumor cells following incubation with engineered T cells. (H) Residual adherent tumor cells following incubation (5 hr) with specified T cells. (I) Number of live adherent tumor cells in (H) (assessed by trypan blue exclusion). Data are shown as mean ± SEM. See also Figure S2.
Figure 3
Figure 3. Biodistribution and in vivo effects of genetically engineered TCR1045 T cells
(A) Biodistribution of TCR1045 T cells 2 hr and 4 days post transfer into KPC mouse. (B) Distribution of donor TCR1045 or TCRgag cells in tissues ex vivo 8 days post transfer. (C) Donor T cell frequency 8 days post transfer. Plots are gated on CD45+CD8+ cells. (D) Number of donor T cells isolated from spleen (top) and tumor (bottom) 8 days post transfer. (E) Immunofluorescence for CD8 and CK in primary tumors 8 days post transfer. Scale bar, 50 μm; arrows, CD8 T cells adjacent to epithelium. (F) Immunofluorescence for indicated molecules in primary tumors 8 days post TCR1045 cell transfer. Arrows, CD8 T cells adjacent to p53+CK19+ tumor cells; arrowheads, p53+CK19 cells in the stroma. Scale bar, 10 μm. (G) IHC for cleaved-caspase 3 (CC3) in PDA at day 8. Arrows, CC3+ cells. Scale bar, 10 μm. (H) Tumor apoptosis 8 and 28 days post T cell transfer. (I) Histology of pancreatic tumors 8 days post T cell transfer. *, absence of interstitial pink (H&E), blue (Masson's trichrome) and red (Picosirius) stain reflects a loss in ECM collagen content. Arrowhead, infiltrating mononuclear cells. Scale bar, 50 μm. (J) Quantification of collagen content in tumors from (I). Data are shown as mean ± SEM. See also Figure S3.
Figure 4
Figure 4. Tumor-infiltrating TCR1045 T cells have a phenotypic signature consistent with antigen recognition and are dysfunctional
(A) Donor TCR1045 cell frequency 28 days post T cell transfer. Plots are gated on CD45+CD8+ T cells. (B) Donor TCR1045 cell frequency in spleens (Spl) and tumors 8 (D8) or 28 (D28) days post T cell transfer. (C) Number of donor TCR1045 cells 8 or 28 days post T cell transfer.. (D) Tetramer staining of splenic and intratumoral donor TCR1045 cells 28 days post transfer. (E) Phenotype of donor (CD8+Thy1.1+) TCR1045 cells compared to concurrently isolated splenic host (CD8+Thy1.1) T cells 28 days post transfer. (F) Frequency or MFI of donor T cells positive for indicated antigens in spleen and PDA. Mean ± SEM, n=3 each. (G) Inhibitory receptor expression by donor TCR1045 cells and endogenous T cells. (H) Frequency of donor TCR1045 cells expressing indicated molecules 28 days post T cell transfer. (I) Ex vivo cytokine production by T cells in presence (+) or absence (−) of antigen 8 days post T cell transfer. (J) Donor T cell frequencies producing both IFNγ and TNFα after 5 hr restimulation with antigen. Data are shown as mean ± SEM. See also Figure S4.
Figure 5
Figure 5. A second infusion of engineered TCR1045 cells also preferentially accumulates in PDA
(A) Schematic of congenically distinct T cell infusions into same KPC recipients. Cyclophosphamide (Cy) was administered prior to the 1st infusion only. (B) Circulating CD8 T cells prior to transfer (D0), 20 days following first infusion of TCR1045 Thy1.1+/− cells (D20), and 6 days following second infusion of TCR1045 Thy1.1+/+ cells (D26). (C) Preferential accumulation and phenotype of second TCR1045 infusion in PDA (gated on CD8+Thy1.1+ cells). Concurrent PD1 expression on donor T cells from first (blue lines) and second (red lines) infusions. Grey histograms represent endogenous CD8+Thy1.1 T cells. (D) Ratio of persisting cells 8 days after second infusion. dLN, draining lymph node; Thy, thymus; SG, salivary gland. (E) Cytokine production by donor T cells at day 28 (see (A)). Cells were stimulated together and plots gated on CD8+ Thy1.1+/− (1st infusion) or CD8+ Thy1.1+/+ cells (2nd infusion). Data are shown as mean ± SEM.
Figure 6
Figure 6. Serial infusions of engineered TCR1045 T cells significantly prolongs survival of KPC mice with established PDA
(A) High-resolution ultrasound images of pancreatic head mass before (−) and after (+) TCRgag or TCR1045 cell therapy. D, duodenum; pv, portal vein; K, kidney; ivc, inferior vena cava. (B) Waterfall plots of best observed response by serial imaging (results confirmed by two investigators). (C) Gross and immunohistochemical analyses of PDA following T cell therapy. Arrows, blood flow and patent blood vessels; *, mononuclear cell infiltrate; scale bar, 25 μm. (D) Mean vessel diameter (MVD) in PDA. (E) MSLN expression in PDA following serial T cell infusions. Scale bar, 25 μm. (F) MSLN staining intensity in primary tumors and metastases following T cell therapy. Each dot represents a primary tumor or metastasis. (G) Dual immunofluorescence for apoptosis (CC3) in PDA epithelial cells (CK) following T cell therapy. Arrows, CK+CC3+ cells. Scale bar, 50 μm. (H) Quantification of data in (G). (I) Expression of 41BB by donor TCRgag and TCR1045 cells. Points represent individual animals. (J) Survival of KPC mice with invasive disease that received serial TCRgag (n=16) or TCR1045 (n=15) T cell therapy (54 days vs 96 days, respectively; p<0.0001). Data are shown as mean ± SEM. See also Figure S5 and Table S1.
Figure 7
Figure 7. Isolation, expression and characterization of cloned human TCR specific to MSLN epitopes
(A) Tetramer staining intensities of independently derived HLA-A2-restricted human T cell clones with the indicated specificities. Representative of 10-12 clones analyzed per epitope. (B) MSLN20-28 and MSLN530-538-specific T cell clone lysis of HLA-A2+ T2 target cells loaded with titrating concentrations of peptide. (C) Tetramer staining of CD8 and CD8+ Jurkat cells transduced with MSLN20-28- or MSLN530-538-specific TCR. (D) Tetramer staining of primary human CD8 T cells transduced with highest affinity MSLN20-28 or MSLN530-538-specific TCR. (E) MSLN expression in human pancreatic ductal epithelial (HPDE) and Panc-1 cell lines (normalized to GAPDH). (F) HLA-A2 expression by Panc-1 cells in the presence (+) or absence (−) of IFNγ. (G) Lysis of HLA-A2+MSLN+ Panc-1 cell line by human CD8 effector T cell clones at indicated effector:target (E:T) ratios. Data are shown as mean ± SD. See also Table S2.

Comment in

References

    1. Argani P, Iacobuzio-Donahue C, Ryu B, Rosty C, Goggins M, Wilentz RE, Murugesan SR, Leach SD, Jaffee E, Yeo CJ, et al. Mesothelin is overexpressed in the vast majority of ductal adenocarcinomas of the pancreas: identification of a new pancreatic cancer marker by serial analysis of gene expression (SAGE). Clin Cancer Res. 2001;7:3862–3868. - PubMed
    1. Bayne LJ, Beatty GL, Jhala N, Clark CE, Rhim AD, Stanger BZ, Vonderheide RH. Tumor-derived granulocyte-macrophage colony-stimulating factor regulates myeloid inflammation and T cell immunity in pancreatic cancer. Cancer Cell. 2012;21:822–835. - PMC - PubMed
    1. Beatty GL, Chiorean EG, Fishman MP, Saboury B, Teitelbaum UR, Sun W, Huhn RD, Song W, Li D, Sharp LL, et al. CD40 agonists alter tumor stroma and show efficacy against pancreatic carcinoma in mice and humans. Science. 2011;331:1612–1616. - PMC - PubMed
    1. Beatty GL, Haas AR, Maus MV, Torigian DA, Soulen MC, Plesa G, Chew A, Zhao Y, Levine BL, Albelda SM, et al. Mesothelin-specific chimeric antigen receptor mRNA-engineered T cells induce anti-tumor activity in solid malignancies. Cancer immunology research. 2014;2:112–120. - PMC - PubMed
    1. Bera TK, Pastan I. Mesothelin is not required for normal mouse development or reproduction. Mol Cell Biol. 2000;20:2902–2906. - PMC - PubMed

Publication types

MeSH terms