. 2015 Nov 3:5:15915.
doi: 10.1038/srep15915.

SIMcheck: a Toolbox for Successful Super-resolution Structured Illumination Microscopy

Affiliations

SIMcheck: a Toolbox for Successful Super-resolution Structured Illumination Microscopy

Graeme Ball et al. Sci Rep. .

Erratum in

Abstract

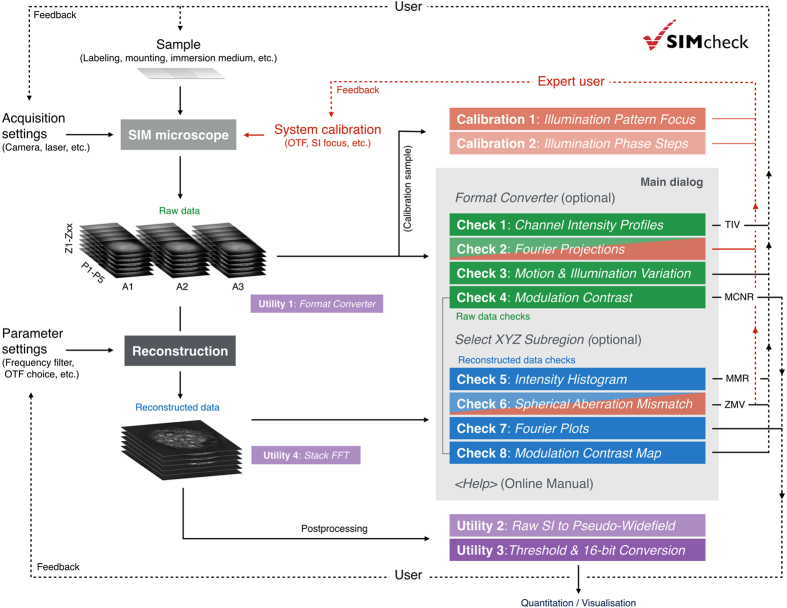
Three-dimensional structured illumination microscopy (3D-SIM) is a versatile and accessible method for super-resolution fluorescence imaging, but generating high-quality data is challenging, particularly for non-specialist users. We present SIMcheck, a suite of ImageJ plugins enabling users to identify and avoid common problems with 3D-SIM data, and assess resolution and data quality through objective control parameters. Additionally, SIMcheck provides advanced calibration tools and utilities for common image processing tasks. This open-source software is applicable to all commercial and custom platforms, and will promote routine application of super-resolution SIM imaging in cell biology.


Conflict of interest statement

The authors declare no competing financial interests.

Figures

Figure 1
Figure 1. Integration of SIMcheck functionalities to the SIM imaging workflow.
Solid lines represent the user’s workflow, and point from the various workflow steps to the applicable functions of SIMcheck. Dashed lines represent where SIMcheck’s output can inform user decisions, either in sample preparation, acquisition settings, reconstruction parameter settings, or system calibration. Colour codes are as follows: blue – raw data checks; green – reconstructed data checks; purple – utilities; red – applicable to expert users only.
Figure 2
Figure 2. SIMcheck output for raw SIM data.
(a) Representative images from a 3D-SIM dataset taken from a DAPI stained mouse C127 cell nucleus used for panels (be) (Supplementary Data S1). Data acquired on a GE OMX V3 Blaze instrument. Panels A1-A3 show the same plane with each of the three illumination angles. Insets show two-fold magnified and intensity-normalized view of the boxed region. Note the low contrast of the stripe pattern due to extensive out-of-focus blur contribution. (b) Channel Intensity Profiles, with total intensity variation (TIV) expressed as % within slices of a central 9-z-window in the three angles (marked light grey). In this example images from angle 3 show a markedly decreased intensity level (while there is little bleaching and intensity fluctuations) accounting for a total intensity variation of ~ 68%. (c) Raw Fourier Projection of the raw data in reciprocal space, with points of high-frequency information from first (inner) and second (outer spots) order stripes indicated by arrows. The presence of well-defined 1st and 2nd order spots in all three angles are a hallmark of optimal system calibration and generation of the structured illumination pattern. Arrowheads indicate less intense 2nd order spots in angle 3. (d) Motion & Illumination Variation assembly of phase-averaged and intensity-normalized images for each angle (left three panels, pseudo-coloured in cyan, magenta and yellow). The grey-white appearance of the CMY-merged output image (right panel) indicates motion stability and evenness of the illumination. (e) Modulation Contrast output with grey values indicating the modulation contrast-to-noise ratio (MCNR) values (left panel, greyscale). These values are then Otsu thresholded to select features and calculate a mean feature MCNR (central panel). The final representation uses a custom look-up-table to generate a heatmap of local MCNR values (right panel). Arrows indicate regions of saturated pixels with accordingly lower modulation contrast.
Figure 3
Figure 3. SIMcheck output for reconstructed SIM data.
(a) Lateral and orthogonal cross section of reconstructed data used for panels (bh), generated from raw data displayed in Fig. 2. (b) Reconstructed Intensity Histogram (bottom panel) showing the distribution of pixel intensities within the 32-bit data set on linear and logarithmic scales. Upper panel shows the areas below the mode intensity value that are discarded during thresholding. (c) The Thresholding & 16-bit conversion utility generates auto-thresholded composite TIFF stacks for further analysis and visualization (see also Supplementary Fig. S7). (d) Modulation Contrast Map combining the pixel intensity information of the reconstructed image with the colour information of respective MCN values (from Fig. 2e). Green colour indicates saturated pixels in the raw data that causes local reconstruction artifacts (arrow). Arrowheads in inset denote features in the nuclear interior of low modulation contrast (purple colour) in the corresponding raw data, compared to features with high underlying modulation contrast (orange-yellow) in the nuclear periphery. (eh) Fourier spectra display variations of lateral FFT (FTL, top), orthogonal FFT (FTO, middle) and radial profile plot (FTR, bottom; orientation indicated in e, top panel). (e) 32-bit gamma 0.2 corrected amplitude Fourier spectrum of unclipped reconstructed data from (a). (f) Output with a window function applied to remove edge artifacts visible as horizontal and vertical stripes in (e). Overlaid concentric rings denote the respective spatial resolution (in μm). Note the distinct “flower” pattern with a prominent drop-off of the corresponding radial profile. The inflection point at ~90 nm (blue arrows) provides an approximation of the channel-specific frequency support. (g) Output of the mode-thresholded data shown in (c). The less pronounced frequency drop-off reflects the frequency mix of features and noise in the remaining (positive) intensity range after clipping the lower (negative) half of background (noise) intensities. The inflection point of the radial profile levelling with the amplitude background at ~100 nm (red arrows), provides an approximation of the effective resolution limit of features in the reconstructed data (see also Supplementary Fig. S8). (h) Output with optional additional colour-coding (right) applied in lateral and orthogonal Fourier spectra.
Figure 4
Figure 4. SIMcheck output for SIM calibration data and utilities.
(ac) 3D SIM data of a field of 0.1 μm diameter red fluorescent beads. (a) Representative central images of the raw data stack with the corresponding orthogonal views for each angle, and the Raw Fourier Projection output (bottom central panel). (b) Output from the Raw SI to Pseudo-Widefield utility, with orthogonal view and inset showing the dataset at conventional resolution. (c) Corresponding output from the Threshold & 16-bit Conversion utility demonstrating the increase in resolution and efficient rejection of out-of-focus blur. (d) Illumination Pattern Focus calibration tool applied to a field of red fluorescent beads imaged with two different system calibration settings showing orthogonal projections along the direction of the stripes for each angle. Top panel: single layer appearance with only weak, symmetric side lobes indicate good alignment of the axial illumination modulation with the focal plane. Bottom panel: zipper-like appearance indicates defocussing of the z-modulation for all three angles. (e,f) Spherical Aberration Mismatch check applied to a reconstructed dataset from a green fluorescent bead layer acquired under optimal (e) and suboptimal (f) imaging conditions, respectively. The intensity plot and the orthogonal cross section in f show a prominent dip in intensity underneath the bead layer (red arrow; white arrowheads), indicating a mismatch between sample/system conditions and the OTF used for the reconstruction. The corresponding z-minimum variation (ZMV) value relative to the average feature intensity (double arrows) is about three fold higher. (g) Output of the Illumination Phase Step utility of a dataset acquired from a green bead layer. The left panel shows a representative 2D FFT with the central area with the highest amplitude blocked. Yellow rings indicate auto-detected pixel positions of the highest intensity spots, normally associated with the first order stripes of the illumination pattern. The right panel displays a plot of the phase values in radians at these spots for all phase positions within a defined z-range (in this example ±1 z-sections around plane of best focus).

References

    1. Hell S. W. Far-field optical nanoscopy. Science 316, 1153–1158 (2007). - PubMed
    1. Huang B., Babcock H. & Zhuang X. Breaking the Diffraction Barrier: Super-Resolution Imaging of Cells. Cell 143, 1047–1058 (2010). - PMC - PubMed
    1. Schermelleh L., Heintzmann R. & Leonhardt H. A guide to super-resolution fluorescence microscopy. J Cell Biol 190, 165–175 (2010). - PMC - PubMed
    1. Zhang J., Campbell R. E., Ting A. Y. & Tsien R. Y. Creating new fluorescent probes for cell biology. Nat Rev Mol Cell Biol 3, 906–918 (2002). - PubMed
    1. Heintzmann R. & Cremer C. Laterally modulated excitation microscopy: improvement of resolution by using a diffraction grating. in Proc SPIE (Bigio, I. J. et al.) 3568, 185–196 (SPIE, 1999).

Publication types

MeSH terms