. 2015 Dec 1;22(6):983-96.
doi: 10.1016/j.cmet.2015.09.028. Epub 2015 Oct 29.

Microbiota-Dependent Hepatic Lipogenesis Mediated by Stearoyl CoA Desaturase 1 (SCD1) Promotes Metabolic Syndrome in TLR5-Deficient Mice

Affiliations

Microbiota-Dependent Hepatic Lipogenesis Mediated by Stearoyl CoA Desaturase 1 (SCD1) Promotes Metabolic Syndrome in TLR5-Deficient Mice

Vishal Singh et al. Cell Metab. .

Abstract

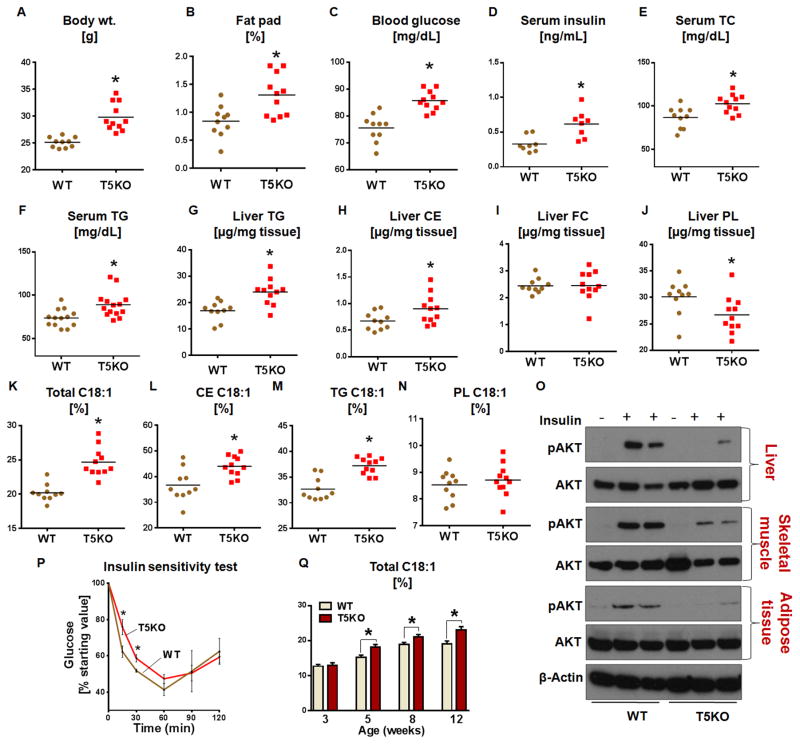
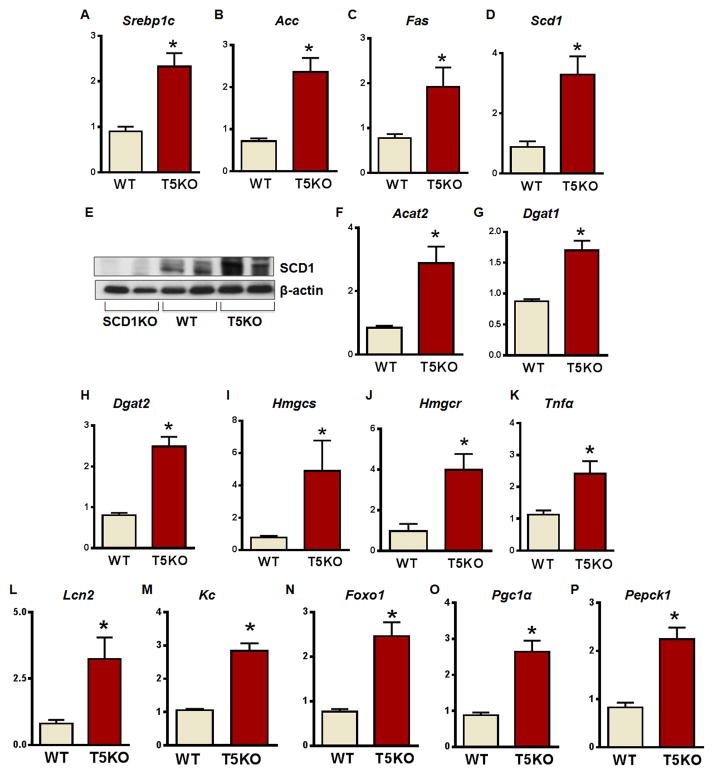
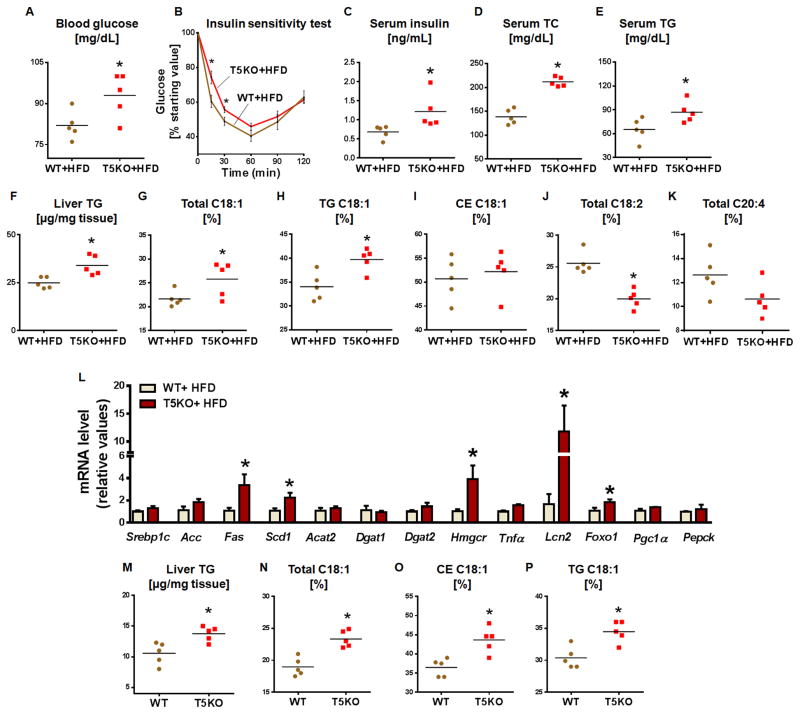
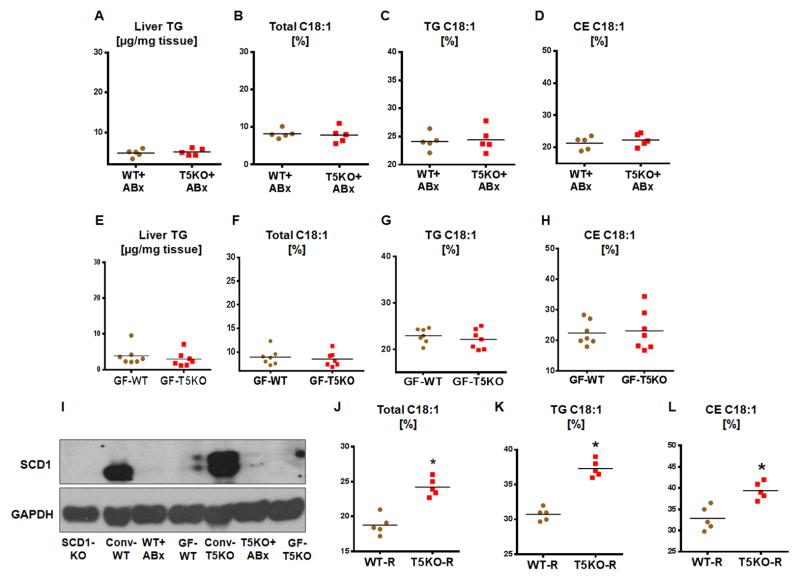
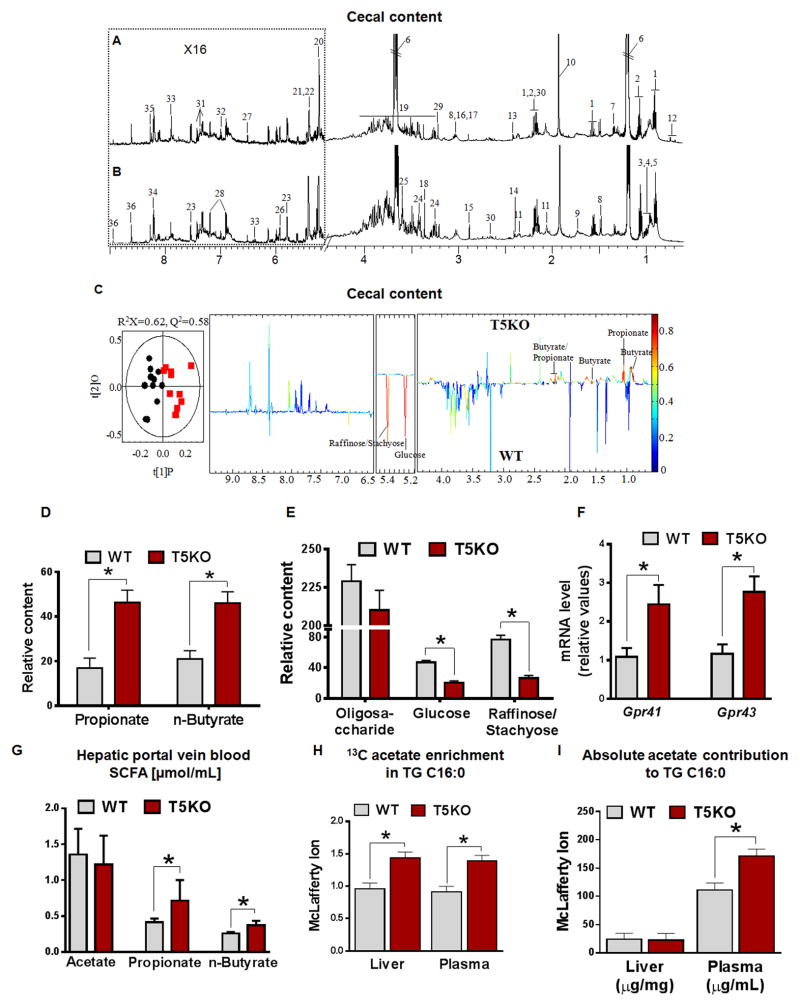
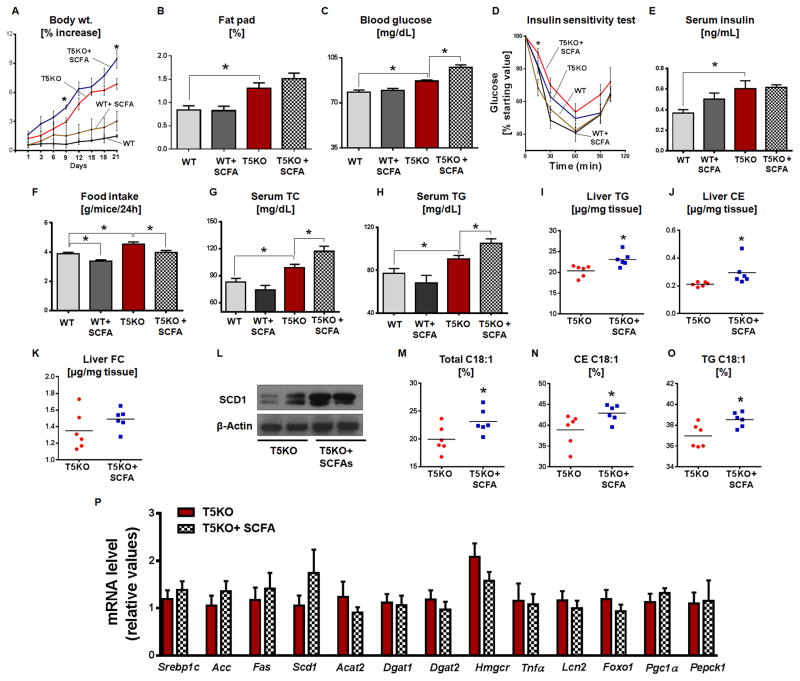
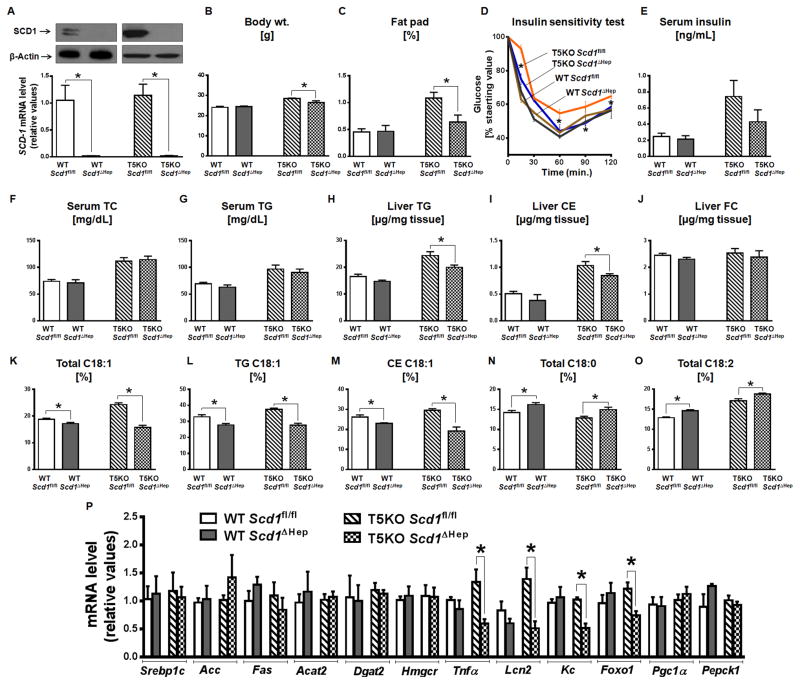
The gut microbiota plays a key role in host metabolism. Toll-like receptor 5 (TLR5), a flagellin receptor, is required for gut microbiota homeostasis. Accordingly, TLR5-deficient (T5KO) mice are prone to develop microbiota-dependent metabolic syndrome. Here we observed that T5KO mice display elevated neutral lipids with a compositional increase of oleate [C18:1 (n9)] relative to wild-type littermates. Increased oleate contribution to hepatic lipids and liver SCD1 expression were both microbiota dependent. Analysis of short-chain fatty acids (SCFAs) and (13)C-acetate label incorporation revealed elevated SCFA in ceca and hepatic portal blood and increased liver de novo lipogenesis in T5KO mice. Dietary SCFAs further aggravated metabolic syndrome in T5KO mice. Deletion of hepatic SCD1 not only prevented hepatic neutral lipid oleate enrichment but also ameliorated metabolic syndrome in T5KO mice. Collectively, these results underscore the key role of the gut microbiota-liver axis in the pathogenesis of metabolic diseases.

Keywords: Toll-like receptor 5; gut bacteria; hepatic neutral lipids; low-grade inflammation; metabolic diseases; monounsaturated fatty acids; short-chain fatty acids.


Conflict of interest statement

The authors have no conflict of interest.

Figures

Figure 1
Figure 1. Elevated oleate (C18:1)-enriched hepatic neutral lipids and insulin resistance in T5KO mice
Age-matched T5KO male mice and their WT littermates (20-week-old, n=10–11) were monitored for A. Body weight, B. Fat pad, C. 15 h fasting blood glucose, D. Fasting serum insulin, E. Serum total cholesterol (TC) and F. Serum triglycerides (TG). Hepatic lipids were analyzed after 5 h of fasting. G. TG, H. Cholesterol esters (CE), I. Free cholesterol (FC) and J. Phospholipids (PL). Fatty acid composition of hepatic lipid fractions were analyzed by gas chromatography and represented as (%) C18:1 K. C18:1 in total lipid, L. C18:1 in CE, M. C18:1 in TG and N. C18:1 in PL. O. Immunoblot representing insulin-induced phosphorylation of Akt (Thr308) and total Akt in liver, soleus skeletal muscle and adipose tissue. P. Insulin sensitivity, Q. Liver total lipid oleate (%) levels were quantified in male T5KO and their WT littermates (n=6) at different age 3, 5, 8 and 12 weeks. Data are represented as mean ± SEM. *P<0.05.
Figure 2
Figure 2. Enhanced expression of hepatic lipogenic enzymes, pro-inflammatory, and insulin resistance genes in T5KO mice
Hepatic expression of lipogenic enzymes, inflammatory, and insulin resistance marker genes were analyzed in male T5KO mice and their WT littermates (20-week-old, n=5). A. Sterol regulatory element binding protein 1c (Srebp1c), B. Acetyl CoA carboxylase (Acc), C. Fatty acid synthase (Fas), D. Stearoyl-CoA desaturase-1 (Scd1), E. Immunoblot for SCD1, F. Acyl CoA:cholesterol acyltransferase 2 (Acat2), G. Diacylglycerol acyltransferase 1 (Dgat1), H. Dgat2, I. 3-hydroxy-3-methyl-glutaryl-CoA synthase (Hmgcs) J. HMG- CoA reductase (Hmgcr). K. Tumor necrosis factor alpha (Tnfα), L. Lipocalin2 (Lcn2), M. Keratinocyte-derived chemokine (Kc), N. Forkhead box protein O1 (Foxo1), O. Peroxisome proliferator-activated receptor-gamma coactivator-1 alpha (Pgc-1α), and P. Phosphoenolpyruvate carboxykinase (Pepck). Data are represented as mean ± SEM. *P<0.05.
Figure 3
Figure 3. HFD-fed and calorie restricted T5KO mice exhibit elevated oleic acid in hepatic neutral lipids
Age matched female T5KO mice and their WT littermates (12-week-old, n=5) maintained on a HFD for 8 weeks and 5 h fasting serum and liver were analyzed for following parameters. A. Blood glucose, B. Insulin sensitivity test, C. Fasting serum insulin, D. Serum TC and E. Serum TG. F. Liver TG, G. C18:1 in total lipid, H. C18:1in TG, I. C18:1 in CE, J. Total C18:2, and K. Total C20:4. L. mRNA expression of hepatic lipogenic, inflammatory, and insulin resistance genes in HFD fed WT and T5KO mice. Age-matched female T5KO mice and their WT littermates (n=5) were subjected to calorie restriction for 12 weeks and hepatic TG and C18:1 were analyzed after 5 h of fasting. M. Liver TG, N. C18:1 in total lipid, O. C18:1 in CE and P. C18:1 in TG. Data are represented as mean ± SEM. *P<0.05.
Figure 4
Figure 4. Hepatic neutral lipid enrichment of C18:1 in T5KO mice is microbiota dependent
Age matched male T5KO mice and their WT littermates (4-week-old, n=5) were treated with broad-spectrum antibiotics (ampicillin and neomycin) in drinking water for 8 weeks and analyzed for liver lipids. A. Liver TG, B. C18:1 in total lipid, C. C18:1 in TG, D. C18:1 in CE. Hepatic lipids were analyzed in 12-week-old males (age and sex matched) GF-T5KO mice and their WT littermates (n=7). E. Liver TG, F. C18:1 in total lipid, G. C18:1 in TG, H. C18:1 in CE and, I. Immunoblot for hepatic SCD1 in conventional (conv), antibiotics treated and GF-T5KO mice and their WT littermates. Four-week-old male GF (Swiss Webster) WT mice (n=5) were orally administered cecal microbiota from either WT or T5KO mice and housed in specific pathogen–free conditions. Hepatic C18:1 in lipid fractions was analyzed 6 weeks after transplantation. J. C18:1 in total lipid, K. C18:1 in TG, and L. C18:1 in CE. Data are represented as mean ± SEM. *P<0.05.
Figure 5
Figure 5. Metabolic profiles of cecal contents are altered in T5KO mice
Typical 600 MHz 1H NMR spectra of cecal contents from male A. T5KO, and B. WT mice (20-week-old, n=10–11). C. OPLS-DA score plot (left) and correlation coefficient loading plot (right) showing the discrimination between 1H NMR spectra of cecal contents from T5KO and WT mice, respectively (|r| cutoff value is 0.602, n=10 for WT group and n=11 T5KO mice group; C. R2X=0.56, Q2=0.58; CV-ANOVA: P = 1.89 × 10⁻³). Keys: 1, n-butyrate; 2, propionate; 3, isoleucine; 4, leucine; 5, valine; 6, ethanol; 7, lactate; 8, alanine; 9, lysine; 10, acetate; 11, proline; 12, bile acids; 13, succinate; 14, pyruvate; 15, trimethylamine (TMA); 16, creatine; 17, α-ketoglutarate; 18, methanol; 19, oligosaccharides & amino acids; 20, α-glucose; 21, raffinose; 22, stachyose; 23, uracil; 24, taurine; 25, glycine; 26, uridine; 27, fumarate; 28, tyrosine; 29, choline; 30, methionine; 31, phenylalanine; 32, histidine; 33, urocanate; 34, adenine; 35, adenosine; 36, nicotinurate. Relative abundance of D. SCFA (propionate & butyrate) & E. oligosaccharides, glucose, raffinose and stachyose in cecal content extracts from WT and T5KO mice. F. Colonic expression of SCFA receptor in T5KO and their WT littermates (n=10). G. SCFA concentration in hepatic portal vein serum (n=6–8). H–I) 13C-acetate label in animals fed 13C-sodium acetate (0.3 M) in drinking water for 4 days (n=5), H). Fractional enrichment of C16:0 using C16:0 as the primary end product of DNL and the fractional enrichment as an estimate of fractional synthesis; I. Absolute concentration of C16:0 in liver and plasma TG. Data are represented as mean ± SEM. *P<0.05.
Figure 6
Figure 6. Dietary SCFA aggravates metabolic syndrome in T5KO mice
Age matched male T5KO mice and their WT littermates (16-week-old, n=6) received either a mixture of SCFA (67.5mM sodium acetate, 40mM sodium butyrate and 25.9mM sodium propionate) or equimolar sodium chloride in drinking water for 21 days. A. Percent increase in body weight, B. Fat pad, C. 15 h fasting blood glucose, D. Insulin sensitivity test, E. 5 h fasting serum insulin, F. Food intake, G. Serum TC, H. Serum TG. Hepatic lipids were analyzed in 5 h fasted mice. I. TG, J. CE, K. FC, L. Immunoblot represents hepatic SCD1, M. C18:1 in total lipid, N. C18:1 in CE, O. C18:1 in TG and P. mRNA expression of hepatic lipogenic, inflammatory and insulin resistance genes. Data are represented as mean ± SEM. *P<0.05.
Figure 7
Figure 7. Deletion of hepatic Scd1 in T5KO mice protects against metabolic syndrome
Liver Scd1 deficient WT (WT-Scd1ΔHep), T5KO (T5KO-Scd1ΔHep) and control (WT-Scd1fl/fl & T5KO-Scd1fl/fl) mice (male, n=4–6) were maintained on lab chow for 20 weeks A. Immunoblot (upper panel) and bar graph representing the hepatic expression of SCD1 at protein and mRNA level respectively, B. Body weight, C. Percent fat pad D. Insulin sensitivity test, E. Fasting serum insulin, F. Serum TC and G. Serum TG. Hepatic lipids were analyzed in 5 h fasted mice. H. Liver TG, I. CE, J. FC, K. Total C18:1, L. TG C18:1, M. CE C18:1, N. Total C18:0, O. Total C18:2 and P. mRNA expression of hepatic lipogenic, inflammatory and insulin resistance genes. Data are represented as mean ± SEM. *P<0.05.

Comment in

Similar articles

Cited by

References

    1. Alberts AW, Ferguson K, Hennessy S, Vagelos PR. Regulation of lipid synthesis in cultured animal cells. J Biol Chem. 1974;249:5241–5249. - PubMed
    1. Arpaia N, Campbell C, Fan X, Dikiy S, van der Veeken J, deRoos P, Liu H, Cross JR, Pfeffer K, Coffer PJ, et al. Metabolites produced by commensal bacteria promote peripheral regulatory T-cell generation. Nature. 2013;504:451–455. - PMC - PubMed
    1. Biddinger SB, Hernandez-Ono A, Rask-Madsen C, Haas JT, Aleman JO, Suzuki R, Scapa EF, Agarwal C, Carey MC, Stephanopoulos G, et al. Hepatic insulin resistance is sufficient to produce dyslipidemia and susceptibility to atherosclerosis. Cell Metab. 2008;7:125–134. - PMC - PubMed
    1. Blottiere HM, Buecher B, Galmiche JP, Cherbut C. Molecular analysis of the effect of short-chain fatty acids on intestinal cell proliferation. Proc Nutr Soc. 2003;62:101–106. - PubMed
    1. Brown JM, Rudel LL. Stearoyl-coenzyme A desaturase 1 inhibition and the metabolic syndrome: considerations for future drug discovery. Curr Opin Lipidol. 2010;21:192–197. - PMC - PubMed

Publication types

MeSH terms