

Intraluminal measurement of papillary duct urine pH, in vivo: a pilot study in the swine kidney
- PMID: 26526044
- PMCID: PMC4853300
- DOI: 10.1007/s00240-015-0834-9
Intraluminal measurement of papillary duct urine pH, in vivo: a pilot study in the swine kidney
Erratum in
-
Erratum to: Intraluminal measurement of papillary duct urine pH, in vivo: a pilot study in the swine kidney.Urolithiasis. 2016 Jun;44(3):219. doi: 10.1007/s00240-016-0861-1. Urolithiasis. 2016. PMID: 26946035 Free PMC article. No abstract available.
Abstract
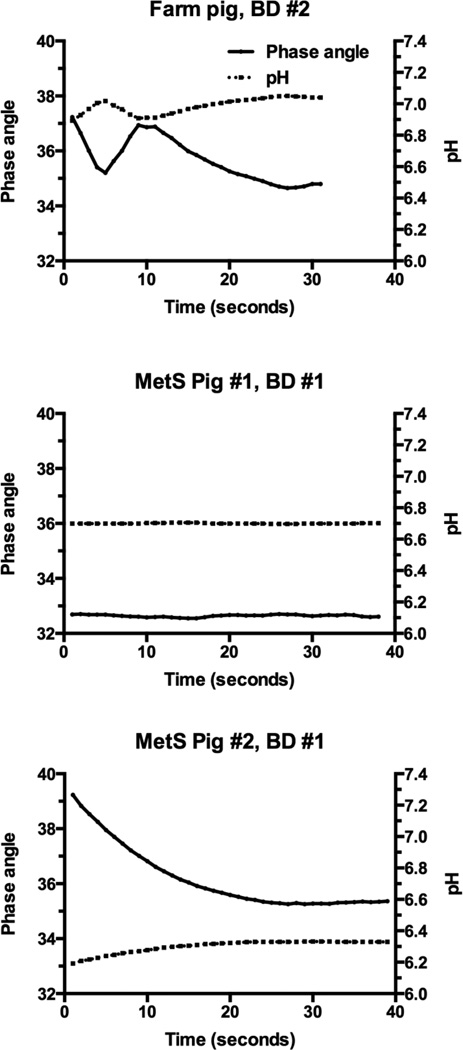
We describe the in vivo use of an optic-chemo microsensor to measure intraluminal papillary duct urine pH in a large mammal. Fiber-optic pH microsensors have a tip diameter of 140-µm that allows insertion into papillary Bellini ducts to measure tubule urine proton concentration. Anesthetized adult pigs underwent percutaneous nephrolithotomy to access the lower pole of the urinary collecting system. A flexible nephroscope was advanced towards an upper pole papilla with the fiber-optic microsensor contained within the working channel. The microsensor was then carefully inserted into Bellini ducts to measure tubule urine pH in real time. We successfully recorded tubule urine pH values in five papillary ducts from three pigs (1 farm pig and 2 metabolic syndrome Ossabaw pigs). Our results demonstrate that optical microsensor technology can be used to measure intraluminal urine pH in real time in a living large mammal. This opens the possibility for application of this optical pH sensing technology in nephrolithiasis.
Keywords: Fiber-optic chemical sensor; Hydrogen ion concentration; Kidney; Shock wave lithotripsy; Tubule.
Conflict of interest statement
Figures


Similar articles
-
In Vivo Renal Tubule pH in Stone-Forming Human Kidneys.J Endourol. 2020 Feb;34(2):203-208. doi: 10.1089/end.2019.0378. J Endourol. 2020. PMID: 31760802 Free PMC article.
-
Peristaltic flow of urine in the renal capillary collecting ducts of hamsters.Kidney Int. 1981 Jul;20(1):55-60. doi: 10.1038/ki.1981.104. Kidney Int. 1981. PMID: 7300113
-
Erratum to: Intraluminal measurement of papillary duct urine pH, in vivo: a pilot study in the swine kidney.Urolithiasis. 2016 Jun;44(3):219. doi: 10.1007/s00240-016-0861-1. Urolithiasis. 2016. PMID: 26946035 Free PMC article. No abstract available.
-
Kidney models of calcium oxalate stone formation.Nephron Physiol. 2004;98(2):p21-30. doi: 10.1159/000080260. Nephron Physiol. 2004. PMID: 15499211 Review.
-
Relationship between structure and function in distal tubule and collecting duct.J Electron Microsc Tech. 1988 Jun;9(2):187-208. doi: 10.1002/jemt.1060090206. J Electron Microsc Tech. 1988. PMID: 3058890 Review.
Cited by
-
Interplay between H1N1 influenza a virus infection, extracellular and intracellular respiratory tract pH, and host responses in a mouse model.PLoS One. 2021 May 12;16(5):e0251473. doi: 10.1371/journal.pone.0251473. eCollection 2021. PLoS One. 2021. PMID: 33979408 Free PMC article.
-
In Vivo Renal Tubule pH in Stone-Forming Human Kidneys.J Endourol. 2020 Feb;34(2):203-208. doi: 10.1089/end.2019.0378. J Endourol. 2020. PMID: 31760802 Free PMC article.
-
Early clinical indicators of acute kidney injury caused by administering high-dose methotrexate therapy to juvenile pigs.Front Nephrol. 2023 Sep 12;3:1193494. doi: 10.3389/fneph.2023.1193494. eCollection 2023. Front Nephrol. 2023. PMID: 37790293 Free PMC article.
-
Dimensions of muddy brown granular casts in patients with acute tubular injury.Am J Med Sci. 2024 Sep;368(3):196-202. doi: 10.1016/j.amjms.2024.06.012. Epub 2024 Jun 15. Am J Med Sci. 2024. PMID: 38885928 Free PMC article.
-
Ex-Vivo Measurement of the pH in Aqueous Humor Samples by a Tapered Fiber-Optic Sensor.Sensors (Basel). 2021 Jul 27;21(15):5075. doi: 10.3390/s21155075. Sensors (Basel). 2021. PMID: 34372310 Free PMC article.
References
-
- Wagner CA, Mohebbi N. Urinary pH and stone formation. J Nephrol. 2010;23(S16):S165–S169. - PubMed
-
- Sonnenberg H, Chong C. Comparison of micropunture of microcatheterization in papillary collecting duct. Am J Physiol. 1980;239:F95–F105. - PubMed
-
- Graber ML, Bengele HH, Schwartz JH, et al. pH and PCO2 profiles of the rat inner medullary collecting duct. Am J Physiol. 1981;241:F659–F668. (Renal Fluid Electrolyte Physiol 10) - PubMed
-
- DuBose TD, Jr, Lucci MS, Hogg RJ, et al. Comparison of acidification parameters in superficial and deep nephrons of the rat. Am J Physiol. 1983;244:F497–F503. (Renal Fluid Electrolyte Physiol 13) - PubMed
MeSH terms
Grants and funding
LinkOut - more resources
Full Text Sources
Other Literature Sources
Medical
