. 2016 Jan 1;409(1):202-217.
doi: 10.1016/j.ydbio.2015.10.023. Epub 2015 Oct 23.

PTEN is required to maintain luminal epithelial homeostasis and integrity in the adult mammary gland

Affiliations

PTEN is required to maintain luminal epithelial homeostasis and integrity in the adult mammary gland

Amy N Shore et al. Dev Biol. .

Abstract

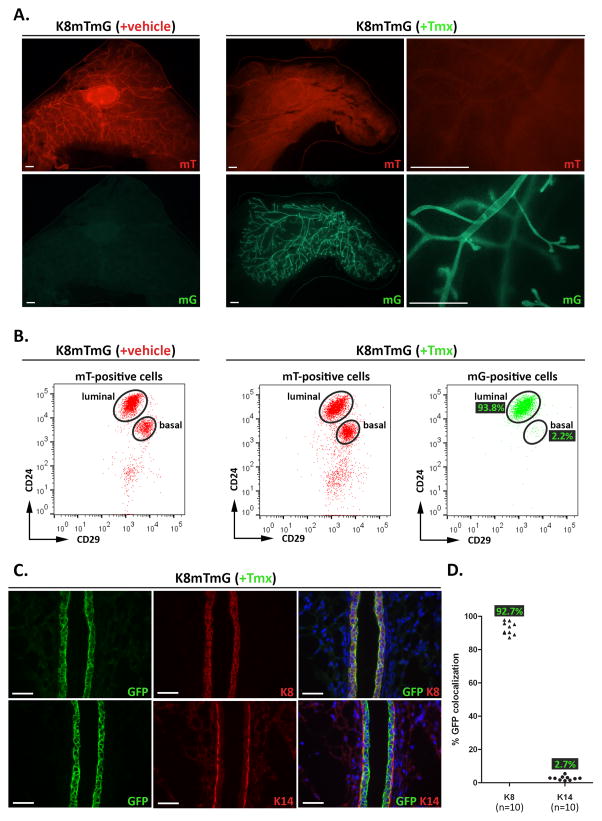
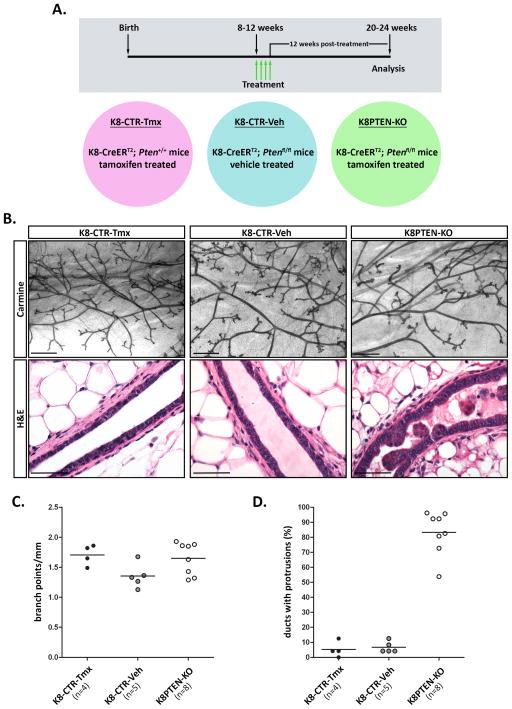
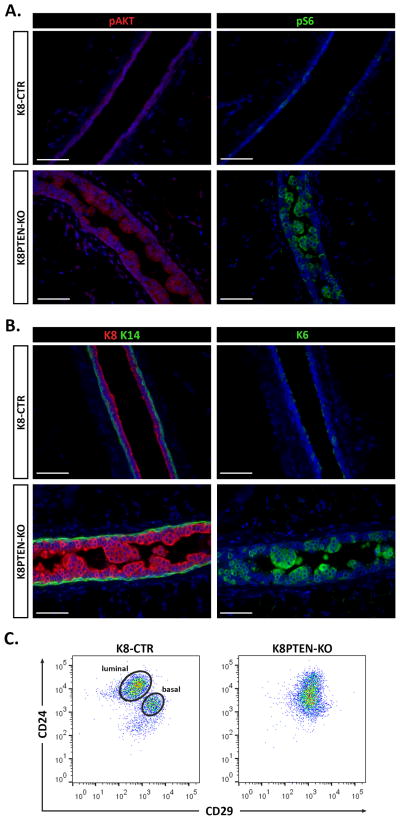
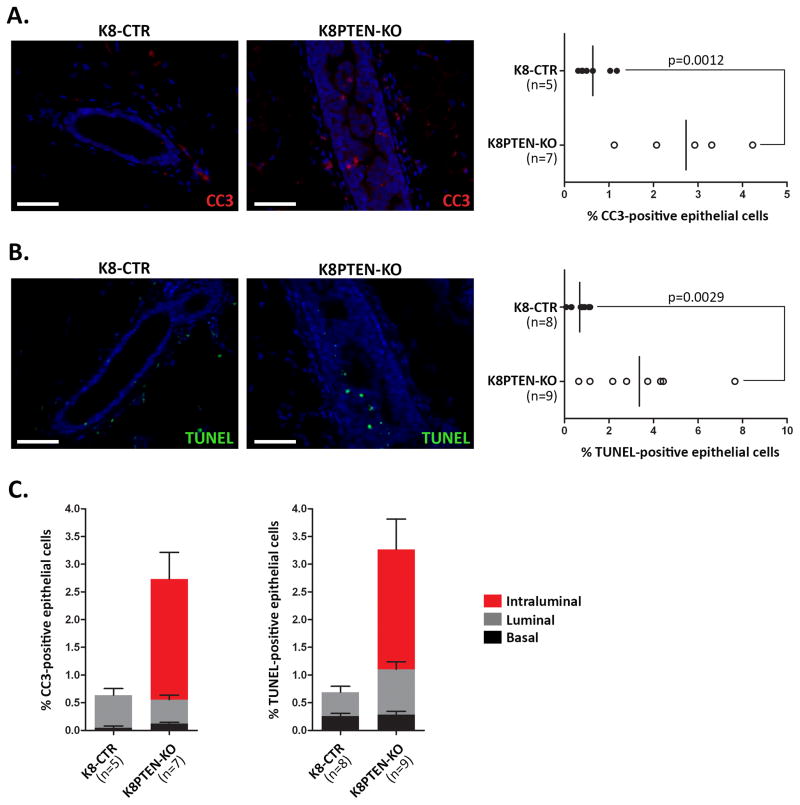
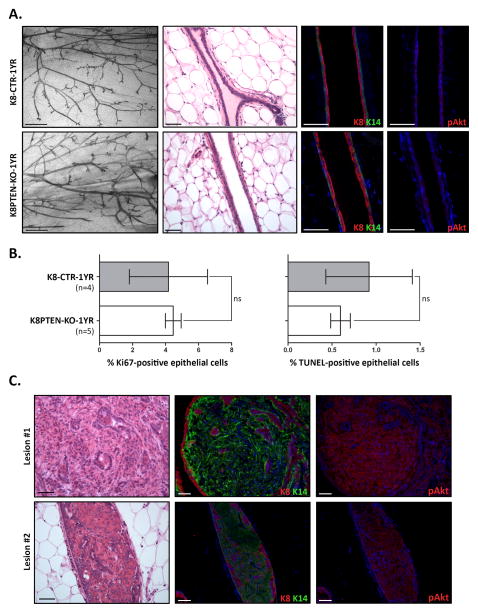
In the mammary gland, PTEN loss in luminal and basal epithelial cells results in differentiation defects and enhanced proliferation, leading to the formation of tumors with basal epithelial characteristics. In breast cancer, PTEN loss is associated with a hormone receptor-negative, basal-like subtype that is thought to originate in a luminal epithelial cell. Here, we show that luminal-specific PTEN loss results in distinct effects on epithelial homeostasis and mammary tumor formation. Luminal PTEN loss increased proliferation of hormone receptor-negative cells, thereby decreasing the percentage of hormone receptor-positive cells. Moreover, luminal PTEN loss led to misoriented cell divisions and mislocalization of cells to the intraluminal space of mammary ducts. Despite their elevated levels of activated AKT, Pten-null intraluminal cells showed increased levels of apoptosis. One year after Pten deletion, the ducts had cleared and no palpable mammary tumors were detected. These data establish PTEN as a critical regulator of luminal epithelial homeostasis and integrity in the adult mammary gland, and further show that luminal PTEN loss alone is not sufficient to promote the progression of mammary tumorigenesis.

Keywords: Epithelial; Homeostasis; Mammary; PTEN.


Figures

Figure 1
Figure 1. K8mTmG mice exhibit robust and specific Cre recombinase activity in the luminal mammary epithelium
(A–C) K8mTmG mice were treated with vehicle (+vehicle) or Tmx (+Tmx). One week later, mammary glands were harvested for analysis. (A) Representative fluorescent mammary gland whole mount images detecting endogenous mT and mG expression are shown for each treatment group. In vehicle-treated K8mTmG mice, mT was expressed throughout the mammary epithelium, whereas no mG expression was detected. In Tmx-treated K8mTmG mice, high levels of mG, and low levels of mT, expression were observed throughout the mammary epithelium. Scale bars: 1 mm. (B) MECs were isolated from vehicle-treated (n=3) and Tmx-treated (n=9) mice, and the mT- and mG-positive populations were each analyzed by FACS using CD24 and CD29 fluorescent-conjugated antibodies to separate the epithelial cells into luminal (CD24hiCD29lo) and basal (CD24loCD29hi) cell subpopulations. FACS dot plots show the mT-positive cells from vehicle- and Tmx-treated mice are comprised of luminal and basal cells, whereas the mG-positive cells from Tmx-treated mice are mostly luminal cells. The percentages of mG-positive cells within each subpopulation are indicated on the FACS plot. (C) Mammary gland sections from Tmx-treated mice (n=5) were co-stained by IF using antibodies to GFP and K8 (top three panels) or K14 (bottom three panels). Scale bars: 40 μm. A scatter plot graph shows the quantification of K8 and GFP, and K14 and GFP, co-localization, with each point representing the average from a single mammary gland. The n represents the number of glands. Quantification was performed on two glands from each mouse. The average GFP percentages in each group are indicated on the graph.
Figure 2
Figure 2. Luminal PTEN loss disrupts lumen maintenance and epithelial architecture within the mammary ducts
A–D) K8-CreERT2; Ptenfl/fl and K8-CreERT2; Pten+/+ mice were treated with vehicle or Tmx at 8 to 12 weeks of age to generate control (K8-CTR-Veh or K8-CTR-Tmx) or luminal epithelial Pten-null (K8PTEN-KO) groups, and the mammary glands were harvested 12 weeks later. (A) A timeline (gray box) illustrates the time of treatment (green arrows), for four consecutive days, and the time of analysis. The individual treatment groups (colored circles) are indicated below the timeline. (B) Representative images of carmine-stained mammary gland whole mounts illustrate similar ductal morphology between the treatment groups. Scale bars: 1 mm. Representative images of H&E stained mammary sections are shown. The control ducts exhibited single-layered epithelial compartments surrounding epithelial-free lumens, whereas the K8PTEN-KO ducts had epithelial cells protruding into the lumens. Scale bars: 50 μm. (C) A scatter plot graph shows that there were no significant differences in branching morphogenesis between the treatment groups. Each dot represents branching quantification from one gland from one mouse. The n represents the number of mice. (D) A scatter plot graph shows that more than 80% of the ducts from K8PTEN-KO mice contained protrusions, or intraluminal clusters, which was significantly higher than the amount of ductal protrusions observed in controls (p<0.0001). Each dot represents quantification of ductal protrusions from one gland from one mouse. The n represents the number of mice.
Figure 3
Figure 3. Luminal PTEN loss alters mammary epithelial differentiation
(A–C) K8-CreERT2; Ptenfl/fl and K8-CreERT2; Pten+/+ mice were treated with vehicle or Tmx at 8 to 12 weeks of age to generate controls (K8-CTR) or luminal epithelial Pten-null (K8PTEN-KO) groups, and the mammary glands were harvested 12 weeks later. (A) Representative IF images show high levels of the mTOR targets pAKT and pS6 in the K8PTEN-KO ducts, which are not apparent in the K8-CTR control ducts. Scale bars: 50 μm. (B) Representative images of IF to detect keratins 8 and 14 (K8 and K14) are shown. The K8-CTR ducts showed a single layer of luminal cells (K8-positive) surrounded by a single layer of basal cells (K14-positive), whereas the K8PTEN-KO ducts exhibited an accumulation of K8-positive cells in the lumen. Scale bars: 50 μm. (C) Representative FACS dot plots depict the CD24/CD29 profiles of MECs isolated from either K8-CTR (n=5) or K8PTEN-KO (n=8) mice. The MECs from K8-CTR mice sorted into the expected luminal and basal subpopulations, whereas the MECs from K8PTEN-KO mice appeared as a single population that lacked distinct subpopulations. All K8-CTR images and FACS profiles shown in this figure are from K8-CTR-Veh mice.
Figure 4
Figure 4. Luminal PTEN loss enhances proliferation, and disrupts progesterone receptor expression and patterning in the luminal epithelium
(A) IF was performed on mammary sections from K8-CTR and K8PTEN-KO mice to detect the mitotic marker pH3 and the cell cycle marker Ki67. Scatter dot plots illustrate the 2.4- and 3.6-fold increases in mitotic and actively cycling cells, respectively, in the K8PTEN-KO ducts compared with the K8-CTR ducts. The n represents the number of mice. (B) Representative IF images on serial mammary sections illustrate the non-overlapping, distinct localization patterns of PR and Ki67 in the K8PTEN-KO ducts. Scale bars: 50 μm. (C) Representative IF images depict uniform expression of PR in the luminal epithelium of the K8-CTR ducts, whereas PR was expressed in the epithelial cells protruding into the lumen of the K8PTEN-KO ducts. Quantification of the number of PR-positive cells divided by the total number of luminal epithelial cells demonstrated a reduced percentage of PR-positive cells in the K8PTEN-KO ducts compared with the control, which is depicted in the box plot graph. The n represents the number of mice. Scale bars: 50 μm. (D) Quantification of PR localization showed an even greater reduction in the percentage of PR-expressing luminal cells that were directly contacting the basal epithelium in the K8PTEN-KO ducts compared with the K8-CTR ducts. Almost 50% of the intraluminal epithelial cells, those not directly contacting the basal epithelium, in the K8PTEN-KO ducts expressed PR. The n represents the number of mice. (E) Quantification revealed a 2-fold increase in the total number of luminal epithelial cells, which was accompanied by a 1.2-fold increase in the total number of PR-positive cells, in the K8PTEN-KO ducts compared with the K8-CTR ducts. The n represents the number of random 40× images from which the epithelial cells were counted from seven K8-CTR and five K8PTEN-KO mice. All K8-CTR images shown in this figure are from K8-CTR-Veh mice.
Figure 5
Figure 5. Luminal PTEN loss results in misoriented mitotic spindles, without altering cell-cell adhesion or apical polarity
(A–C) IF staining was performed to detect cells in anaphase (pH3) or telophase (Ki67) combined with K8 or K14 to distinguish luminal and basal cells, respectively. (A) Mitotic spindle angles were measured by drawing a line through the centers of the condensed chromatin of the daughter nuclei of cells in anaphase or telophase and defining it as the spindle axis. The spindle angle was measured at the intersection between the spindle axis and a line drawn parallel to the basement membrane. (B) Quantification of the spindle angles demonstrated that luminal PTEN loss did not alter the mitotic spindle orientation of dividing basal epithelial cells, and the majority of the divisions occurred parallel to the basement membrane (spindle angle < 15º). In the luminal epithelium, the K8PTEN-KO ducts showed a 4-fold increase in mitotic spindle angles compared with the K8-CTR ducts. The n indicates individual mitotic events. (C) The quantification of mitotic spindle angles was further analyzed to determine differences between single- and multi-layered luminal epithelium in the K8PTEN-KO ducts. Representative low and high magnification images show mitotic Ki67-positive luminal cells from K8-CTR (left image with green inset), single-layered K8PTEN-KO (center image with pink inset), and multi-layered K8PTEN-KO (right image with blue inset) ducts. Scale bars: 50 μm (low magnification images) and 10 μm (high magnification images). Below each set of images is their corresponding spindle angles plotted as percentages in 15º increments. In the K8-CTR ducts, 81.3% of the luminal cells showed parallel divisions, whereas in the single- and multi-layered K8PTEN-KO ducts only 47.1% and 12.7%, respectively, showed parallel divisions. The n indicates mitotic events, and the mean spindle angles are shown below each angle plot. (D) Representative confocal IF images depict similar staining patterns of the cell-cell adhesion marker E-cad, and the apical polarity marker aPKC, between K8-CTR and K8PTEN-KO ducts. Scale bars: 50 μm. All K8-CTR images shown in this figure are from K8-CTR-Veh mice.
Figure 6
Figure 6. Intraluminal cells in K8PTEN-KO ducts show enhanced apoptosis
(A–C) To determine the levels of apoptosis, IF staining was performed to detect the apoptotic marker CC3 combined with K8, or TUNEL assays were performed. Representative IF images of CC3 (A) and TUNEL (B) show increased levels of apoptosis in the K8PTEN-KO ducts. Quantification demonstrated 4.3- and 4.9-fold increases in CC3 and TUNEL levels, respectively, in the K8PTEN-KO ducts compared with K8-CTR ducts. The n represents the number of mice. Scale bars: 50 μm. (C) Quantification of localization of the apoptotic cells within the ducts demonstrated that most of the increased apoptosis occurred in the intraluminal cells of the K8PTEN-KO ducts. The n represents the number of mice. All K8-CTR images shown in this figure are from K8-CTR-Veh mice.
Figure 7
Figure 7. One year post-Tmx treatment, K8PTEN-KO-1YR ducts are similar to K8-CTR-1YR ducts and show little evidence of PTEN loss
To determine long-term effects of PTEN luminal loss, K8-CreERT2; Ptenfl/fl were treated with vehicle (K8-CTR-1YR) or Tmx (K8PTEN-KO-1YR) at 10 to 12 weeks of age and mammary glands were harvested 1 year later. (A) Representative images show similar whole mount morphology (Carmine) and ductal histology (H&E) between the two treatment groups. Scale bars: 1 mm (whole mounts) and 50 μm (H&E). Representative IF images illustrate the single-layered luminal (K8) and basal (K14) epithelial compartments in K8-CTR-1YR and K8PTEN-KO-1YR ducts. IF staining also demonstrated similar levels of pAKT between the two treatment groups. Scale bars: 50 μm. (B) Bar graphs depict similar levels of proliferation (Ki67) and apoptosis (TUNEL) between the K8PTEN-KO-1YR and control ducts. The n represents the number of mice. (C) At 1 year post-Tmx treatment, four out of five K8PTEN-KO-1YR mice had glands with single mammary lesions, whereas no lesions were detected in the glands of control mice. IF staining showed that the lesions were mostly K14 positive, and that the K14-positive cells had high levels of pAKT. Scale bars: 50 μm.

References

    1. Bell GP, Fletcher GC, Brain R, Thompson BJ. Aurora kinases phosphorylate Lgl to induce mitotic spindle orientation in Drosophila epithelia. Curr Biol. 2015;25:61–68. - PMC - PubMed
    1. Berglund FM, Weerasinghe NR, Davidson L, Lim JC, Eickholt BJ, Leslie NR. Disruption of epithelial architecture caused by loss of PTEN or by oncogenic mutant p110alpha/PIK3CA but not by HER2 or mutant AKT1. Oncogene. 2013;32:4417–4426. - PMC - PubMed
    1. Bergstralh DT, Haack T, St Johnston D. Epithelial polarity and spindle orientation: intersecting pathways. Philos Trans R Soc Lond B Biol Sci. 2013a;368:20130291. - PMC - PubMed
    1. Bergstralh DT, Lovegrove HE, St Johnston D. Discs large links spindle orientation to apical-basal polarity in Drosophila epithelia. Curr Biol. 2013b;23:1707–1712. - PMC - PubMed
    1. Brisken C, O’Malley B. Hormone action in the mammary gland. Cold Spring Harb Perspect Biol. 2010;2:a003178. - PMC - PubMed

Publication types

MeSH terms