Comparative Study
. 2015 Nov 2:13:62.
doi: 10.1186/s12961-015-0050-7.

An analysis of discrepancies between United Kingdom cancer research funding and societal burden and a comparison to previous and United States values

Affiliations
Comparative Study

An analysis of discrepancies between United Kingdom cancer research funding and societal burden and a comparison to previous and United States values

Ashley J R Carter et al. Health Res Policy Syst. .

Abstract

Background: Ideally, the allocation of research funding for each specific type of cancer should be proportional to its societal burden. This burden can be estimated with the metric 'years of life lost' (YLL), which combines overall mortality and age at death.

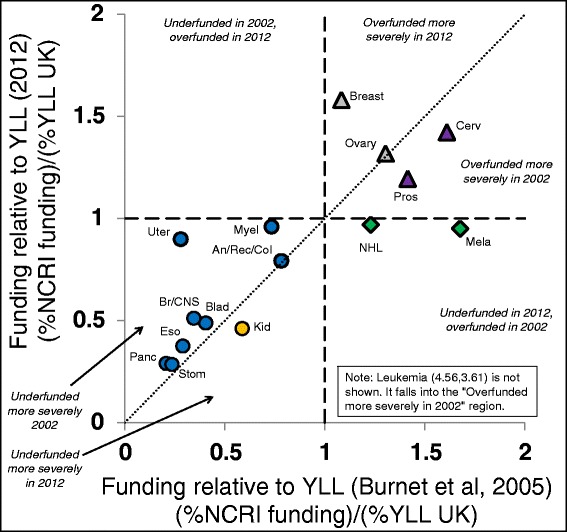
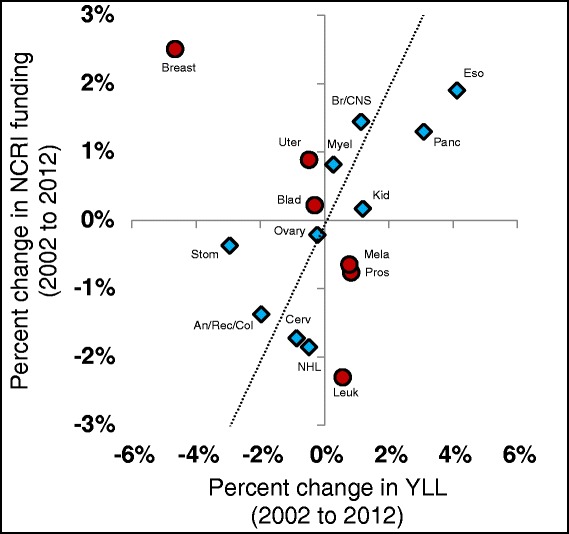
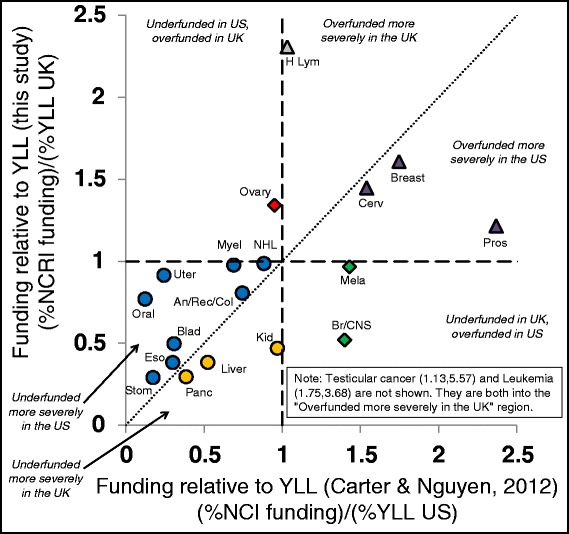
Methods: Using United Kingdom data from 2010, we compared research funding from the National Cancer Research Institute to this YLL burden metric for 26 types of cancers in order to identify the discrepancies between cancer research funding allocation and societal burden. We also compared these values to United States data from 2010 and United Kingdom data published in 2005.

Results: Our study revealed a number of discrepancies between cancer research funding and burden. Some cancers are funded at levels far higher than their relative burden suggests (testicular, leukaemia, Hodgkin's lymphoma, breast, cervical, ovarian, prostate) while other cancers appear under-funded (gallbladder, lung, nasopharyngeal, intestine, stomach, pancreatic, thyroid, oesophageal, liver, kidney, bladder, and brain/central nervous system). United Kingdom funding patterns over the past decade have generally moved to increase funding to previously under-funded cancers with one notable exception showing a converse trend (breast cancer). The broad relationship between United Kingdom and United States funding patterns is similar with a few exceptions (e.g. leukaemia, Hodgkin's lymphoma, prostate, testicular cancer).

Conclusions: There are discrepancies between cancer research funding allocation and societal burden in the United Kingdom. These discrepancies are broadly similar in both the United Kingdom and the United States and, while they appear to be improving, this is not consistent across all types of cancer.


Figures

Figure 1
Figure 1
Funding versus years of life lost (YLL) over time in the United Kingdom. Presents the research funding to YLL ratios for the United Kingdom data in Table 2 on the Y-axis compared to 2002 data [3] on the X-axis. The dashed vertical and horizontal lines indicate points at which proportional funding is equal to proportional YLL. The dotted diagonal line indicates identical discrepancies during both time periods. Italicized labels are used to describe six zones within the figure that represent different combinations of patterns of discrepancy. Combinations of symbol shape and colour/shading indicate cancer types with similar types of funding discrepancies. Cancer types which are above the diagonal line to the left of the vertical dashed line indicate those that were previously underfunded receiving increased funding and cancer types below the diagonal line to the right of the vertical dashed line indicate those that were previously overfunded receiving reduced funding. Not all 26 cancer types are represented due to less comprehensive data for the older United Kingdom data set.
Figure 2
Figure 2
Funding and years of life lost (YLL) changes over time in the United Kingdom. Presents a comparison of the percentage differences in research funding (Y-axis) and YLL (X-axis) for the United Kingdom between this study and the values reported for 2002 [3]. Data points to the right of the vertical axis indicate cancers increasing in relative societal burden (and vice versa) while data points above the horizontal axis represent cancers receiving increased funding (and vice versa). Combinations of symbol shape and colour/shading indicate cancer types with concordant or discordant changes in funding and YLL. These values are relative YLL and funding so any increases in the relative YLL for a specific cancer type would not mean increases in absolute YLL, rather that the relative severity is increasing, most likely due to better improvements for other types of cancer. Not all 26 cancer types are represented due to less comprehensive data for the older United Kingdom data set.
Figure 3
Figure 3
Years of life lost (YLL) values in the United Kingdom versus the United States. Presents the YLL burden values for the United Kingdom on the Y-axis compared to a recent report of the same cancer types for the United States [10]. Both data analysis are based on 2010 values. The dotted diagonal line indicates equal proportional YLL values in the two countries and residuals from this line indicate types of cancer for which the societal burdens differ. Not all 26 cancer types are represented due to less comprehensive data for the United States data set.
Figure 4
Figure 4
Funding versus years of life lost (YLL) in the United Kingdom versus the United States. Presents the research funding to YLL ratios for the United Kingdom data in Table 3 on the Y-axis compared to a recent report of the same cancer types for the United States [10] on the X-axis. Both data analyses are based on 2010 values. The dashed vertical and horizontal lines indicate points at which proportional funding is equal to proportional YLL. The dotted diagonal line indicates identical discrepancies in both countries. Italicized labels are used to describe six zones within the figure that represent different combinations of funding discrepancies. There is a generally similar pattern of ratios although testicular cancer and leukaemia represent outliers in which they are overfunded in both countries, but to a much higher degree in the United Kingdom than in the United States.

References

    1. Ferlay J, Soerjomataram I, Ervik M, Dikshit R, Eser S, Mathers C, et al. GLOBOCAN 2012 v1.0, Cancer incidence and mortality worldwide: IARC CancerBase No. 11. Lyon: International Agency for Research on Cancer; 2013. http://globocan.iarc.fr. Accessed 14 April 2014.
    1. Gross CP, Anderson GF, Powe NR. The relation between funding by the National Institutes of Health and the burden of disease. N Engl J Med. 1999;340(24):1881–7. doi: 10.1056/NEJM199906173402406. - DOI - PubMed
    1. Burnet NG, Jefferies SJ, Benson RJ, Hunt DP, Treasure FP. Years of life lost (YLL) from cancer is an important measure of population burden - and should be considered when allocating research funds. Br J Cancer. 2005;92(2):241–55. - PMC - PubMed
    1. Branton PE. Does Canadian research investment relate to cancer burden? Lancet Oncol. 2008;9(2):82–3. doi: 10.1016/S1470-2045(08)70007-X. - DOI - PubMed
    1. Mitchell RJ, McClure RJ, Olivier J, Watson WL. Rational allocation of Australia’s research dollars: does the distribution of NHMRC funding by National Health Priority Area reflect actual disease burden? Med J Aust. 2009;191(11–12):648–52. - PubMed

Publication types

Supplementary concepts