. 2016 Jan 1;291(1):11-27.
doi: 10.1074/jbc.M115.684928. Epub 2015 Nov 2.

Structural Basis of Ribosomal S6 Kinase 1 (RSK1) Inhibition by S100B Protein: MODULATION OF THE EXTRACELLULAR SIGNAL-REGULATED KINASE (ERK) SIGNALING CASCADE IN A CALCIUM-DEPENDENT WAY

Affiliations

Structural Basis of Ribosomal S6 Kinase 1 (RSK1) Inhibition by S100B Protein: MODULATION OF THE EXTRACELLULAR SIGNAL-REGULATED KINASE (ERK) SIGNALING CASCADE IN A CALCIUM-DEPENDENT WAY

Gergő Gógl et al. J Biol Chem. .

Abstract

Mitogen-activated protein kinases (MAPK) promote MAPK-activated protein kinase activation. In the MAPK pathway responsible for cell growth, ERK2 initiates the first phosphorylation event on RSK1, which is inhibited by Ca(2+)-binding S100 proteins in malignant melanomas. Here, we present a detailed in vitro biochemical and structural characterization of the S100B-RSK1 interaction. The Ca(2+)-dependent binding of S100B to the calcium/calmodulin-dependent protein kinase (CaMK)-type domain of RSK1 is reminiscent of the better known binding of calmodulin to CaMKII. Although S100B-RSK1 and the calmodulin-CAMKII system are clearly distinct functionally, they demonstrate how unrelated intracellular Ca(2+)-binding proteins could influence the activity of the CaMK domain-containing protein kinases. Our crystallographic, small angle x-ray scattering, and NMR analysis revealed that S100B forms a "fuzzy" complex with RSK1 peptide ligands. Based on fast-kinetics experiments, we conclude that the binding involves both conformation selection and induced fit steps. Knowledge of the structural basis of this interaction could facilitate therapeutic targeting of melanomas.

Keywords: RSK; S100 proteins; calcium; crystal structure; extracellular-signal-regulated kinase (ERK); kinetics; melanoma; mitogen-activated protein kinase (MAPK); nuclear magnetic resonance (NMR); small-angle X-ray scattering (SAXS).


Figures

FIGURE 1.
FIGURE 1.
Regulation of CaMK domain containing protein kinase activity. A, inactive CaMKII has an autoinhibitory C-terminal fragment (blue) that is released by calmodulin binding (15). Many CaMK-type kinases share an analogous activation mechanism. B, RSK1 consists of two kinase domains (green) and a flexible C-terminal tail (red) (13, 40). ERK2 (orange) binds directly to the C-terminal linear motif and phosphorylates the activation loop of the CTKD of RSK1 (which is a CaMK-type kinase domain). Then the CTKD phosphorylates the HM of the NTKD. The phosphorylated HM can anchor the AGC master kinase PDK1, which will, in turn, activate the NTKD.
FIGURE 2.
FIGURE 2.
S100B binding inhibits RSK1 activation. A, S100B binding induces a conformational change in GST-RSK1CTKD, which can be monitored by the change of intrinsic tryptophan fluorescence. The dissociation constant calculated based on this change is 4.8 μm. CaM is unable to induce a similar effect on RSK1 (empty circles). The measurement is representative of at least three sets of independent experiments, and Kd values were calculated from triplicate data points. Triplicates were independently prepared samples that were assayed at the same time. Error bars show standard deviation from the mean. AU, arbitrary unit. B, presence of S100B inhibits CTKD phosphorylation by ERK2 with a Ki = 6.3 μm in an in vitro kinase assay. S100B fully inhibits the phosphorylation step between active ERK2 and the CTKD phosphorylation. C, presence of S100B also acts as an inhibitor also when an NTKD-HM containing construct is phosphorylated in trans, with a Ki = 6.1 μm. Notice that this inhibition is only partial, indicative of a complex inhibitory mechanism on CTKD-mediated phosphorylation on NTKD. B and C show the mean of three independent reactions, and error bars are standard deviation from the mean. Initial rates of 32P incorporation were normalized to reactions where S100B was absent.
FIGURE 3.
FIGURE 3.
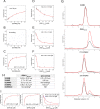
Characterization of RSK1 C-terminal region as the interaction hot spot for S100B binding. A, MAPK binding C-terminal peptide (RSK1(712–735)) binds weakly to S100B (Kd ≈30 μm). B, in the absence of Ca2+, this interaction is abolished indicating specific binding toward S100B. C, longer C-terminal fragment, including the inhibitor helix (RSK1(689–735)), bound markedly stronger (Kd = 5.2 μm). This labeled peptide was used to measure competitive binding of unlabeled peptides in further experiments. D, GST-RSK1CTKD competed with the labeled long peptide with a Kd of 4.2 μm. E, unlabeled RSK1(689–735) bound somewhat stronger (Kd = 1.8 μm). F, extending this peptide to include the full C-terminal extension of RSK1(683–735), which now also included an extension before αL, increased the binding affinity 2 orders of magnitude (Kd = 0.04 μm). The shape of the curve indicates asymmetric (2:1) binding because the S100B concentration was 20 μm. Each measurement is representative of at least two sets of independent experiments where Kd values were calculated from triplicate data points. Triplicates were independently prepared samples that were assayed at the same time. Error bars show standard deviation from the mean. G, gel filtration experiments validated the asymmetric 2:1 stoichiometry in solution. The upper two panels show chromatograms of S100B and peptide samples. The lower panels show chromatograms of S100B and RSK1 peptide complexes with a mixed stoichiometry of 2:1 and 2:2. Notice that the peak corresponding to the free peptide appears only at 2:2 mixing ratio. The panel shows normalized intensity computed according to the maximal absorption at 280 nm (absorption at 260 nm is colored in black and at 280 nm is colored in red). H, summary of binding affinities between different S100 proteins and RSK1 constructs. (Asterisks indicate that the fluorescent reporter was a labeled peptide from p53 (p53(17–56)), which is an S100 interaction partner (41). The RSK1-based reporter peptide was used for S100B and S100P measurements.) (See Fig. 4 for details.) I, S100B and ERK2 binding to RSK1 is not independent. Using the fluorescent reporter RSK1(711–735), it is possible to measure only the ERK2-RSK1 binding in the presence of active/inactive S100B. Binding curves in the presence of 2 mm Ca2+ (left) and 5 mm EDTA (middle) show very similar binding. Competitive binding experiment with a longer peptide (RSK1(689–735)) showed that the binding curves in the presence or absence (black) of Ca2+ are clearly different without or in the presence of 10 times molar excess of S100B (right). A clear decrease in the interaction strength of ERK2-RSK1 binding indicates that ERK2 and S100B binding to RSK1 is mutually exclusive.
FIGURE 4.
FIGURE 4.
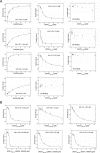
Fits of the fluorescence polarization binding measurements. A, direct (left) and competitive (middle, right) FP measurements for different S100 proteins. In competitive experiments, unlabeled RSK1(683–735) (middle) or RSK1CTKD (right) was used as a competitor. In experiments with S100A2, S100A4, and S100A10, a fluorescein-labeled p53 reporter peptide (p53(17–56)) was used as a reporter peptide. B, competitive FP measurements with unlabeled truncated or mutated RSK1 peptides using the S100B-RSK1 peptide reporter system. Titration experiments without fits to a direct or a competitive binding equation did not show binding or complete competition with the labeled reporter peptide, which was regarded as an indication for nonspecific binding. Each measurement is representative of at least two sets of independent experiments where Kd values were calculated from triplicate data points. Triplicates were independently prepared samples that were assayed at the same time. Error bars show standard deviation from the mean.
FIGURE 5.
FIGURE 5.
Structural properties of the S100B-RSK1 complex. A, summary of binding affinities between S100B and various truncated RSK1 peptide constructs. (See Fig. 3 and 4 for details.) Removal of small regions at both sides greatly influences the binding affinity. The sequence logo was generated by using vertebrate (n = 40, non-redundant) RSK1/2 sequences. Point mutations are highlighted in the sequence. The underlined sequences were modeled into the corresponding complex crystal structure, although others could not be built in. Dotted lines indicate some register ambiguity in the interpretation of the corresponding crystallographic model. In the autoinhibited MAPK-bound state residues between 690 and 707 form the αL helix, and the C-terminal tail from 712 is involved in MAPK binding (13). B, Matthews probabilities of crystal structure A calculated for apo-S100B and for 2:1 and 2:2 complexes (20). In all determined structures the 2:1 complex was the most preferred content. C, FoFc simulated annealing omit map (contoured at 2σ) around the RSK1 peptides (red) for the determined crystal structures A, B, and C. The S100 monomers are shown in gray or light gray schematic representation. Both docking pockets of the S100B are filled by the N- and C-terminal fragments of the RSK1 peptide in structure A, A′, and B; however, only the N-terminal part along with a helical extension is present in structure C. D, detailed view of the observed N- and C-terminal parts of the presented structural states. The N-terminal binding mode in structure A and B is highly similar. Bound calcium ions are shown with black spheres. The binding fragments from structure A′ is colored in orange. E, crystal structure C can be superimposed to an inactive RSK1CTKD structure (green) via their common helical region (red). (revD: the docking motif for ERK2). The inset shows that S100B binds to the solvent-accessible side of the inhibitor helix (αL). Black arrow indicates steric clash between the αG helix of RSK1 and the superimposed S100B.
FIGURE 6.
FIGURE 6.
Solution structure of the S100B-RSK1 complex. A, CD spectra of free (red) and RSK1(683–735)-bound (black) S100B is shown on the left side and the CD spectra of free (red) and S100B-bound (black) RSK1(683–735) peptide is shown on the right side. An increase in the helical content upon complex formation can be observed without major changes in the S100B structure itself. Deconvolution of the difference spectra by the program BeStSel reveals an ∼13-amino acid-long single helix in the bound state (the free peptide is completely disordered) (25). B, based on the crystallographic models, using two N- and two C-terminal RSK1-interacting fragments, four types of S100B-RSK1(683–735) complexes can be constructed. Each model was refined against high quality SAXS data, but only one of the models, corresponding to crystal structure A, matched the experimental SAXS curve (Fig. 7). The best fit from 10 independent CORAL simulations is shown along with a superposition of five randomly chosen simulated structures. For simulations, flexible parts were modeled and are shown here with spheres, whereas the rest was treated as rigid.
FIGURE 7.
FIGURE 7.
Detailed analysis of the solution structure of the fuzzy S100B-RSK1 complex. A, Guinier fit (red lines) to the obtained scattering curve in the concentration series. The measured concentrations of the isolated complex were 8.3, 3.8, 2.0, 0.8, and 0.5 mg/ml (from cyan to black). The curves were scaled and translated for clarity. Each measurement was averaged from 10 independently recorded frames. The scattering of the buffer was determined by measuring 10 frames before and after the sample measurements. Error bars show standard deviation from the mean. The calculated Rg was concentration independently 1.94 nm. B, experimental curve (black line) superimposed with the reconstructed scattering from distance distribution function (red line). Error bars are showed with gray lines. C, distance distribution function (so-called P(r) function) of the S100B-RSK1(683–735) complex derived from the experimental curve. The maximal dimension was determined to be 6.5 nm, and the calculated Rg was identical with the Rg from the Guinier fit (1.94 nm). D, two groups of independently simulated structures were identified by clustering. Representatives of the clusters are shown. The main differences among the clusters are the N-terminal conformations, which are either free or S100-bound. Note that this heterogeneous (10–15 residue long) N-terminal region is responsible for a large affinity increase in peptide truncation experiments. The average diameter of the simulated complexes is around 5 nm. The small tail in the P(r) function up to 6.5 nm can be an effect of the fuzziness of the intermediate and flanking part of the RSK1 peptide. E, overlay of the HSQC spectra of the free (red) and S100B complexed (blue) 15N-labeled RSK1(683–735) peptide. Partial assignment of the free peptide is shown. The cloning “GS” artifacts are highlighted as “Gly” and “Ser.” (Bold residues were assigned with larger confidence and low confidence is marked with italic characters.) Note that a fraction of peaks completely disappeared upon complex formation (e.g. Arg-726, Val-727, and Arg-728), whereas a fraction of peaks shows significant changes (e.g. Gln-692, Ser-703, or Leu-735). The remaining peaks do not show large changes upon S100B binding (e.g. Ser-687, Leu-714, or Ser-720).
FIGURE 8.
FIGURE 8.
Tryptophan fluorescence-based kinetic experiments, exponential analysis. A, binding traces of GST-RSK1CTKD and S100B fitted with a double exponential function. (The S100B concentration decreases from red to blue.) GST-RSK1CTKD Trp fluorescence transients were recorded upon rapidly mixing 1 μm RSK1CTKD with increasing concentrations of S100B2 (0.125, 0.25, 0.5, 1, 2, 4, 8, 16, 32, 64, and 128 μm) in the stopped-flow instrument (post-mix concentrations are stated). B, amplitudes of the fitted exponentials of S100B-RSK1CTKD binding, expressed relative to the calculated maximal Trp fluorescence change. The amplitudes for the first exponential are colored in green and for the second exponential in blue. The total amplitudes (in black) were fit to a quadratic equation (Kd = 1.3 μm). C, observed rate constants of the first exponential phase. Note the decrease in the pseudo-first order region (>20 μm S100B). D, observed rate constants of the second exponential phase. E, dissociation of the S100B-RSK1CTKD complex monitored in kinetic chasing experiments. Trp fluorescence change was monitored upon rapidly mixing a premixture of GST-RSK1CTKD (1 μm) and S100B (15 μm) with increasing amounts of isolated RSK1 peptide (6.25, 9.38, 12.5, 18.75, 25, and 37.5 μm). (The chaser concentration decreases from red to blue.) Traces were fitted with a double exponential function. F, amplitudes of the fitted exponentials of the dissociation experiments, expressed relative to the calculated maximal Trp fluorescence change. Color scheme is identical to B. G, observed rate constants of the fast step (green squares) depend on the applied chaser peptide concentration. The increasing tendency of dissociation rate constants with chaser peptide concentration is indicative of active destabilization of the S100B-RSK1CTKD complex by the peptide. The actual off-rate constants were determined using linear extrapolation (y intercept). H, rate constant of the slower step (blue squares) is independent of chaser peptide concentration. See Fig. 9 for comparison of parameters determined by global fitting (Fig. 10) and exponential analysis (this figure). The measurement is representative of at least three sets of independent experiments, and error bars represent the standard deviations of the fitting.
FIGURE 9.
FIGURE 9.
Comparison of the kinetic parameters based on the exponential analysis and the global fit. The proposed model consists of two consecutive steps involving conformational selection or induced fit based steps. Free RSK1 is in a mixture of S100B binding competent and incompetent states (1st step). After complex formation (2nd step), the primary RSK1-S100B complex undergoes an additional isomerization step (3rd step; see also model in Fig. 10B). The kinetic constants were named based on the upper equation for the global fitting and according to Fig. 8 for the exponential analysis. Accurate assignation of ki and kon was not possible with our experimental setup. The listed parameters are the calculated lower limits for these parameters. However, these two variables show definite covariance, and simultaneous changes in their values do not influences the global, observed Kd, eq. Increasing the speed of these parameters results in a lowered fraction of the released state and therefore results in a more dominant conformational selection model.
FIGURE 10.
FIGURE 10.
Assembly of the S100B-RSK1 complex. A, stopped-flow based kinetic analysis (presented in Fig. 8) by global fitting based on the model shown in B (black lines) (see also Fig. 9). (The S100B concentration decreases from red to green.) B, proposed kinetic model for RSK1-S100B interaction with the determined rate constants. In the unbound state, the kinase populates two forms: autoinhibited (>99%) and released (<1%). Regarding S100B binding, it is the released form that is capable of binding to S100B; therefore, this is an example for conformational selection. We hypothesized that the flexible C-terminal tail is the major source of the apparent conformational heterogeneity of RSK1, because this binding step has a Kd = 10 nm (6.97 s−1/676 μm−1 s−1). This value roughly corresponds to the strong steady-state binding affinity of an isolated peptide comprising this flexible C-terminal RSK1 tail (as the Kd of the S100B-RSK1(683–735) complex was determined to be 40 nm). The S100B-bound complex shows an additional isomerization step, as an example of induced fit, from the “fuzzy” complex into an “S100B-inhibited” state. An additional but kinetically blocked route is shown in gray. The theoretical Kd for this reaction is 2.85 μm. C, small angle x-ray scattering of RSK1CTKD. The fit of the computed scattering curve based on the autoinhibitory state obtained from the ERK2-RSK1 crystal structure (13) is highlighted in red (χ = 1.00). In the inset the crystal structure is displayed as superimposed to the averaged ab initio molecular envelope calculated by DAMMIN (27). D, most reasonable fit from EOM refinement (28) consisted of an ensemble of structures with mixed autoinhibitory and released states (χ = 0.88).
FIGURE 11.
FIGURE 11.
Protein interaction surfaces of S100B and their relevance on differential S100B-RSK1 complex formation. A, schematic view of RSK1-binding sites on S100B as projected on crystal structure A and C. Sites 1–3 had been previously identified as canonical S100B partner protein surfaces (39). However, site 3 is unoccupied in all S100B-RSK1 structures, whereas the novel site 4 is occupied in crystal structure C; therefore, site 4 may be uniquely used in the “S100B-inhibited” complex of RSK1. B, side view of the fuzzy and the S100B inhibited complex. In the fuzzy complex, site 4 remains free. Targeting this binding interface with small molecule inhibitors may tentatively interfere with only the S100B-inhibited complex but leaves fuzzy complex formation intact.

References

    1. Donato R. (2001) S100: a multigenic family of calcium-modulated proteins of the EF-hand type with intracellular and extracellular functional roles. Int. J. Biochem. Cell Biol. 33, 637–668 - PubMed
    1. Marenholz I., Heizmann C. W., and Fritz G. (2004) S100 proteins in mouse and man: from evolution to function and pathology (including an update of the nomenclature). Biochem. Biophys. Res. Commun. 322, 1111–1122 - PubMed
    1. Kiss B., Duelli A., Radnai L., Kékesi K. A., Katona G., and Nyitray L. (2012) Crystal structure of the S100A4-nonmuscle myosin IIA tail fragment complex reveals an asymmetric target binding mechanism. Proc. Natl. Acad. Sci. U.S.A. 109, 6048–6053 - PMC - PubMed
    1. Elliott P. R., Irvine A. F., Jung H. S., Tozawa K., Pastok M. W., Picone R., Badyal S. K., Basran J., Rudland P. S., Barraclough R., Lian L. Y., Bagshaw C. R., Kriajevska M., and Barsukov I. L. (2012) Asymmetric mode of Ca2+-S100A4 interaction with nonmuscle myosin IIA generates nanomolar affinity required for filament remodeling. Structure. 20, 654–666 - PMC - PubMed
    1. Bresnick A. R., Weber D. J., and Zimmer D. B. (2015) S100 proteins in cancer. Nat. Rev. Cancer. 15, 96–109 - PMC - PubMed

Publication types

MeSH terms