. 2015 Nov 16;212(12):1993-2002.
doi: 10.1084/jem.20151069. Epub 2015 Nov 2.

Identification of a novel cis-regulatory element essential for immune tolerance

Affiliations

Identification of a novel cis-regulatory element essential for immune tolerance

Taylor N LaFlam et al. J Exp Med. .

Abstract

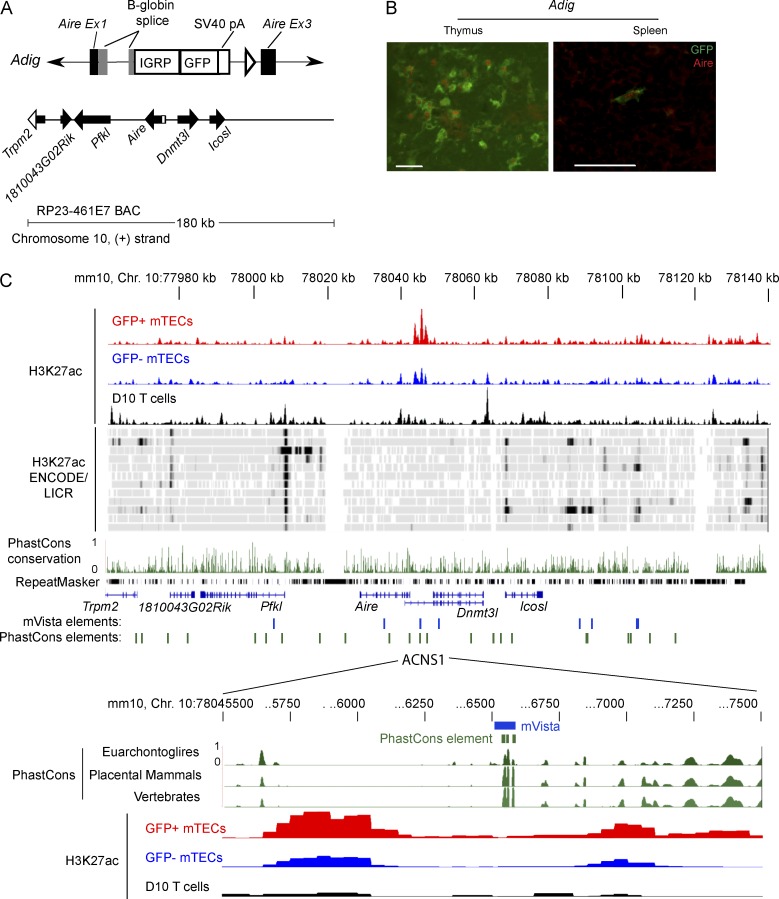
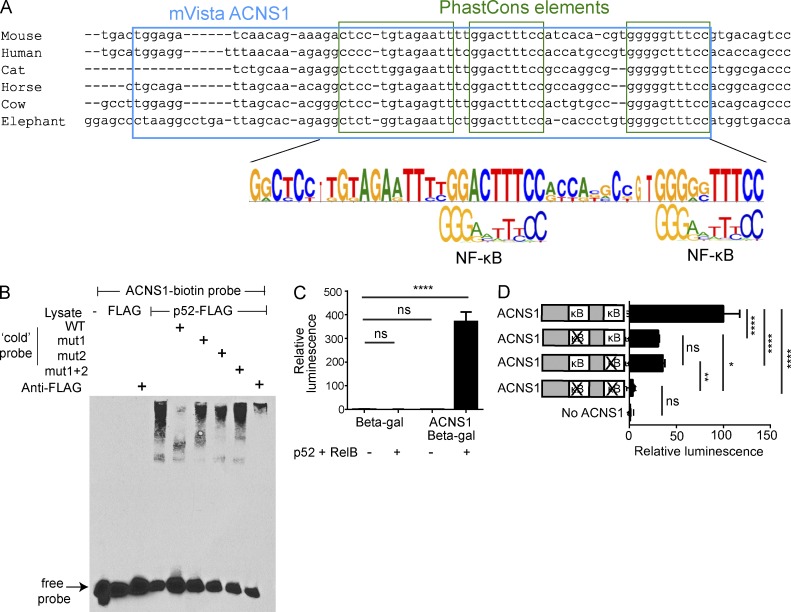
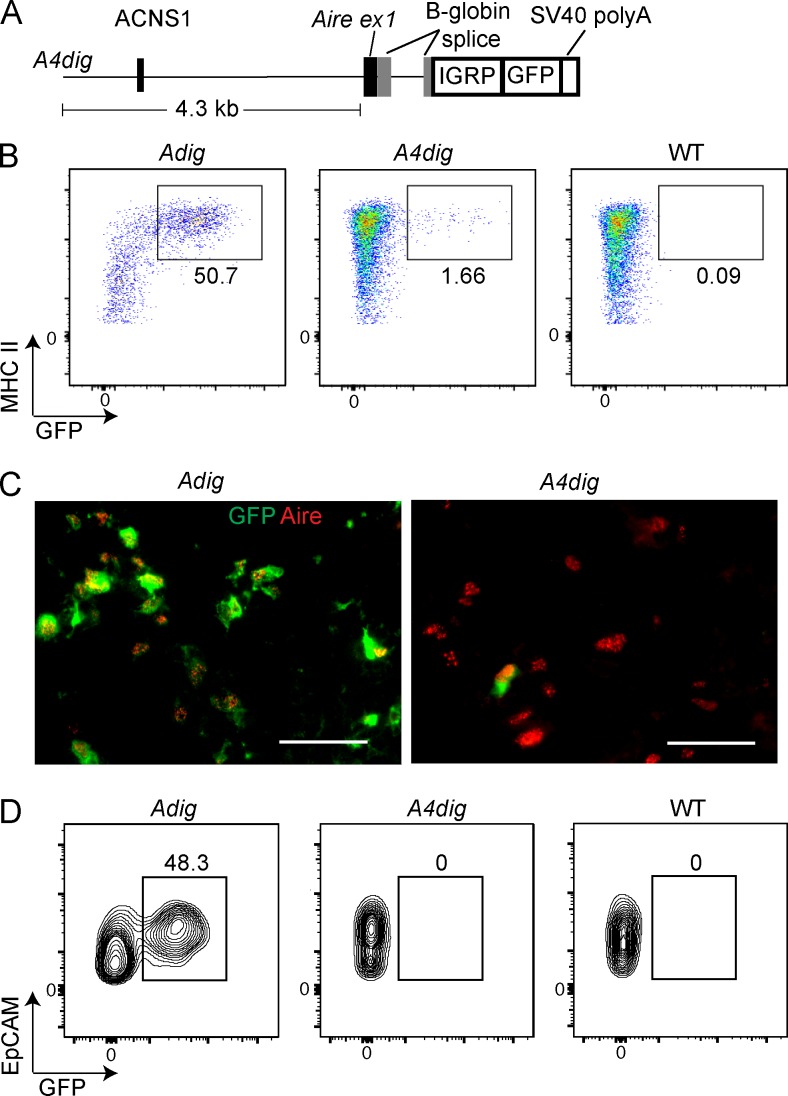
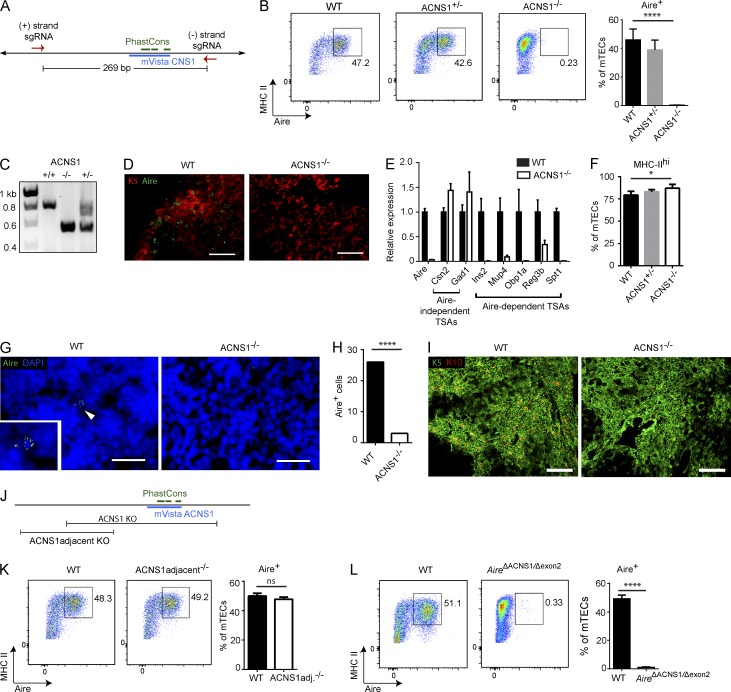
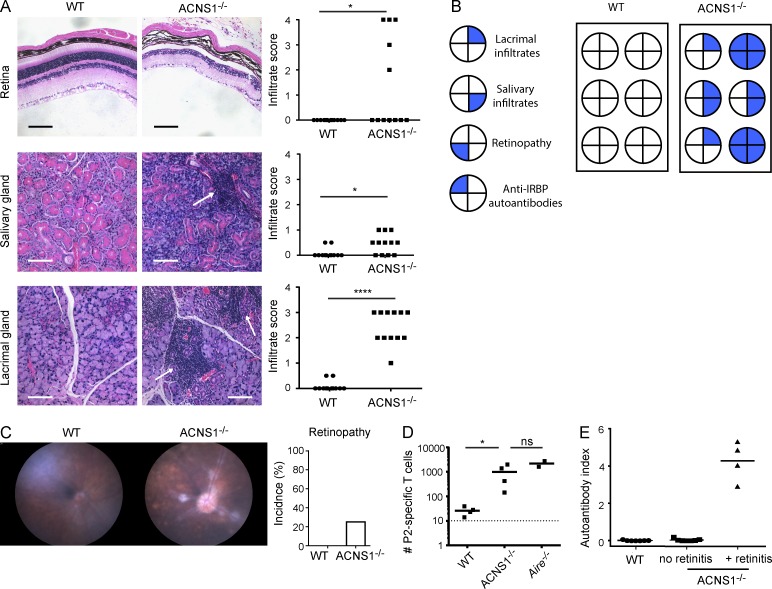
Thymic central tolerance is essential to preventing autoimmunity. In medullary thymic epithelial cells (mTECs), the Autoimmune regulator (Aire) gene plays an essential role in this process by driving the expression of a diverse set of tissue-specific antigens (TSAs), which are presented and help tolerize self-reactive thymocytes. Interestingly, Aire has a highly tissue-restricted pattern of expression, with only mTECs and peripheral extrathymic Aire-expressing cells (eTACs) known to express detectable levels in adults. Despite this high level of tissue specificity, the cis-regulatory elements that control Aire expression have remained obscure. Here, we identify a highly conserved noncoding DNA element that is essential for Aire expression. This element shows enrichment of enhancer-associated histone marks in mTECs and also has characteristics of being an NF-κB-responsive element. Finally, we find that this element is essential for Aire expression in vivo and necessary to prevent spontaneous autoimmunity, reflecting the importance of this regulatory DNA element in promoting immune tolerance.


Figures

Figure 1.
Figure 1.
Identification of candidate Aire cis-regulatory elements. (A) Schematic of Adig transgene: IGRP-GFP cassette replaces the coding portion of Aire exon 1, all of exon 2, and part of exon 3 in the RP23 461E7 BAC. (B) Immunofluorescent staining of GFP (green) and Aire (red) in frozen sections from Adig mice. Bars, 50 µm. (C) Alignment of conservation and ChIP-seq for the region spanned by the 461E7 BAC. The top three rows show unique reads from H3K27ac ChIP-seq of GFP+ and GFP mTECs from Adig mice and the D10 T cell line. Below are selected H3K27ac ENCODE/LICR signal tracks, via UCSC Genome Browser: (top to bottom) brain, bone marrow, brown adipose tissue, heart, kidney, limb, liver, placenta, small intestine, spleen, testis, and thymus. These tracks, aligned to the mm9 genome, are juxtaposed here with H3K27ac reads aligned to mm10, as this 180-kb region differs between mm9 and mm10 at a nucleotide. Below are PhastCons placental mammal track and the RepeatMasker track from UCSC Genome Browser, Refseq genes, conserved noncoding sequences (P < 0.01) identified using mVista, and nonexon PhastCons conserved elements. The expanded region below shows a particular mVista-identified CNS and three PhastCons elements and H3K27ac ChIP-seq. H3K27ac mTEC tracks are representative of three samples, each composed of pooled mTECs from 6–12 mice, analyzed in the same ChIP-seq experiment as the D10 sample.
Figure 2.
Figure 2.
ACNS1 is an NF-κB-responsive element. (A) Comparison of consensus ACNS1 sequence to κB sequence motif. (B) EMSA using nuclear lysates from 293T cells transfected with p52-FLAG, incubated with biotinylated ACNS1 probe. Untagged WT and mutant probes (first, second, or both κB sites, respectively), and anti-FLAG antibody included in specified lanes. (C) Relative luminescence after chemiluminescent detection of β-gal in cellular lysates of 293T cells 48 h after transfection with TK-β-gal or CNS1-TK-β-gal plasmid ± RelB-FLAG and p52-FLAG. (D) Relative luminescence after chemiluminescent detection of β-gal in cellular lysates of 293T cells, 48 h after transfection with RelB-FLAG and p52-FLAG and WT or mutated CNS1-TK-β-gal. In C and D, normalized for transfection efficiency using pRL-CMV. All data are representative of at least three independent experiments. Statistical analysis using Student’s t test: ns, not significant; *, P < 0.05; **, P < 0.01; ****, P < 0.0001.
Figure 3.
Figure 3.
A small transgene is able to reproduce the cell type specificity of Aire expression. (A) Schematic of A4dig transgene: 4.3-kb region extending upstream from the translation start site of Aire followed by an IGRP-GFP cassette. (B) Flow cytometry of mTECs, showing frequency (%) of GFP+ cells in Adig, A4dig, and WT mice. (C) Immunofluorescent staining of frozen thymic sections, with staining for GFP (green) and Aire (red). Bars, 50 µm. (D) Flow cytometry of eTACs showing frequency (%) of GFP+ cells in Adig, A4dig, and WT mice. Data in B and D are representative of eight distinct A4dig founder lines analyzed across three experiments. Data in C are representative of two independent experiments with two to three mice per genotype.
Figure 4.
Figure 4.
ACNS1 is required for Aire expression. (A) Schematic of the CRISPR-Cas9–mediated germline deletion of ACNS1. Arrows show the sites targeted by guide RNAs. (B) Flow cytometry of mTECs, showing frequency (%) of Aire+ cells. Bar graph (right) shows mean ± SD frequencies of Aire+ cells among mTECs from WT, ACNS1+/−, and ACNS1−/− mice. (C) Gel electrophoresis of products from ACNS1 genotyping PCR. Broad upper band is consistently seen in heterozygotes. (D) Immunofluorescent staining for cytokeratin-5 (red) and Aire (green) in frozen thymic sections from WT and ACNS1−/− mice. Bars, 50 µm. (E) Quantitative PCR analysis of Aire and select TSA genes, comparing RNA from WT and ACNS1−/− mTECs, showing mean ± SD (technical replicates), normalized to Actb. (F) Bar graph shows mean ± SD frequencies of MHChi cells among mTECs from WT, ACNS1+/−, and ACNS1−/− mice. (G) Immunofluorescent staining for Aire (green) with DAPI counterstain in frozen lymph node sections from WT and ACNS1−/− mice. Bars, 25 µm. Inset in WT image shows Aire+ cell indicated by arrowhead. (H) Graph summarizes the results in G, showing the number of Aire+ cells observed in 80 lymph node sections from WT and ACNS1−/− mice. (I) Immunofluorescent staining for cytokeratin-5 (green) and cytokeratin-10 (red) in frozen thymic sections from WT and ACNS1−/− mice. Bars, 250 µm. (J) Schematic showing ACNS1adjacent deletion and ACNS1 deletion. (K) Flow cytometry of mTECs, showing frequency (%) of Aire+ cells. Bar graph (right) shows mean ± SD frequencies of Aire+ cells among mTECs from WT and ACNS1adjacent−/− mice. (L) Flow cytometry of mTECs, showing frequency (%) of Aire+ cells. Bar graph (right) shows mean ± SD frequencies of Aire+ cells among mTECs from WT and AireΔACNS1/Δexon2 (compound heterozygote) mice. Data in B, F, K, and L each summarize three independent experiments with one or more mice per group and totaling at least five mice per group. Data in E are representative of two independent experiments with three replicates each. Data in D and G are representative of two independent experiments with at least three mice per group. Data in I are representative of two independent experiments with at least two mice per group. B, K, and L were analyzed by Student’s t test, and H was analyzed by Garwood method of Poisson distribution confidence interval: ns, not significant; *, P < 0.05; and ****, P < 0.0001.
Figure 5.
Figure 5.
Mice lacking ACNS1 develop spontaneous autoimmunity. (A) Representative hematoxylin and eosin–stained retinal, salivary, and lacrimal sections from 14–16-wk-old WT and ACNS1−/− mice; arrows indicate mononuclear infiltrates. Bars, 100 µm. Graphs (right) show disease severity scoring for each tissue; each dot is a single mouse and short horizontal lines show the means. (B) Correlation of four manifestations of autoimmunity in a cohort of WT and ACNS1−/− mice. (C) Representative funduscopic images of retinas of 10–15-wk-old WT and ACNS1−/− mice. Graph summarizes the incidence of retinopathy in each genotype. (D) WT, ACNS1−/−, and Aire−/− mice, the last serving as a positive control, were immunized with the IRBP P2 peptide and lymph nodes and spleen harvested 9–10 d later for P2-I-Ab tetramer-based quantitation of P2-specific T cells. Each dot on the graph represents an individual mouse, the short horizontal lines show the means, and the dotted line represents the limit of detection. (E) Radioligand binding assay of anti-IRBP antibodies in sera collected from 10-wk-old WT and ACNS1−/− mice. Autoantibody index of 1 is defined using a sample with 367 µg/ml of polyclonal rabbit anti-IRBP antibody. Data in A are from two independent cohorts, each with six WT and six ACNS1−/− mice; B summarizes one of these cohorts. Data in C are pooled from several experiments, totaling 22 WT and 8 ACNS1−/− mice. Data in D are representative of two independent experiments, each with four WT, four ACNS1−/−, and two Aire−/− mice. Data in E are pooled from three experiments, totaling 7 WT and 11 ACNS1−/− mice. A and D were analyzed by Mann-Whitney rank-sum testing and C was analyzed by χ2 test: ns, not significant; *, P < 0.05; and ****, P < 0.0001.

References

    1. Aaltonen J., Bjorses P., Perheentupa J., Horelli-Kuitunen N., Palotie A., Peltonen L., Lee Y.S., Francis F., Henning S., Thiel C., et al. Finnish-German APECED Consortium . 1997. An autoimmune disease, APECED, caused by mutations in a novel gene featuring two PHD-type zinc-finger domains. Nat. Genet. 17:399–403. 10.1038/ng1297-399 - DOI - PubMed
    1. Akiyama T., Shimo Y., Yanai H., Qin J., Ohshima D., Maruyama Y., Asaumi Y., Kitazawa J., Takayanagi H., Penninger J.M., et al. 2008. The tumor necrosis factor family receptors RANK and CD40 cooperatively establish the thymic medullary microenvironment and self-tolerance. Immunity. 29:423–437. 10.1016/j.immuni.2008.06.015 - DOI - PubMed
    1. Anderson M.S., Venanzi E.S., Klein L., Chen Z., Berzins S.P., Turley S.J., von Boehmer H., Bronson R., Dierich A., Benoist C., and Mathis D.. 2002. Projection of an immunological self shadow within the thymus by the aire protein. Science. 298:1395–1401. 10.1126/science.1075958 - DOI - PubMed
    1. Creyghton M.P., Cheng A.W., Welstead G.G., Kooistra T., Carey B.W., Steine E.J., Hanna J., Lodato M.A., Frampton G.M., Sharp P.A., et al. 2010. Histone H3K27ac separates active from poised enhancers and predicts developmental state. Proc. Natl. Acad. Sci. USA. 107:21931–21936. 10.1073/pnas.1016071107 - DOI - PMC - PubMed
    1. Derbinski J., Schulte A., Kyewski B., and Klein L.. 2001. Promiscuous gene expression in medullary thymic epithelial cells mirrors the peripheral self. Nat. Immunol. 2:1032–1039. 10.1038/ni723 - DOI - PubMed

Publication types

MeSH terms

Associated data