. 2015 Oct 13:9:127.
doi: 10.3389/fncom.2015.00127. eCollection 2015.

Emergent gamma synchrony in all-to-all interneuronal networks

Affiliations

Emergent gamma synchrony in all-to-all interneuronal networks

Shivakeshavan Ratnadurai-Giridharan et al. Front Comput Neurosci. .

Abstract

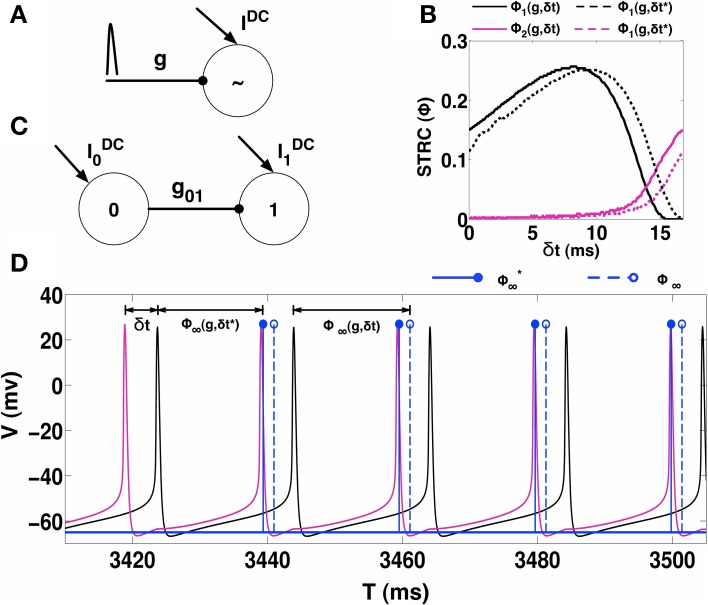
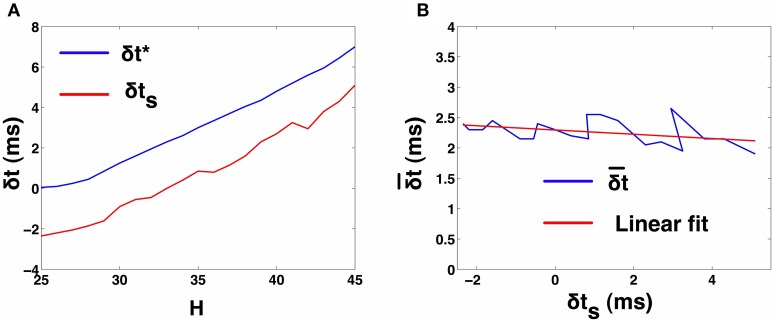
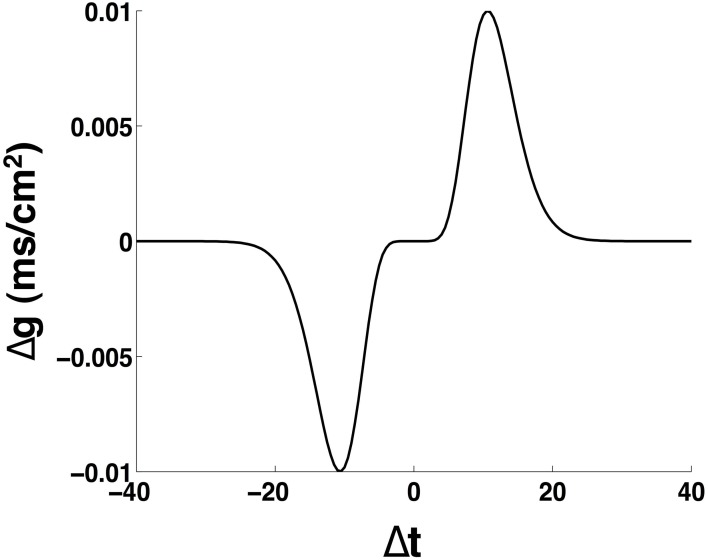
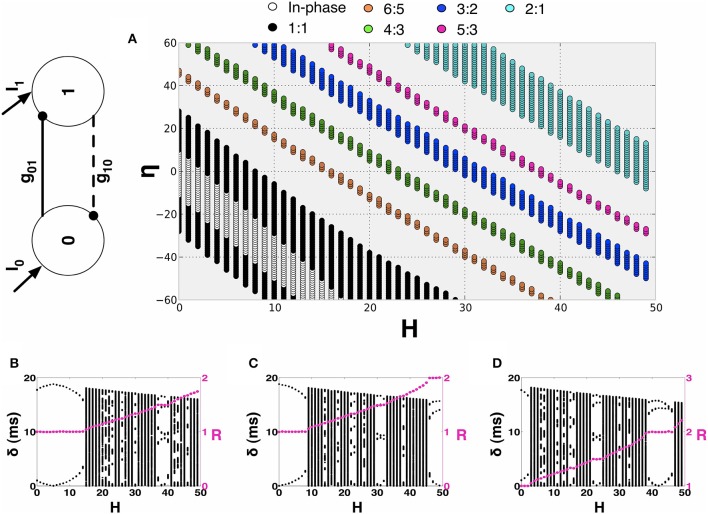
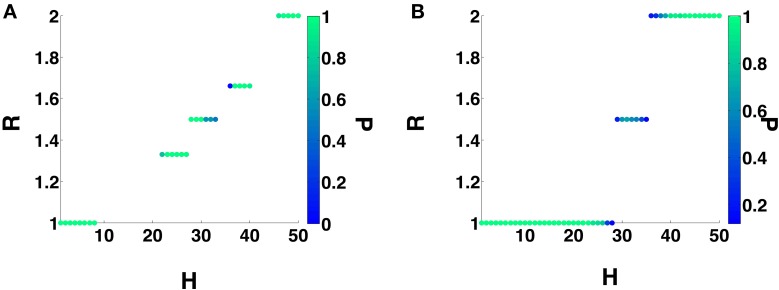
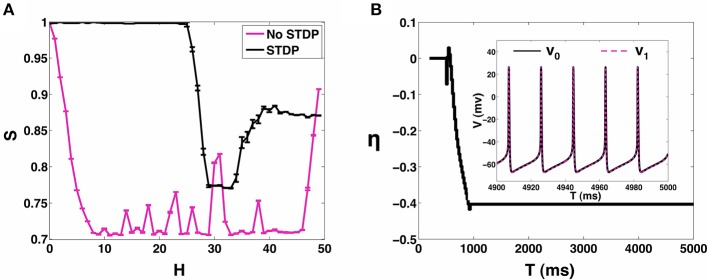
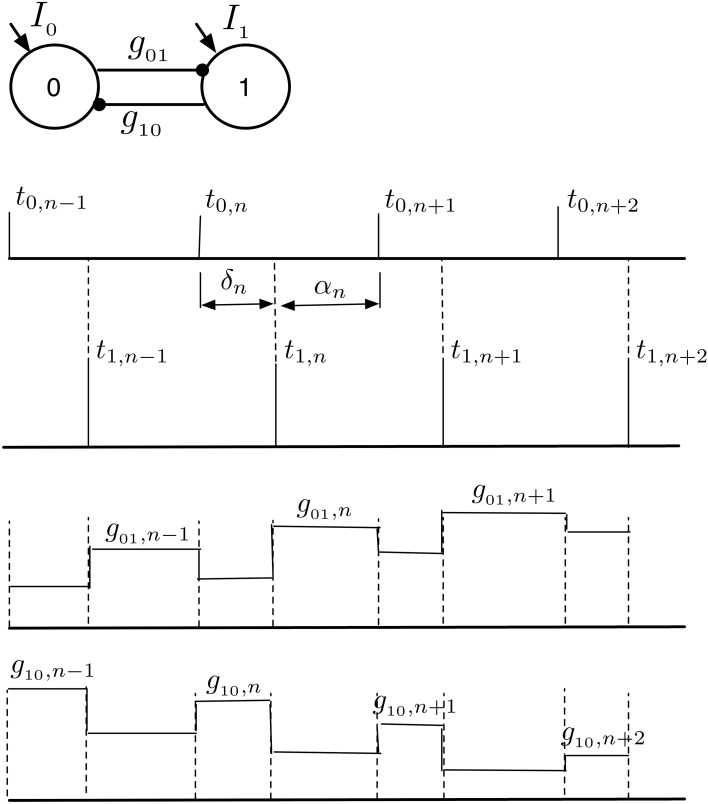
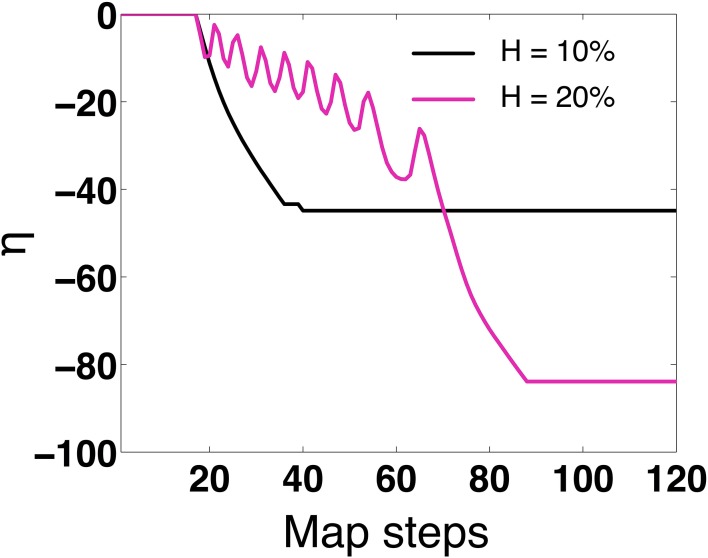
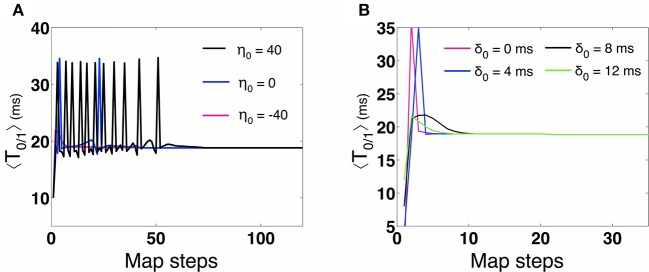
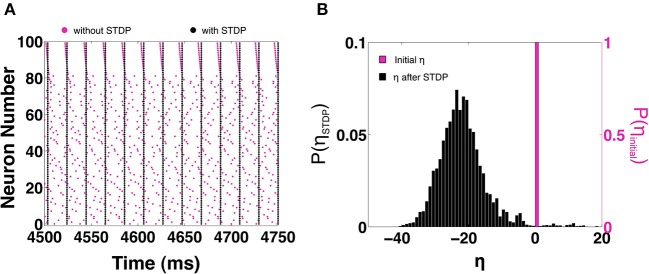
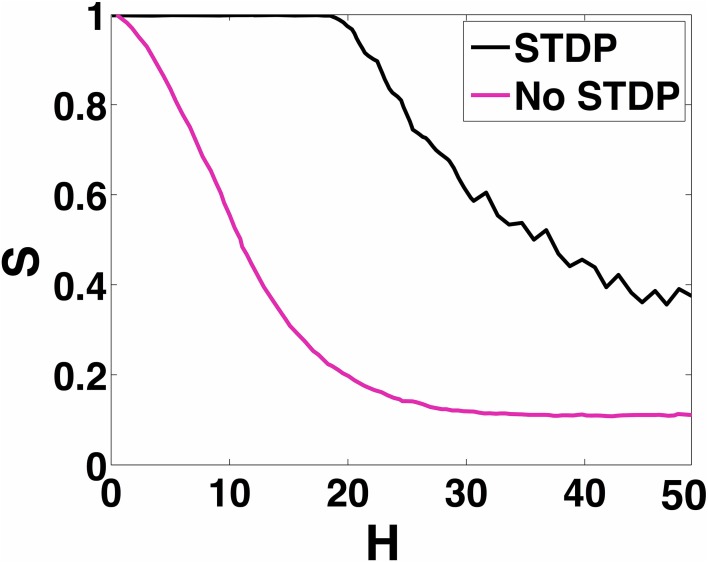
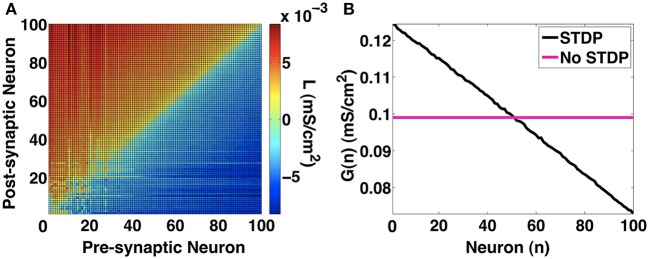
We investigate the emergence of in-phase synchronization in a heterogeneous network of coupled inhibitory interneurons in the presence of spike timing dependent plasticity (STDP). Using a simple network of two mutually coupled interneurons (2-MCI), we first study the effects of STDP on in-phase synchronization. We demonstrate that, with STDP, the 2-MCI network can evolve to either a state of stable 1:1 in-phase synchronization or exhibit multiple regimes of higher order synchronization states. We show that the emergence of synchronization induces a structural asymmetry in the 2-MCI network such that the synapses onto the high frequency firing neurons are potentiated, while those onto the low frequency firing neurons are de-potentiated, resulting in the directed flow of information from low frequency firing neurons to high frequency firing neurons. Finally, we demonstrate that the principal findings from our analysis of the 2-MCI network contribute to the emergence of robust synchronization in the Wang-Buzsaki network (Wang and Buzsáki, 1996) of all-to-all coupled inhibitory interneurons (100-MCI) for a significantly larger range of heterogeneity in the intrinsic firing rate of the neurons in the network. We conclude that STDP of inhibitory synapses provide a viable mechanism for robust neural synchronization.

Keywords: STDP; computational; gamma; interneuron; network synchronization; plasticity.


Figures

Figure 1
Figure 1
STRC Calculations. (A) Schematic for determining the STRC using the standard method. (B) The neuron firing intrinsically at 60 Hz, receives inhibitory synaptic perturbation with synaptic parameters: ER = −75 mV, τR = 0.1 ms, τD = 5 ms, and g = 0.1 mS/cm2. The original STRC is shown in solid colors while the STRC with the included phase correction term (δt*) is represented by the dotted lines. (C) Schematic of an uni-directionally coupled two-interneuron network. (D) For H = 30 the neurons exhibit phase-locked 1:1 synchronization. The spike from Neuron 0 (black voltage trace) synaptically perturbs neuron 1 (magenta voltage trace) at a fixed δt during every firing cycle of neuron 1. The solid blue lines indicate the spike-time shift calculated using the STRC that incorporates the correction factor. The dotted blue lines indicate the spike-time shift calculated using the original STRC's without any correction term.
Figure 2
Figure 2
2-UCI Simulation and STRC Based Spike Time Calculations. (A) Shows the variation of simulation spike time difference δt* and STRC based map predicted δts as H is varied. The negative values for δts is due to the inaccuracy of the standard STRC method arising from second order STRC components. (B) Shows the difference between actual and estimated spike time differences in the 2-UCI network. A linear fit approximately describes the relationship between δt¯ and δts as: δt¯=-0.035064*δts+2.2955.
Figure 3
Figure 3
Schematic of the spike timing dependent plasticity rule. The parameters are: α = 0.94, β = 10, g+ = g = 0.01 mS/cm2.
Figure 4
Figure 4
Synchronization manifold of the 2-MCI network. (A) Synchronization manifold of the 2-MCI network (shown in inset). The Figure shows the domain of m:n synchronization for the 2-MCI network in the two dimensional plane spanned by the network heterogeneity parameter H, and the network imbalance parameter η. In (B–D), we plot the time lag δ between the firing times of the two neurons in the 2-MCI network as function of the network temporal heterogeneity parameter H for three different cases of the network temporal heterogeneity parameter η = {−20, 0, 20}, respectively. In each Figure, we also plot the ratio of mean firing periods of the two neurons R (magenta dots).
Figure 5
Figure 5
2-MCI Synchronization Ratio probability for η0 = 0. (A) Shows the probability of the 2-MCI network to reach different orders of synchronization without STDP. (B) Shows the probability for different orders of synchronization with STDP. The range of H for which the network can synchronize is significantly enhanced for the 1:1 domain and higher orders.
Figure 6
Figure 6
2-MCI Synchrony metric. (A) A measure of the synchrony metric when STDP is enabled (black) and without STDP (magenta) for the range 0 ≤ H ≤ 50. (B) Shows the evolution of η for an example initial case of {η0 = 0, H = 10}. In the inset we show the corresponding voltage traces of the neurons after reaching in-phase synchronization.
Figure 7
Figure 7
1:1 Phase locked synchrony in a 2-MCI network. This figure illustrates the evolution of consecutive spike times {δ, α} during phase locked 1:1 synchronization. The corresponding changes in {g01, g10} due to the STDP rule are also shown. We use this concept of 1:1 phase locked spike-time and STDP evolution to derive the map defined in Equation (15).
Figure 8
Figure 8
Map evolution of η. We validate that under STDP, the map evolves to stationary values of η that allow in-phase synchronization. For H = 10 the map predicts η = −44 (as compared to η = −40 for 2-MCI simulations). For H = 20 the map predicts η = −82 (as compared to η = −80 for 2-MCI simulations).
Figure 9
Figure 9
Numerical stability analysis of the 2-MCI map. (A) The evolution of the map's predicted synchrony period 〈T0∕1〉 for different initial conditions of η0. (B) The evolution of the map's synchrony period 〈T0∕1〉 for different initial conditions of δ.
Figure 10
Figure 10
STDP based synchronization in a 100-MCI network. (A) Shows a raster of the spike times with STDP (black) and without STDP (magenta). (B) The corresponding distribution of η-values with STDP (black) and without STDP (magenta).
Figure 11
Figure 11
100-MCI Synchrony metric. Here we measure the measured synchrony of the 100-MCI network for a range of 0 ≤ H ≤ 50. In-phase synchronization is significantly enhanced for a wide range of 0 ≤ H ≤ 18 when STDP is enabled (magenta).
Figure 12
Figure 12
Network metrics. (A) Link imbalance of the 100-MCI network when H = 10. The synaptic strength differences between pairs of neurons are color coded. In general synapses originating from slower neurons (lower numbers on x-axis) have a positive network imbalance value. (B) The neuron strength metric measures the total outgoing synaptic strength for each neuron. With STDP, neuron strength linearly decreases in the direction of slowest firing neuron to the fastest neuron, indicating greater synaptic influences of slower neurons.

References

    1. Abarbanel H., Gibb L., Huerta R., Rabinovich M. (2003). Biophysical model of synaptic plasticity dynamics. Biol. Cybern. 89, 214–226. 10.1007/s00422-003-0422-x - DOI - PubMed
    1. Acker C., Kopell N., White J. (2004). Synchronization of strongly coupled excitatory neurons: relating network behavior to biophysics. J. Comp. Neurosci. 15, 71–90. 10.1023/A:1024474819512 - DOI - PubMed
    1. Bartos M., Vida I., Frotscher M., Meyer A., Monyer H., Geiger J., et al. . (2002). Fast synaptic inhibition promotes synchronized gamma oscillations in hippocampal interneuron networks. Proc. Natl. Acad. Sci. U.S.A. 99, 13222–13227. 10.1073/pnas.192233099 - DOI - PMC - PubMed
    1. Bartos M., Vida I., Jonas P. (2007). Synaptic mechanisms of synchronized gamma oscillations in inhibitory interneuron networks. Nat. Rev. Neurosci. 8, 45–56. 10.1038/nrn2044 - DOI - PubMed
    1. Bi G. Q., Poo M. M. (1998). Synaptic modifications in cultured hippocampal neurons: dependence on spike timing, synaptic strength, and postsynaptic cell type. J. Neurosci. 18, 10464–10472. - PMC - PubMed