. 2015 Oct 12:6:500.
doi: 10.3389/fimmu.2015.00500. eCollection 2015.

Real-Time Imaging of Resident T Cells in Human Lung and Ovarian Carcinomas Reveals How Different Tumor Microenvironments Control T Lymphocyte Migration

Affiliations

Real-Time Imaging of Resident T Cells in Human Lung and Ovarian Carcinomas Reveals How Different Tumor Microenvironments Control T Lymphocyte Migration

Houcine Bougherara et al. Front Immunol. .

Abstract

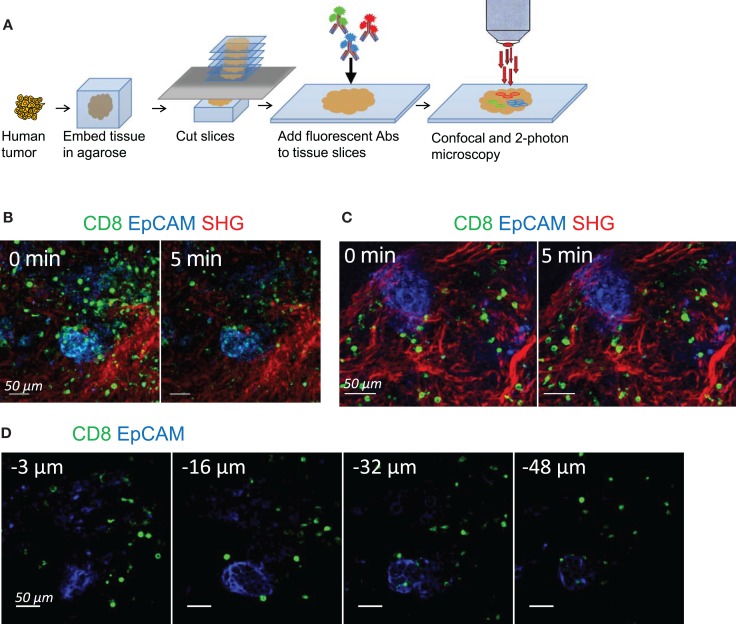
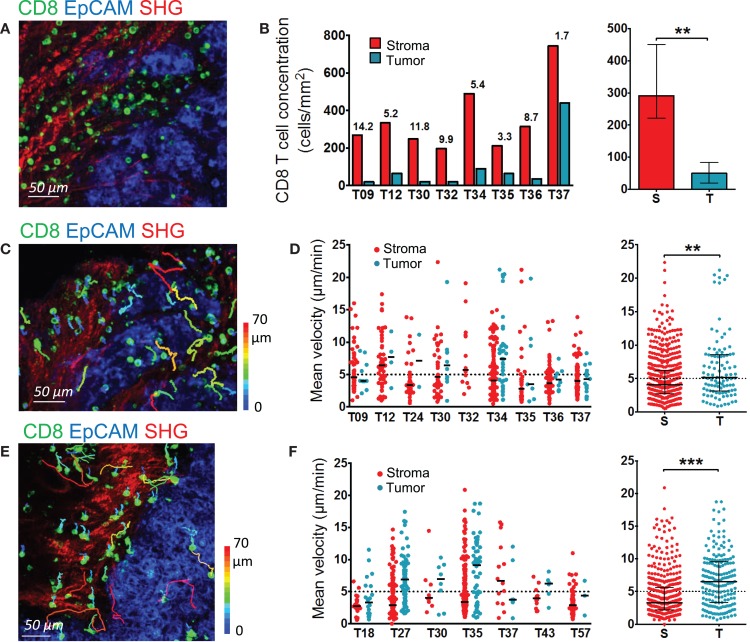
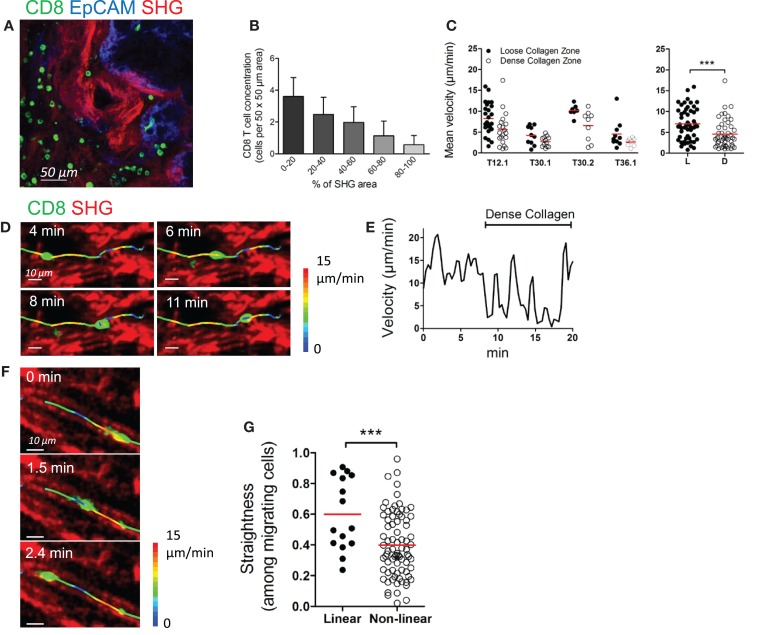
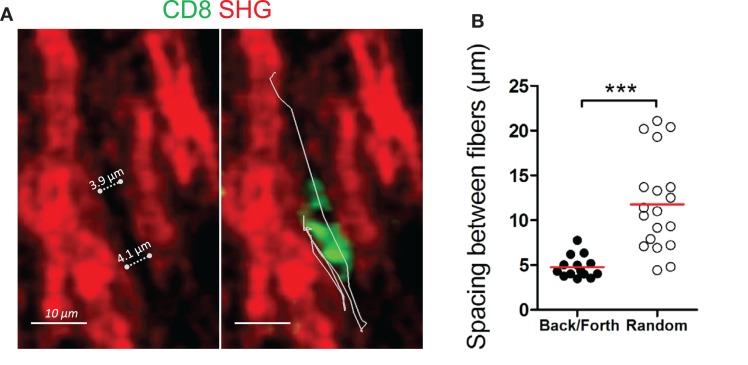
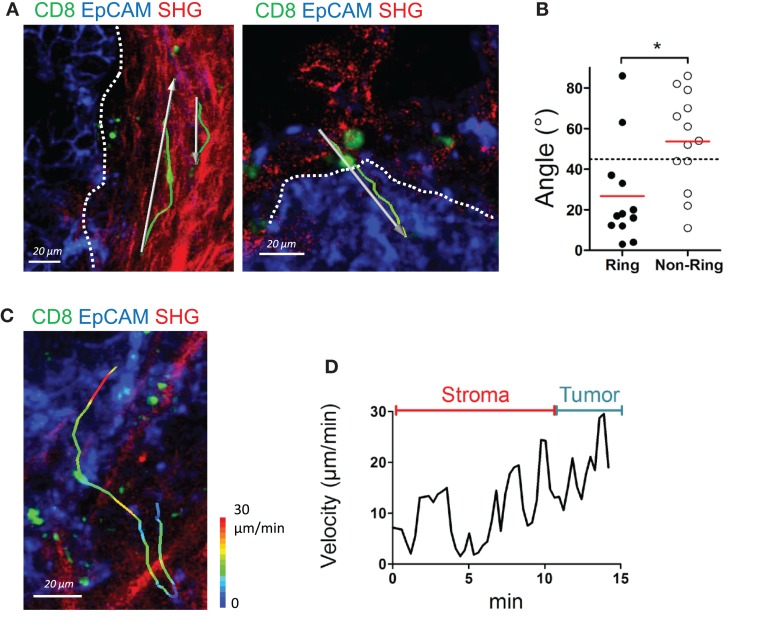
T cells play a key role in the battle against cancer. To perform their antitumor activities, T cells need to adequately respond to tumor antigens by establishing contacts with either malignant cells or antigen-presenting cells. These latter functions rely on a series of migratory steps that go from entry of T cells into the tumor followed by their locomotion in the tumor stroma. Our knowledge of how T cells migrate within tumors mainly comes from experiments performed in mouse models. Whereas such systems have greatly advanced our understanding, they do not always faithfully recapitulate the disease observed in cancer patients. We previously described a technique based on tissue slices that enables to track with real-time imaging microscopy the motile behavior of fluorescent T cells plated onto fresh sections of human lung tumors. We have now refined this approach to monitor the locomotion of resident tumor-infiltrating CD8 T cells labeled with fluorescently coupled antibodies. Using this approach, our findings reveal that CD8 T cells accumulate in the stroma of ovarian and lung carcinomas but move slowly in this compartment. Conversely, even though less populated, tumors islets were found to be zones of faster migration for resident CD8 T cells. We also confirm the key role played by collagen fibers, which, by their orientation, spacing and density, control the distribution and migration of resident CD8 T cells within the tumor stroma. We have subsequently demonstrated that, under some physical tissue constraints, CD8 T cells exhibited a mode of migration characterized by alternate forward and backward movements. In sum, using an ex vivo assay to track CD8 T cells in fresh human tumor tissues, we have identified the extracellular matrix as a major stromal component in influencing T cell migration, thereby impacting the control of tumor growth. This approach will aid in the development and testing of novel immunotherapy strategies to promote T cell migration in tumors.

Keywords: T cells; extracellular matrix; human cancer; imaging; lung cancer; migration; ovarian cancer; stroma.


Figures

Figure 1
Figure 1
Tracking resident CD8 T cell motility in human tumors. (A) Experimental setup. Tissue slices were prepared from human lung and ovarian tumors by means of a vibratome. Slices were then stained with conjugated antibodies and imaged through confocal and two-photon microscopy. (B) Snapshots of two-photon images of an ovarian tumor slice stained for CD8 (green) and EpCAM (blue) to identify tumor cell regions. SHG (red) was used to visualize the collagen network. See also Movie S1 in Supplementary Material. (C) Snapshots of confocal images of an ovarian tumor slice stained for CD8 (green) and EpCAM (blue) to identify tumor cell regions. Second-harmonic generation images (red) captured with a two-photon microscope were superimposed to the confocal images. See also Movie S2 in Supplementary Material. (D) Snapshots of confocal images of an ovarian tumor slice stained with the indicated antibodies and captured at different depths from the cut surface. See also Movies S3 and S4 in Supplementary Material.
Figure 2
Figure 2
Distribution and migration of resident CD8 T cells in human ovarian and lung tumors. (A,B) Distribution of resident CD8 T cells in human ovarian tumors. (A) Representative image of a human ovarian tumor slice stained for EpCAM (blue) and CD8 (green). The SHG signal is in red. (B) Concentration of resident CD8 T cells in the stromal and tumor cell regions of human ovarian carcinomas. Left panel: CD8 density in stromal (red) and tumor cell (blue) regions for individual tumors. Numbers indicate the fold increase of CD8 T cells in stromal regions over tumor islets. Right panel: pooled values, median ± interquartile range. (C,D) Motility of resident CD8 T cells in human ovarian tumors. (C) Trajectories of individual resident CD8 T cells in the stromal (red) and tumor cell (blue) regions of a human ovarian carcinoma slice. See also Movie S5 in Supplementary Material. The slice was stained with the indicated antibodies and imaged for 30 min with a confocal microscope. The SHG signal was recorded at the end with a two-photon microscope. Tracks are color-coded according to CD8 T cell displacement length. (D) Left panel: medians of mean velocities of resident CD8 T cells in the stromal and tumor cell regions of individual human ovarian carcinomas. Right panel: pooled values, medians ± interquartile. (E,F) Motility of resident CD8 T cells in human lung tumors. (E) Trajectories of individual resident CD8 T cells in the stromal (red) and tumor cell (blue) regions of a human lung carcinoma slice. The slice was stained with the indicated antibodies and imaged for 20 min with a confocal microscope. The SHG signal was recorded at the end with a two-photon microscope. Tracks are color-coded according to CD8 T cell displacement length. (F) Left panel: medians of mean velocities of resident CD8 T cells in the stromal and tumor cell regions of individual human lung carcinomas. Right panel: pooled values, medians ± interquartile. Mann–Whitney test, *P < 0.05; **P < 0.01; ***P < 0.001.
Figure 3
Figure 3
Collagen fibers control the distribution and migration of CD8 T cells in the stroma of human ovarian carcinoma. (A) Human ovarian tumor slice stained for CD8 (green) and EpCAM (blue), showing accumulation of resident CD8 T cells in collagen-loose regions. Collagen (red) has been imaged through SHG. (B) Automatically counted number of resident CD8 T cells in different 50 μm × 50 μm stromal regions classified according to the surface (%) occupied by collagen detected through SHG. Results were obtained on slices from four different ovarian tumors. (C) Left panel: mean velocities of resident CD8 T cells in loose and dense collagen areas of individual human ovarian carcinomas. Right panel: pooled values, mean ± SD. (D–G) Motile behavior of resident CD8 T cells relative to collagen fibers. (D) Snapshots are shown at various time intervals for the same CD8 T cell. The trajectory of this CD8 T cell was superimposed over SHG images. The track is color-coded according to the instantaneous velocity. See also Movie S11 in Supplementary Material. (E) Velocity of the CD8 T cell represented in (D). (F) Snapshots are shown at various time intervals for the same CD8 T cell located in a linear collagen region. The trajectory of the CD8 T cell was superimposed over SHG images. The track is color-coded according to the instantaneous velocity. See also Movie S12 in Supplementary Material. (G) The graph shows the straightness index of individual tracks of CD8 T cells in linear and non-linear collagen fiber regions. Straightness indices close to 1 correspond to linear trajectories. Values are compiled from four different ovarian tumors. Mann–Whitney test, *P < 0.05; **P < 0.01; ***P < 0.001.
Figure 4
Figure 4
Back and forth migration of resident CD8 T cells in the stroma of human ovarian carcinomas. (A) Representative image of a resident CD8 T cell that exhibits a back and forth migration mode relative to collagen fibers. See also Movie S13 in Supplementary Material. Left: SHG signal (red) alone. Dotted lines indicate the spacing between collagen fibers. Right: same SHG image as in left but with a CD8 T cell (green) and its trajectory (white line) during a 17-min recording. (B) Spacing between collagen fibers are shown for CD8 T cells that display either back and forth or random migration. The durations of the tracks were non-significantly different within the two groups (13.5 ± 2.6 min for CD8 T cells that exhibit back and forth migration vs. 16.8 ± 2.6 min for CD8 T cells that migrate randomly). Values are compiled from four different ovarian tumors. t-test, *P < 0.05; **P < 0.01; ***P < 0.001.
Figure 5
Figure 5
The structure of the collagen around tumor islets dictates the migration of resident CD8 T cells. (A) Representative images of resident CD8 T cells migrating in peritumoral areas surrounded by ring (left) and non-ring (right) structures. See also Movie S15 in Supplementary Material. Tracks (green lines) and trajectory vectors (white arrows) during a 20-min recording are also shown. Dotted lines denote tumor–stroma interface. (B) Angle between tumor–stroma boundary and trajectory vector of individual CD8 T cells during a 20-min recording, measured in peritumoral regions with ring or non-ring fibrillar structures. Dashed line denotes 45°, the expected result from a cell population migrating with no directional bias. Values were from four different ovarian tumor specimens. (C) Representative image of a CD8 T cell that migrates from the stroma to the tumor cell region in a specimen devoid of ring structure around tumor islets. The track of the CD8 T cells is color-coded according to the instantaneous velocity. See also Movie S16 in Supplementary Material. (D) Velocity of the CD8 T cell represented in (C). Mann–Whitney test, *P < 0.05.

References

    1. Yang Y. Cancer immunotherapy : harnessing the immune system to battle cancer. J Clin Invest (2015) 125(9):3335–7.10.1172/JCI83871 - DOI - PMC - PubMed
    1. Joyce JA, Fearon DT. T cell exclusion, immune privilege, and the tumor microenvironment. Science (2015) 348(6230):74–80.10.1126/science.aaa6204 - DOI - PubMed
    1. Slaney CY, Kershaw MH, Darcy PK. Trafficking of T cells into tumors. Cancer Res (2014) 74(24):7168–74.10.1158/0008-5472.CAN-14-2458 - DOI - PubMed
    1. Mrass P, Takano H, Ng LG, Daxini S, Lasaro MO, Iparraguirre A, et al. Random migration precedes stable target cell interactions of tumor-infiltrating T cells. J Exp Med (2006) 203(12):2749–61.10.1084/jem.20060710 - DOI - PMC - PubMed
    1. Boissonnas A, Fetler L, Zeelenberg IS, Hugues S, Amigorena S. In vivo imaging of cytotoxic T cell infiltration and elimination of a solid tumor. J Exp Med (2007) 204(2):345–56.10.1084/jem.20061890 - DOI - PMC - PubMed