. 2015 Oct 12:6:531.
doi: 10.3389/fimmu.2015.00531. eCollection 2015.

In-Depth Assessment of Within-Individual and Inter-Individual Variation in the B Cell Receptor Repertoire

Affiliations

In-Depth Assessment of Within-Individual and Inter-Individual Variation in the B Cell Receptor Repertoire

Jacob D Galson et al. Front Immunol. .

Abstract

High-throughput sequencing of the B cell receptor (BCR) repertoire can provide rapid characterization of the B cell response in a wide variety of applications in health, after vaccination and in infectious, inflammatory and immune-driven disease, and is starting to yield clinical applications. However, the interpretation of repertoire data is compromised by a lack of studies to assess the intra and inter-individual variation in the BCR repertoire over time in healthy individuals. We applied a standardized isotype-specific BCR repertoire deep sequencing protocol to a single highly sampled participant, and then evaluated the method in 9 further participants to comprehensively describe such variation. We assessed total repertoire metrics of mutation, diversity, VJ gene usage and isotype subclass usage as well as tracking specific BCR sequence clusters. There was good assay reproducibility (both in PCR amplification and biological replicates), but we detected striking fluctuations in the repertoire over time that we hypothesize may be due to subclinical immune activation. Repertoire properties were unique for each individual, which could partly be explained by a decrease in IgG2 with age, and genetic differences at the immunoglobulin locus. There was a small repertoire of public clusters (0.5, 0.3, and 1.4% of total IgA, IgG, and IgM clusters, respectively), which was enriched for expanded clusters containing sequences with suspected specificity toward antigens that should have been historically encountered by all participants through prior immunization or infection. We thus provide baseline BCR repertoire information that can be used to inform future study design, and aid in interpretation of results from these studies. Furthermore, our results indicate that BCR repertoire studies could be used to track changes in the public repertoire in and between populations that might relate to population immunity against infectious diseases, and identify the characteristics of inflammatory and immunological diseases.

Keywords: B cell; B cell receptor repertoire; VDJ recombination; antibody diversity; genetic variation; immunoglobulin gene; immunoglobulin repertoire; reproducibility.


Figures

Figure 1
Figure 1
Sampling scheme. For assessment of within-individual variation, one participant (participant AF01) had blood sampled at five timepoints 1 week apart (temporal replicates). For this participant, two aliquots of B cells were taken at each timepoint to give biological replicates. IgA, IgG, and IgM isotype-specific PCRs were all conducted for one of the biological replicates, but only IgG for the second biological replicate (IgG 3). Additionally, for this participant, IgG PCR replicates were also conducted at each timepoint for one of the biological replicates (IgG 2). For assessment of inter-individual variation, nine additional participants were sampled at a single timepoint, and had IgA, IgG, and IgM PCRs conducted.
Figure 2
Figure 2
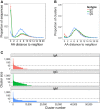
Effect of clustering on the dataset. Nearest neighbor distributions of sequences both before (A) and after (B) clustering. Before clustering, CDR3 AA sequences are used, and after clustering, the cluster center AA sequence is used. The nearest neighbor of each sequence in each dataset is determined by comparing it to every other sequence of the same length in the dataset to find the closest match – that is its nearest neighbor. The distance is then the number of AA difference between the sequence and its nearest neighbor. Distributions were calculated from samples from all 10 participants, and mean ± SEM values plotted. (C) Clusters are ordered according to size, and the size of each cluster plotted. Representative data from one sample is shown (participant AF01, day 0). Horizontal dotted line intersects the y-axis at 10 sequences (0.01% of the total sequenced repertoire), and represents the cutoff between rare and abundant clusters.
Figure 3
Figure 3
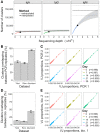
Assessment of sequencing and sampling depth. (A) Extrapolated rarefaction curves for clusters of each isotype. Rarefaction analysis (interpolated) was conducted by subsampling data without replacement at 1,000 sequence increments, and determining the number of clusters represented by these sequences. Cluster richness estimation of the sample (extrapolation) was based on Chao’s estimator formula, and conducted up to a sequencing depth of 500,000 sequences. The curve shows the number of clusters identified as a function of sampling depth – as the curves start to plateau it indicates that increased sampling depth will yield few additional clusters, and sampling depth is sufficient. Results were calculated from samples from all 10 participants, and mean ± SEM (gray curve) plotted. The three horizontal gray lines show the mean ± SEM for the Chao estimate of total clusters in the sample. (B) For the PCR replicates, the percent of clusters present in both replicates was determined, where percent = (AB/min(A,B)) × 100. This was determined for total clusters, rare clusters (<10 sequences), and abundant clusters (≥10 sequences) for all 10 participants, and mean ± SEM values plotted. (C) Correlation in proportion of the total repertoire comprised by each VJ gene combination in the two PCR replicates at each day. Each point represents the proportional representation of a particular VJ combination in the repertoire. r-Values represent Pearson’s correlation coefficients. (D,E) Same as (B,C), but comparing the biological replicates.
Figure 4
Figure 4
Persistence of clusters over time. (A) For samples of each isotype from participant AF01, the total number of clusters across all timepoints was determined, and the number of these present at different number of timepoints calculated. (B) Using the same data as A, circos plots were constructed to show the clusters present on different days. Each arc represents a different day, and clusters are ordered clockwise by abundance, with the abundant clusters colored orange, and the rare clusters colored blue. Lines join clusters present at more than one timepoint.
Figure 5
Figure 5
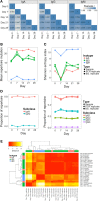
Persistence of global repertoire properties over time. (A) Correlation in relative usage proportion of each VJ gene combination from samples on different days from participant AF01. Stronger correlations are in darker blue. (B) Change in the mean number of V gene mutations of sequences in the repertoire over time. (C) Change in repertoire diversity over time, calculated using the Shannon entropy index, with each cluster represented as a distinct species. (D) Change in proportion of the repertoire comprised by sequences of the different IgA and IgG subclasses over time. (E) Euclidean distances between the diversity profiles of each sample were calculated, used for hierarchical clustering of the samples, and visualized as a heatmap. The color of the heatmap indicates the similarity in the profile between two samples (red = high similarity, white = low similarity). The color bars indicate the isotype of each sample.
Figure 6
Figure 6
Inter-individual variation in global repertoire properties. (A) Principal component analysis of VJ segment usage in each participant. Five samples from participant AF01 are included, each corresponding to a sample from a different day. Differences in mean number of V gene mutations of sequences in the repertoire (B), repertoire diversity (calculated using the Shannon diversity index) (C), and proportion of the repertoire comprised by sequences of each IgG and IgA subclass (D) in each participant. For (B–D), bars show mean values ± SEM.
Figure 7
Figure 7
The public repertoire. (A) The percent of total clusters that are present in different numbers of participants, where percent = (AB/sum(A,B)) × 100. The blue number above each bar shows the absolute number that is shared. (B–D) Mean cluster size, mutation, and CDR3 AA sequence length in the clusters that are unique to a participant (private repertoire) compared to those that are present in at least one other participant (public repertoire). (E) Percent of clusters in the private and public repertoire that are annotated as having specificity toward either TT or Influenza antigens. For (B–E), mean values ± SEM are shown for the 10 participants. Comparisons performed using the paired Mann-Whitney U test.

References

    1. Glanville J, Zhai W, Berka J, Telman D, Huerta G, Mehta GR, et al. Precise determination of the diversity of a combinatorial antibody library gives insight into the human immunoglobulin repertoire. Proc Natl Acad Sci U S A (2009) 106:20216–21.10.1073/pnas.0909775106 - DOI - PMC - PubMed
    1. Tonegawa S. Somatic generation of antibody diversity. Nature (1983) 302:575–81.10.1038/302575a0 - DOI - PubMed
    1. Victora GD, Nussenzweig MC. Germinal centers. Annu Rev Immunol (2012) 30:429–57.10.1146/annurev-immunol-020711-075032 - DOI - PubMed
    1. Galson JD, Clutterbuck EA, Trück J, Ramasamy MN, Münz M, Fowler A, et al. BCR repertoire sequencing: different patterns of B-cell activation after two meningococcal vaccines. Immunol Cell Biol (2015).10.1038/icb.2015.57 - DOI - PMC - PubMed
    1. Mroczek ES, Ippolito GC, Rogosch T, Hoi KH, Hwangpo TA, Brand MG, et al. Differences in the composition of the human antibody repertoire by B cell subsets in the blood. Front Immunol (2014) 5:96.10.3389/fimmu.2014.00096 - DOI - PMC - PubMed

LinkOut - more resources