. 2015 Oct 16:3:155.
doi: 10.3389/fbioe.2015.00155. eCollection 2015.

Using Ambulatory Voice Monitoring to Investigate Common Voice Disorders: Research Update

Affiliations

Using Ambulatory Voice Monitoring to Investigate Common Voice Disorders: Research Update

Daryush D Mehta et al. Front Bioeng Biotechnol. .

Abstract

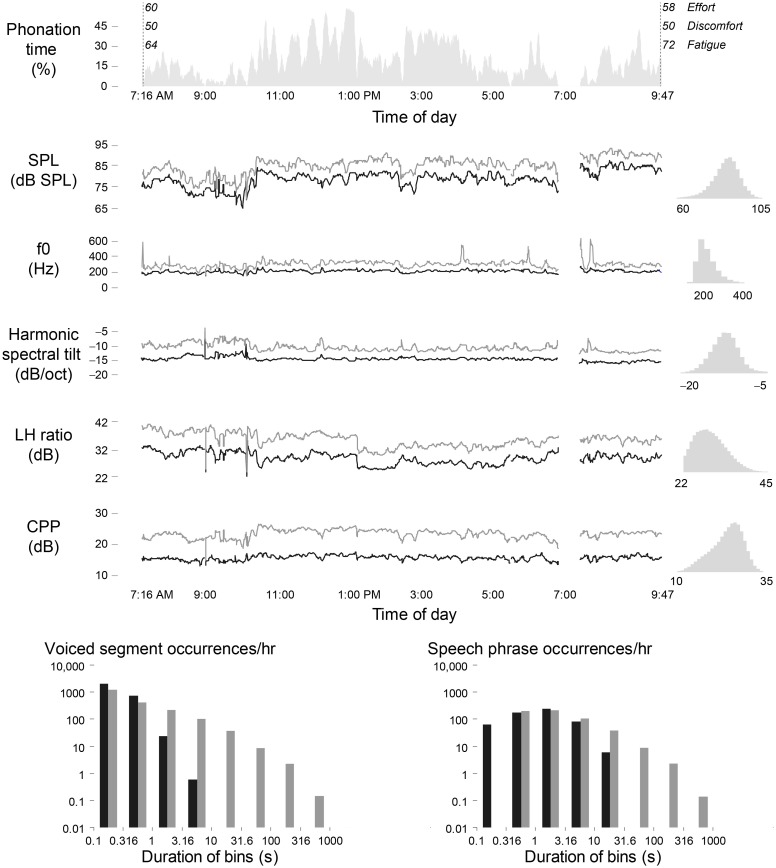
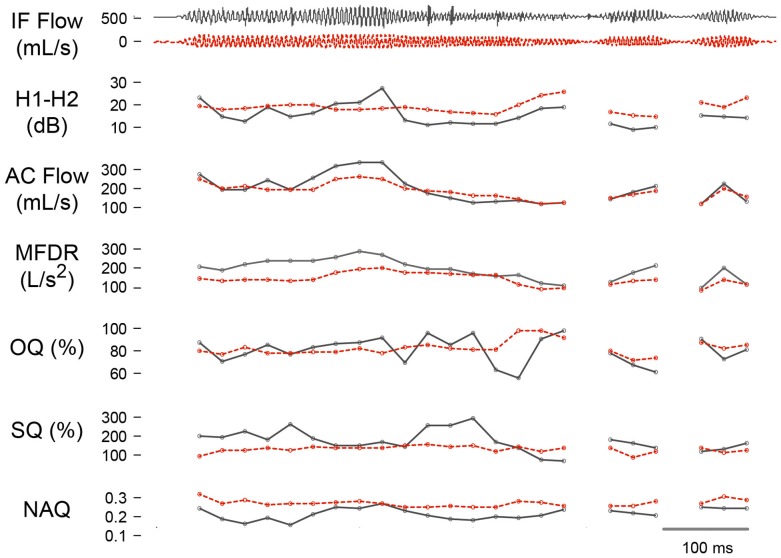
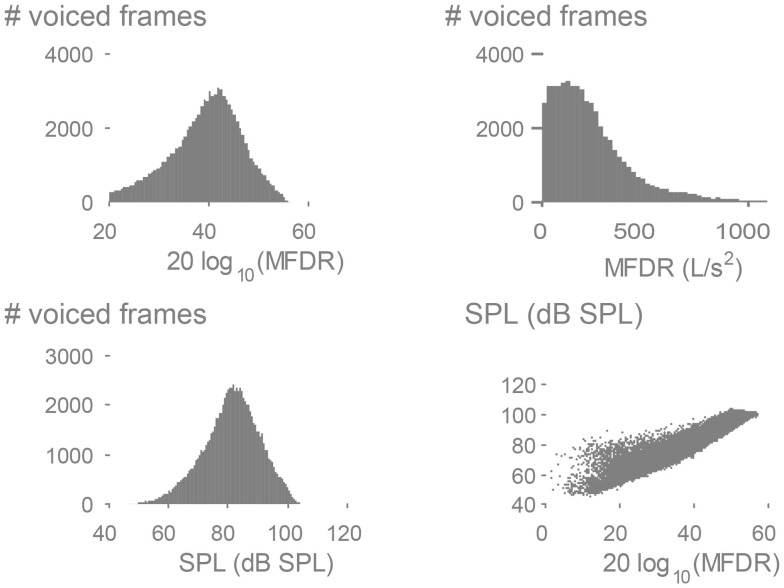
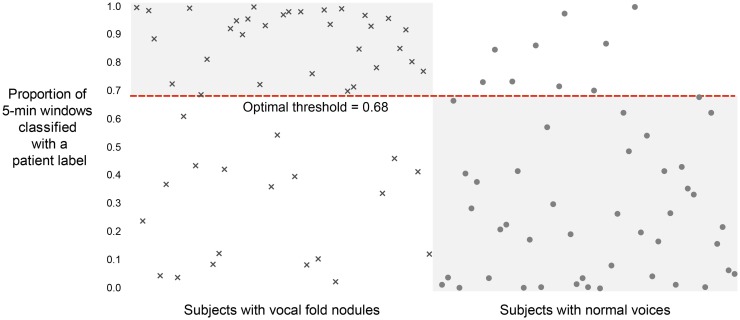
Many common voice disorders are chronic or recurring conditions that are likely to result from inefficient and/or abusive patterns of vocal behavior, referred to as vocal hyperfunction. The clinical management of hyperfunctional voice disorders would be greatly enhanced by the ability to monitor and quantify detrimental vocal behaviors during an individual's activities of daily life. This paper provides an update on ongoing work that uses a miniature accelerometer on the neck surface below the larynx to collect a large set of ambulatory data on patients with hyperfunctional voice disorders (before and after treatment) and matched-control subjects. Three types of analysis approaches are being employed in an effort to identify the best set of measures for differentiating among hyperfunctional and normal patterns of vocal behavior: (1) ambulatory measures of voice use that include vocal dose and voice quality correlates, (2) aerodynamic measures based on glottal airflow estimates extracted from the accelerometer signal using subject-specific vocal system models, and (3) classification based on machine learning and pattern recognition approaches that have been used successfully in analyzing long-term recordings of other physiological signals. Preliminary results demonstrate the potential for ambulatory voice monitoring to improve the diagnosis and treatment of common hyperfunctional voice disorders.

Keywords: accelerometer; glottal inverse filtering; machine learning; vocal function; vocal hyperfunction; voice disorders; voice monitoring.


Figures

Figure 1
Figure 1
Treatment tracks for patients exhibiting (A) phonotraumatic and (B) non-phonotraumatic hyperfunctional vocal behaviors. Week numbers (W1, W2, W3, and W4) refer to time points during which ambulatory monitoring of voice use is being acquired using the smartphone-based voice health monitor. The current enrollment of each patient and matched-control pairing is listed above each week number.
Figure 2
Figure 2
In-laboratory data acquisition setup. (A) Synchronized recordings are made of signals from an acoustic microphone (MIC), electroglottography electrodes (EGG), accelerometer sensor (ACC), high-bandwidth oral airflow (FLO), and intraoral pressure (PRE). (B) Signal snapshot of a string of “pae” tokens required for the estimation of subglottal pressure and airflow during phonation. © 2013 IEEE. Reprinted, with permission, from Mehta et al. (2013).
Figure 3
Figure 3
Ambulatory voice health monitor: (A) smartphone, accelerometer sensor, and cable with interface circuit encased in epoxy; (B) the wired accelerometer mounted on a silicone pad affixed to the neck midway between the Adam’s apple and V-shaped notch of the collarbone. © 2013 IEEE. Reprinted, with permission, from Mehta et al. (X).
Figure 4
Figure 4
Parameterization of the (A) original and (B) inverse-filtered waveforms from the oral airflow (black) and neck-surface acceleration (ACC, red-dashed) waveform processed with subglottal impedance-based inverse filtering. Shown are the time waveform, frequency spectrum, and cepstrum, along with the parameterization of each domain to yield clinically salient measures of voice production.
Figure 5
Figure 5
Illustration of a daily voice use profile for an adult female diagnosed with bilateral vocal fold nodules. Shown are 5-min moving averages of the median and 95th percentile of frame-based voice quality measures, along with self-reported ratings of effort, discomfort, and fatigue at the beginning and end of day. The daylong histograms of each measure are shown to the right of each time series. The plots below display the occurrence histograms of contiguous voiced segments (left) and estimates of speech phrases between breaths (right).
Figure 6
Figure 6
Time-varying estimation of measures derived from the airflow-derived (black) and accelerometer-derived (red-dashed) glottal airflow signal using subglottal impedance-based inverse filtering. Trajectories are shown for an adult female with no vocal pathology for the difference between the first two harmonic amplitudes (H1-H2), peak-to-peak flow (AC Flow), maximum flow declination rate (MFDR), open quotient (OQ), speed quotient (SQ), and normalized amplitude quotient (NAQ).
Figure 7
Figure 7
Exemplary results using subglottal impedance-based inverse filtering of a weeklong neck-surface acceleration signal from an adult female with a normal voice. Histograms of the maximum flow declination rate (MFDR) measure are displayed in physical and logarithmic units. The logarithm of MFDR is plotted against sound pressure level (SPL) to confirm the expected linear correlation (r = 0.94) and slope (1.13 dB/dB).
Figure 8
Figure 8
Classification results on 102 adult female subjects, 51 with vocal fold nodules or polyps and 51 matched-control subjects with normal voices. Per-patient unbiased model performance using summary statistics of sound pressure level and fundamental frequency from non-overlapping, 5-min windows.
Figure 9
Figure 9
Occurrence histogram of voiced/unvoiced contiguous segment pairs. The figure includes the number of times (per hour) that a voiced segment of a given duration is followed by an unvoiced segment of a given duration.

References

    1. Alku P., Backstrom T., Vilkman E. (2002). Normalized amplitude quotient for parametrization of the glottal flow. J. Acoust. Soc. Am. 112, 701–710. 10.1121/1.1490365 - DOI - PubMed
    1. Awan S. N., Roy N., Jetté M. E., Meltzner G. S., Hillman R. E. (2010). Quantifying dysphonia severity using a spectral/cepstral-based acoustic index: comparisons with auditory-perceptual judgements from the CAPE-V. Clin. Linguist. Phon. 24, 742–758. 10.3109/02699206.2010.492446 - DOI - PubMed
    1. Bhattacharyya N. (2014). The prevalence of voice problems among adults in the United States. Laryngoscope 124, 2359–2362. 10.1002/lary.24740 - DOI - PubMed
    1. Carroll T., Nix J., Hunter E., Emerich K., Titze I., Abaza M. (2006). Objective measurement of vocal fatigue in classical singers: a vocal dosimetry pilot study. Otolaryngol. Head Neck Surg. 135, 595–602. 10.1016/j.otohns.2006.06.1268 - DOI - PMC - PubMed
    1. Clifford G. D., Clifton D. (2012). Wireless technology in disease management and medicine. Annu. Rev. Med. 63, 479–492. 10.1146/annurev-med-051210-114650 - DOI - PubMed

LinkOut - more resources