. 2015 Nov 3;10(11):e0140301.
doi: 10.1371/journal.pone.0140301. eCollection 2015.

Genome-Wide Association Studies of the Human Gut Microbiota

Affiliations

Genome-Wide Association Studies of the Human Gut Microbiota

Emily R Davenport et al. PLoS One. .

Abstract

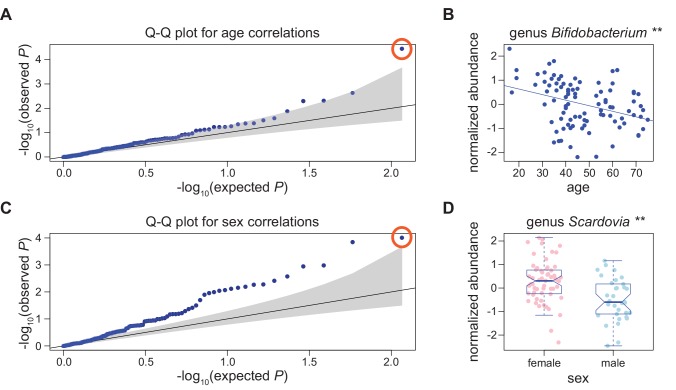
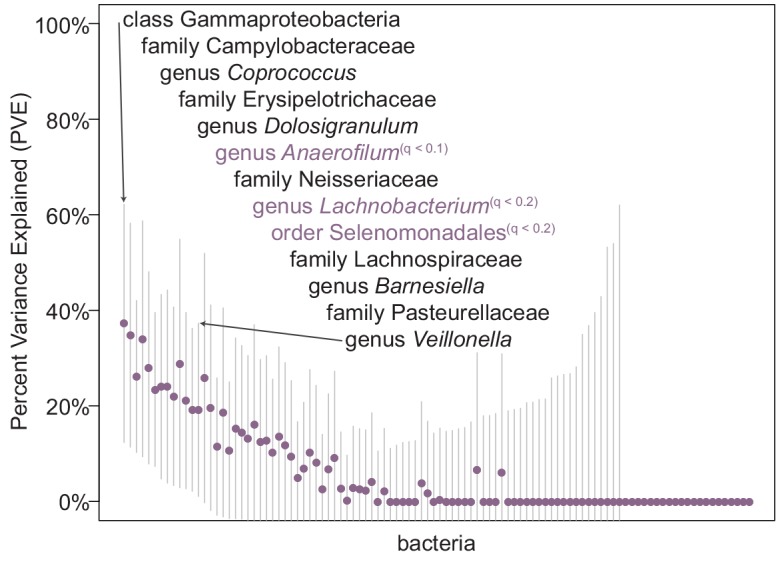
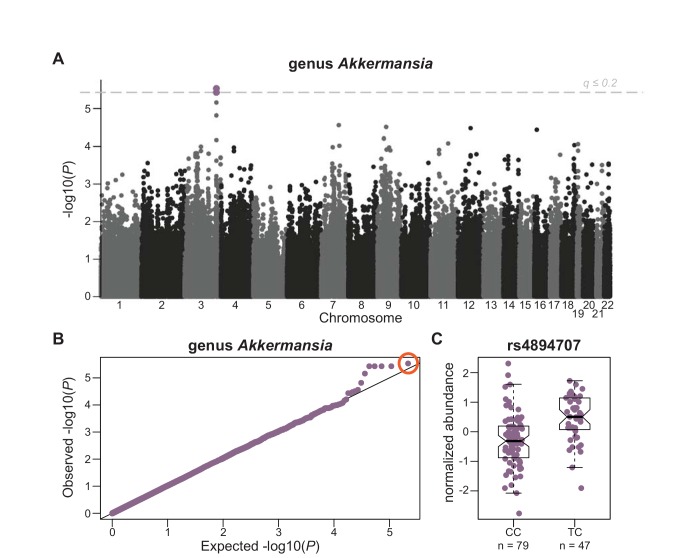
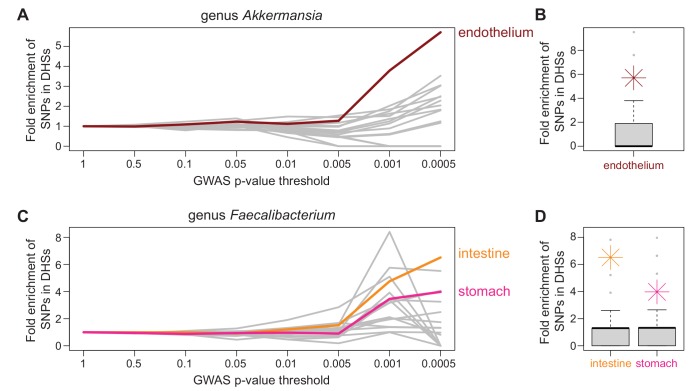
The bacterial composition of the human fecal microbiome is influenced by many lifestyle factors, notably diet. It is less clear, however, what role host genetics plays in dictating the composition of bacteria living in the gut. In this study, we examined the association of ~200K host genotypes with the relative abundance of fecal bacterial taxa in a founder population, the Hutterites, during two seasons (n = 91 summer, n = 93 winter, n = 57 individuals collected in both). These individuals live and eat communally, minimizing variation due to environmental exposures, including diet, which could potentially mask small genetic effects. Using a GWAS approach that takes into account the relatedness between subjects, we identified at least 8 bacterial taxa whose abundances were associated with single nucleotide polymorphisms in the host genome in each season (at genome-wide FDR of 20%). For example, we identified an association between a taxon known to affect obesity (genus Akkermansia) and a variant near PLD1, a gene previously associated with body mass index. Moreover, we replicate a previously reported association from a quantitative trait locus (QTL) mapping study of fecal microbiome abundance in mice (genus Lactococcus, rs3747113, P = 3.13 x 10⁻⁷). Finally, based on the significance distribution of the associated microbiome QTLs in our study with respect to chromatin accessibility profiles, we identified tissues in which host genetic variation may be acting to influence bacterial abundance in the gut.


Conflict of interest statement

Competing Interests: The authors have declared that no competing interests exist.

Figures

Fig 1
Fig 1. Bacterial abundance correlations with age and sex.
A) Q-Q plot for correlations of 116 common bacterial taxa with age in samples collected in winter. Gray shading represents the 95% confidence interval of the null. The point circled in orange is genus Bifidobacterium. B) Abundance of genus Bifidobacterium is inversely correlated with age in samples collected during the winter (** q ≤ 0.01). C) Q-Q plot for correlations of 116 common bacterial taxa with sex in samples collected in winter. The point circled in orange represents genus Scardovia. D) Genus Scardovia was significantly more abundant in females (n = 60) than in males (n = 33) in winter (** q ≤ 0.01).
Fig 2
Fig 2. “Chip heritability” for 102 bacterial taxa tested in the “seasons combined” analysis.
Each point represents the estimated percent variance explained (PVE, or “chip heritability”) for the joint effect of all genotypes analyzed in the GWAS for bacterial abundance during the “seasons combined” analyses. Bars indicate standard error measurements around the estimate. A number of bacterial taxa showed non-zero PVE estimates (listed in order from highest to lowest PVE) with error bars that do not intersect zero, indicating that cumulative common genetic variation can explain some portion of the variation in bacterial abundance observed between individuals. Bacterial taxa that also had at least one nominally significant genetic association at a genome-wide association level are labeled in purple, with the level of significance indicated (q ≤ 0.2 or q ≤ 0.1).
Fig 3
Fig 3. GWAS of genus Akkermansia relative abundance.
A) Manhattan plot of GWAS results for the normalized relative abundance of genus Akkermansia from the “seasons combined” analysis. Each point represents a tested SNP, displayed by chromosomal position (x-axis). The y-axis shows–log10(P-value) for each SNP. SNPs significantly associated with normalized Akkermansia relative abundance (q ≤ 0.2) are shown in purple on chromosome 3. B) Q-Q plot for P-values from the GWAS of the relative abundance of genus Akkermansia. The majority of SNPs lie along the null line, demonstrating the test statistics did not appear to be inflated (due to population stratification, for example). Five SNPs (all in linkage disequilibrium (LD) on chromosome 3) were significantly associated with Akkermansia abundance. The point circled in orange was the most highly associated SNP (rs4894707). C) Normalized Akkermansia abundance, segregated by genotype class at rs4894707 on chromosome 3. Only two genotype classes are represented at this SNP (MAF = 0.185 and Hardy-Weinberg P-value = 0.007 in a larger sample of 1,415 Hutterites that includes the individuals in this study). This SNP lies in a UTR region of the gene PLD1, which as been implicated in obesity studies in African American populations[56].
Fig 4
Fig 4. Identification of candidate tissues.
At increasingly significant P-value thresholds, variants identified through GWAS were enriched in DNase hypersensitivity peaks in a tissue-specific manner. A) For genus Akkermansia, low P-value GWAS SNPs were significantly enriched in DHS peaks in endothelial cell types (red), but not in DHS peaks of the 15 other tissues examined (gray). The x-axis shows the P-value threshold bins examined and y-axis represents fold enrichment for SNPs overlapping DHS peaks in that bin compared to genome-wide for that tissue type. Both the abundance of genus Akkermansia and endothelial barrier function have been associated with obesity, providing a mechanistic hypothesis that can be further investigated. B) For genus Akkermansia, the significance of enrichment of GWAS SNPs overlapping DHS peaks in endothelial tissue in the lowest P-value bin (P ≤ 0.0005) was determined by GWAS permutation (P ≤ 0.05, see Materials and Methods). The distribution of permuted GWAS SNP enrichments in DHS peaks of endothelial tissue is displayed as a boxplot with actual enrichment plotted as red star. C) For genus Faecalibacterium, low P-value GWAS SNPs are significantly enriched in DHS peaks of both intestine (orange) and stomach (pink) tissues (P ≤ 0.05). D) For genus Faecalibacterium, the significance of enrichment of GWAS SNPS overlapping DHS peaks of both intestine and stomach tissues in the lowest P-value bin (P ≤ 0.0005) was determined by GWAS permutation (intestine P ≤ 0.01, stomach P ≤ 0.05, see Materials and Methods). Members of Faecalibacterium are some of the most common species in the gut and are known to be associated with dysbiosis in patients with irritable bowel syndrome. The distribution of permuted enrichments for each identified candidate tissue is displayed as a boxplot with actual enrichment plotted as an orange (intestine) and pink (stomach) star.

References

    1. Savage DC. Microbial ecology of the gastrointestinal tract. Annual review of microbiology. 1977;31:107–33. 10.1146/annurev.mi.31.100177.000543 . - DOI - PubMed
    1. Backhed F, Ding H, Wang T, Hooper LV, Koh GY, Nagy A, et al. The gut microbiota as an environmental factor that regulates fat storage. Proceedings of the National Academy of Sciences of the United States of America. 2004;101(44):15718–23. . - PMC - PubMed
    1. Turnbaugh PJ, Hamady M, Yatsunenko T, Cantarel BL, Duncan A, Ley RE, et al. A core gut microbiome in obese and lean twins. Nature. 2009;457(7228):480–4. 10.1038/nature07540 - DOI - PMC - PubMed
    1. Turnbaugh PJ, Ley RE, Mahowald MA, Magrini V, Mardis ER, Gordon JI. An obesity-associated gut microbiome with increased capacity for energy harvest. Nature. 2006;444(7122):1027–31. 10.1038/nature05414 . - DOI - PubMed
    1. Nadal I, Donat E, Donant E, Ribes-Koninckx C, Calabuig M, Sanz Y. Imbalance in the composition of the duodenal microbiota of children with coeliac disease. Journal of medical microbiology. 2007;56(Pt 12):1669–74. . - PubMed

Publication types