. 2015 Dec 7;12(12):4301-10.
doi: 10.1021/acs.molpharmaceut.5b00501. Epub 2015 Nov 16.

Metformin Is a Substrate and Inhibitor of the Human Thiamine Transporter, THTR-2 (SLC19A3)

Affiliations

Metformin Is a Substrate and Inhibitor of the Human Thiamine Transporter, THTR-2 (SLC19A3)

Xiaomin Liang et al. Mol Pharm. .

Abstract

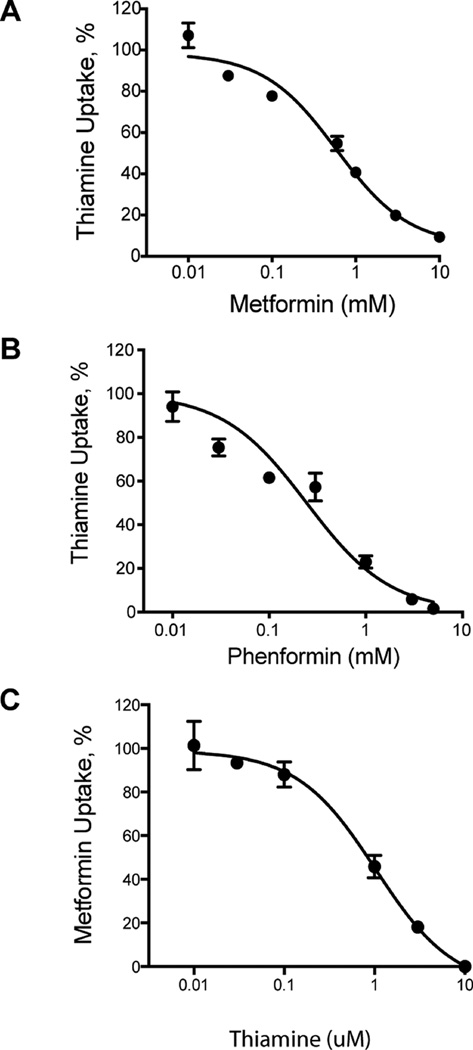
The biguanide metformin is widely used as first-line therapy for the treatment of type 2 diabetes. Predominately a cation at physiological pH's, metformin is transported by membrane transporters, which play major roles in its absorption and disposition. Recently, our laboratory demonstrated that organic cation transporter 1, OCT1, the major hepatic uptake transporter for metformin, was also the primary hepatic uptake transporter for thiamine, vitamin B1. In this study, we tested the reverse, i.e., that metformin is a substrate of thiamine transporters (THTR-1, SLC19A2, and THTR-2, SLC19A3). Our study demonstrated that human THTR-2 (hTHTR-2), SLC19A3, which is highly expressed in the small intestine, but not hTHTR-1, transports metformin (Km = 1.15 ± 0.2 mM) and other cationic compounds (MPP(+) and famotidine). The uptake mechanism for hTHTR-2 was pH and electrochemical gradient sensitive. Furthermore, metformin as well as other drugs including phenformin, chloroquine, verapamil, famotidine, and amprolium inhibited hTHTR-2 mediated uptake of both thiamine and metformin. Species differences in the substrate specificity of THTR-2 between human and mouse orthologues were observed. Taken together, our data suggest that hTHTR-2 may play a role in the intestinal absorption and tissue distribution of metformin and other organic cations and that the transporter may be a target for drug-drug and drug-nutrient interactions.

Keywords: SLC19A3; THTR-2; drug and vitamin interaction; metformin.


Figures

Figure 1
Figure 1
Metformin uptake and effects in cells overexpressing hTHTR-2. (A) Western blotting showed higher hTHTR-2 expression in the HEK-hTHTR-2 overexpressing cells compared with empty vector cells (EV). 12.5 µg of total protein from cell lysate was deglycosylated by PNGase F. (B) Immunofluorescence cell staining showed that hTHTR-2 is highly expressed in the cell membrane of the hTHTR-2 overexpressing cells. (C) 3H thiamine (25 nM) uptake was significantly higher in HEK-hTHTR-2 overexpressing cells compared to empty vector (EV) transfected cells. Cells were incubated in the uptake buffer for 5 min. (D) 14C metformin (5 µM) uptake was significantly higher in HEK-hTHTR-2 overexpressing cells compared to empty vector transfected cells. Cells were incubated in the uptake buffer for 5 min. (E) hTHTR-2 mediated metformin (5 µM) uptake was inhibited by excess unlabeled metformin (5 mM) and fedratinib (10 µM). Cells were incubated in the uptake buffer for 5 min. (F) Thiamine and (G) metformin uptake in cells overexpressing hTHTR-1. hTHTR-1 overexpressing cells and empty vector transfected cells were incubated in the uptake buffer containing 25 nM 3H thiamine and 5 µM 14C metformin for 5 min. Fold changes are normalized to empty vector control uptake. Results shown are the mean ± SD for a representative experiment of n = 3. (H) Greater phosphorylation of both AMPK and ACC in hTHTR-2 overexpressing cells compared to empty vector cells in cells treated with metformin (1 mM and 2 mM) for 2 h.
Figure 2
Figure 2
Kinetic characterization of hTHTR-2 mediated thiamine and metformin uptake. (A, C) 3H thiamine (25 nM) uptake and 14C metformin (5 µM) uptake increased with time in HEK-hTHTR-2. The linear phase of uptake was up to 5 min for thiamine and 15 min for metformin. Data obtained from HEK-hTHTR-2 are represented by close symbols and from empty vector cells by open symbols. (B, D) The initial rate of thiamine and metformin uptake in HEK-hTHTR-2 increased with concentration and was saturable. Cells were incubated with concentrations from 0.1 µM to 30 µM for 3 min for thiamine uptake. For metformin uptake, cells were incubated with concentrations ranging from 0.03 mM to 10 mM for 7 min. Saturable thiamine and metformin uptake was calculated using the difference in accumulation of each compound in hTHTR-2 overexpressing and empty vector cells. The data were fit to a Michaelis–Menten equation. Data shown are the mean ± SD for a representative experiment of n = 3.
Figure 3
Figure 3
Effect of pH on hTHTR-2 mediated metformin uptake. (A) 3H thiamine (25 nM) or (B) 14C metformin (5 µM) was included in the uptake buffer adjusted to pHs 5, 6, 6.5, 7.4, 8, and 8.5, and the cells were incubated for 5 min. Empty squares represent the uptake in HEK-empty vector cells and black circles represent the uptake in HEK-hTHTR-2 cells. Data shown are the mean ± SD for a representative experiment of n = 2.
Figure 4
Figure 4
Human THTR-2 mRNA and protein expression in various tissues. (A) The relative mRNA levels of SLC19A2, SLC19A3, SLC22A1, SLC22A2, and SLC47A1 were determined by real-time PCR. The mRNA expression level of SLC19A2 in colon was set to 100%. Data are presented as mean ± SD, and pooled samples were from 5 to 39 Caucasians. (B) Representative Western blot: hTHTR-2 protein expression in human liver (samples from Giacomini’s lab), duodenum (pool samples from GeneTex), and kidney (pool samples from Abcam) was determined by Western blotting.
Figure 5
Figure 5
hTHTR-2 mediated interaction between biguanides and thiamine. 3H thiamine (25 nM) was coincubated in uptake buffer containing a range of metformin concentrations (0.01–10 mM) (A) or phenformin concentrations (0.01–5 mM) (B) for 5 min. (C) 14C metformin was coincubated in uptake buffer containing a range of thiamine concentrations (0.01–10 µM) for 3 min. The IC50 was calculated by fitting the data to nonlinear regression curve. Data shown are the mean ± SD for a representative experiment of n = 2.
Figure 6
Figure 6
Interaction of various organic cations with human THTR-2. (A) hTHTR-2 overexpressing and empty vector transfected cells were incubated with 3H MPP+ in the absence (control) or presence of fedratinib (100 µM) for 10 min. (B) hTHTR-2 overexpressing and empty vector transfected cells were incubated with 3H famotidine in the absence or presence of fedratinib (100 µM) for 10 min. (C, D) hTHTR-2 overexpressing and empty vector transfected cells were incubated with 3H thiamine (25 nM) or 14C metformin (5 µM) alone (control) or in the presence of chloroquine (1 mM), verapamil (1 mM), famotidine (1 mM), amprolium (1 mM), and pyrithiamine (200 µM) for 5 min. Data shown are the mean ± SD for a representative experiment of n = 2.
Figure 7
Figure 7
Functional characterization of mouse THTR-2 (mTHTR-2). (A) 3H thiamine (25 nM) uptake was significantly higher in HEK-mTHTR-2 overexpressing cells compared to empty vector transfected cells. Cells were incubated in the uptake buffer for 10 min. (B) mTHTR-2 overexpressing and empty vector transfected cells were incubated with 14C metformin (5 µM) in the absence or presence of fedratinib (100 µM) for 10 min. (C, D) 3H thiamine (25 nM) was coincubated with a range of metformin (0.01–10 mM) or fedratinib (0.01–30 µM) concentrations for 5 min. Background uptake in empty vector transfected cells was subtracted from the uptake in the mTHTR-2 cells, and the difference was fit to a nonlinear regression curve. Data shown are the mean ± SD for a representative experiment of n = 3. (E) 3H famotidine (25 nM) and (F) 3H MPP+ (6 nM) uptake in mTHTR-2 overexpressing cells. Cells were incubated in the uptake buffer containing 3H MPP+ or 3H famotidine for 10 min. Data shown are the mean ± SD for a representative experiment of n = 2.

References

    1. Boyle JG, Salt IP, McKay GA. Metformin Action on AMP-Activated Protein Kinase: a Translational Research Approach to Understanding a Potential New Therapeutic Target. Diabet. Med. 2010;27:1097–1106. - PubMed
    1. Rojas LBA, Gomes MB. Metformin: an Old but Still the Best Treatment for Type 2 Diabetes. Diabetol. Metab. Syndr. 2013;5:6. - PMC - PubMed
    1. Tock L, Dâmaso AR, de Piano A, Carnier J, Sanches PL, Lederman HM, Ernandes RMY, de Mello MT, Tufik S. Long-Term Effects of Metformin and Lifestyle Modification on Nonalcoholic Fatty Liver Disease Obese Adolescents. J. Obes. 2010 DOI: 10.1155/2010/831901. - DOI - PMC - PubMed
    1. Graham GG, Punt J, Arora M, Day RO, Doogue MP, Duong JK, Furlong TJ, Greenfield JR, Greenup LC, Kirkpatrick CM, Ray JE, Timmins P, Williams KM. Clinical Pharmacokinetics of Metformin. Clin. Pharmacokinet. 2011;50:81–98. - PubMed
    1. Jonker JW, Wagenaar E, Mol CA, Buitelaar M, Koepsell H, Smit JW, Schinkel AH. Reduced Hepatic Uptake and Intestinal Excretion of Organic Cations in Mice with a Targeted Disruption of the Organic Cation Transporter 1 (Oct1 [Slc22a1]) Gene. Mol. Cell. Biol. 2001;21:5471–5477. - PMC - PubMed

Publication types