Observational Study
. 2015 Nov 3;12(11):e1001898; discussion e1001898.
doi: 10.1371/journal.pmed.1001898. eCollection 2015 Nov.

Dispersion of the HIV-1 Epidemic in Men Who Have Sex with Men in the Netherlands: A Combined Mathematical Model and Phylogenetic Analysis

Collaborators, Affiliations
Observational Study

Dispersion of the HIV-1 Epidemic in Men Who Have Sex with Men in the Netherlands: A Combined Mathematical Model and Phylogenetic Analysis

Daniela Bezemer et al. PLoS Med. .

Abstract

Background: The HIV-1 subtype B epidemic amongst men who have sex with men (MSM) is resurgent in many countries despite the widespread use of effective combination antiretroviral therapy (cART). In this combined mathematical and phylogenetic study of observational data, we aimed to find out the extent to which the resurgent epidemic is the result of newly introduced strains or of growth of already circulating strains.

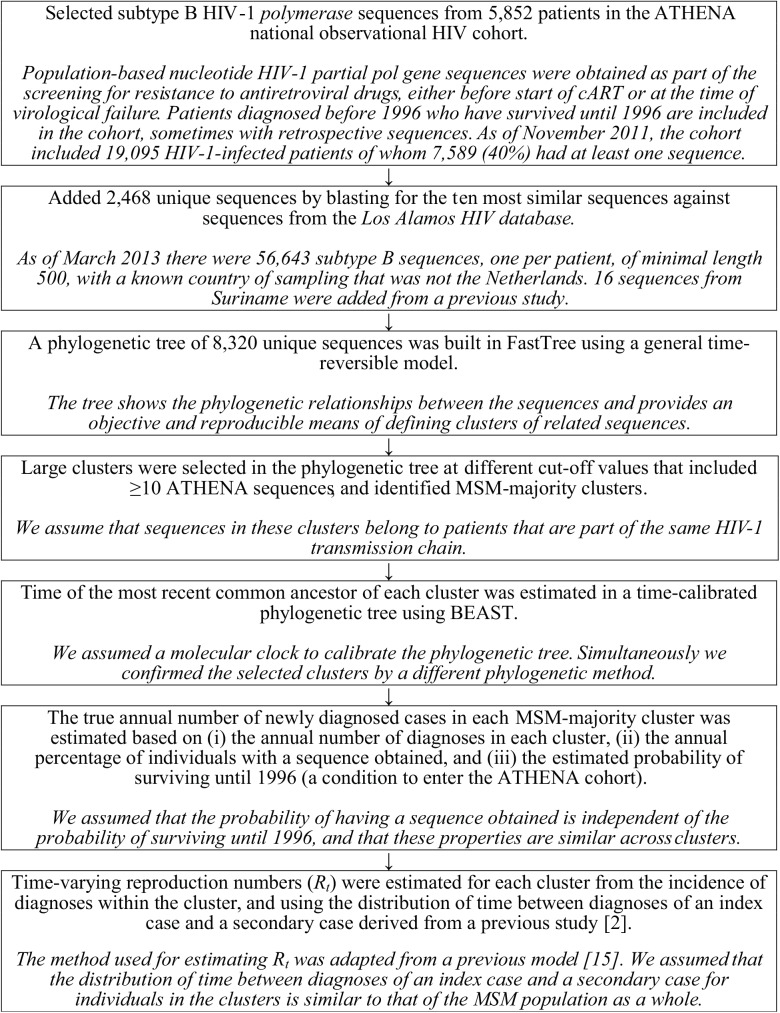
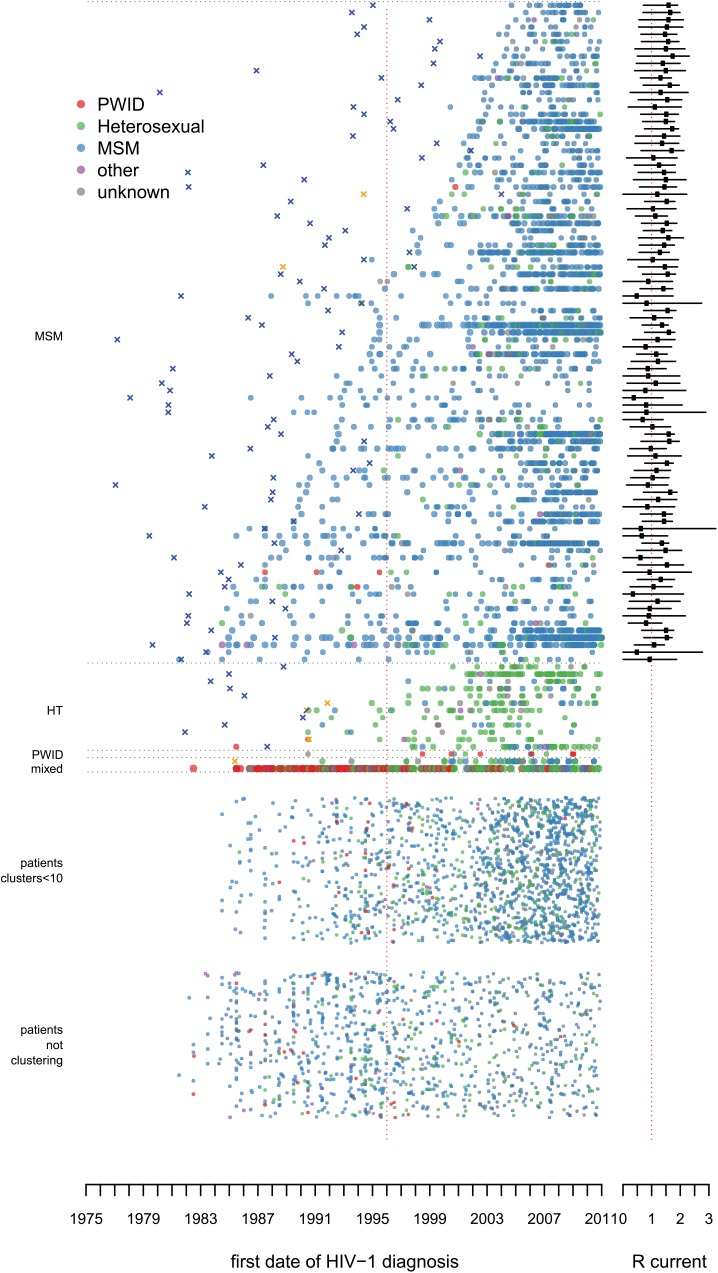
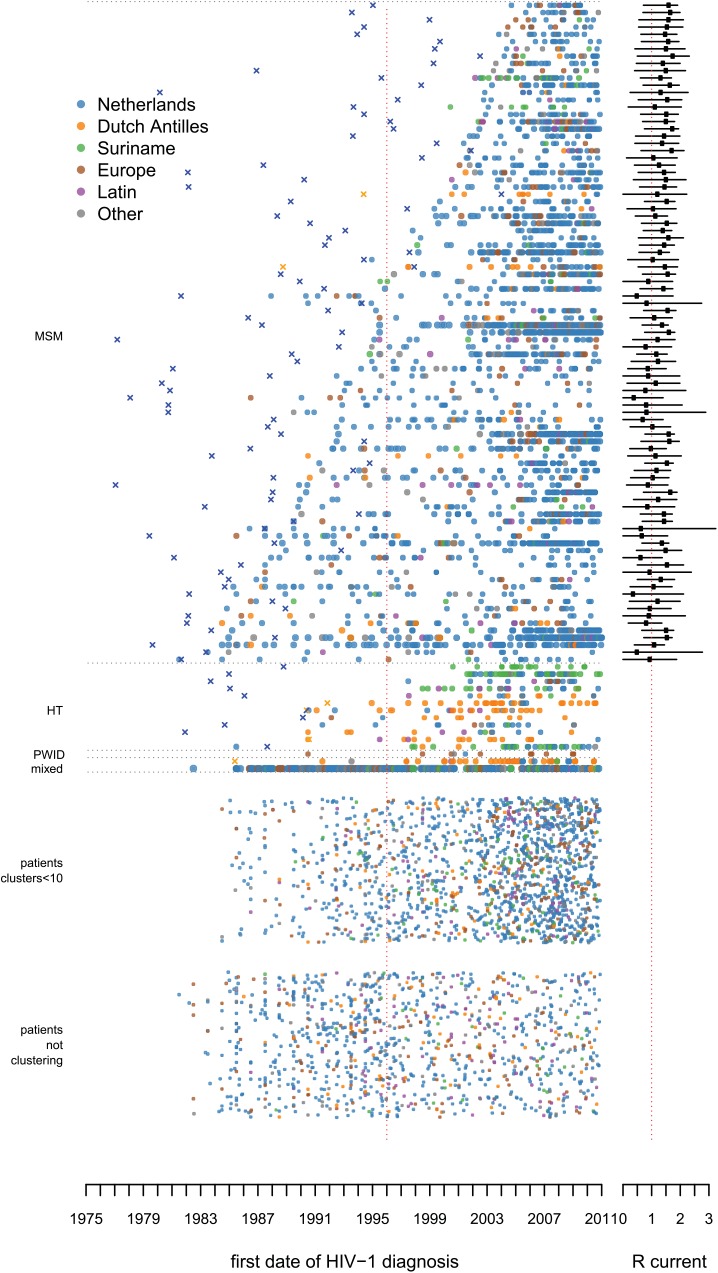
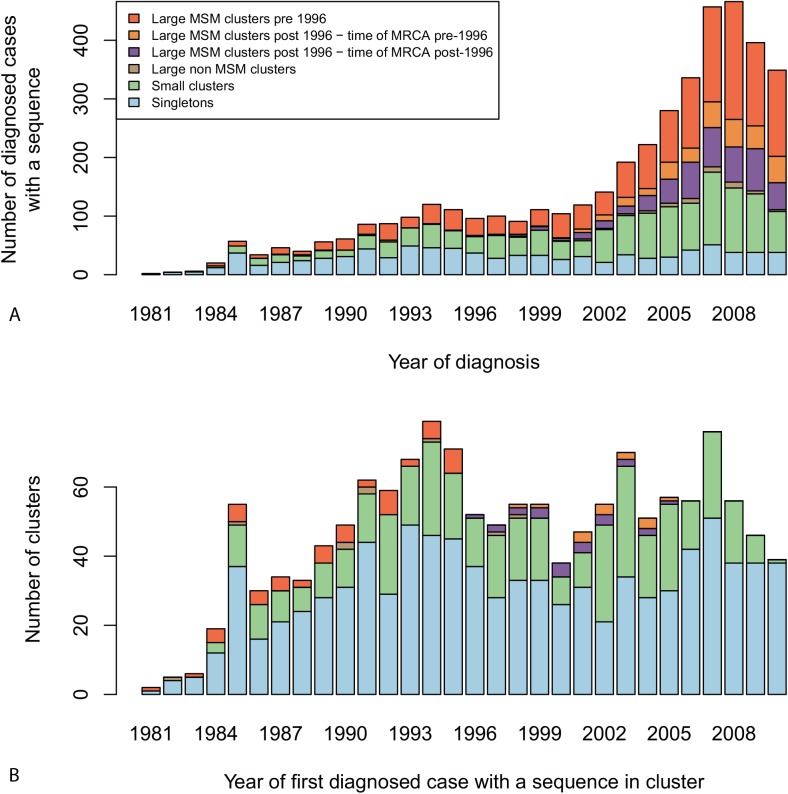
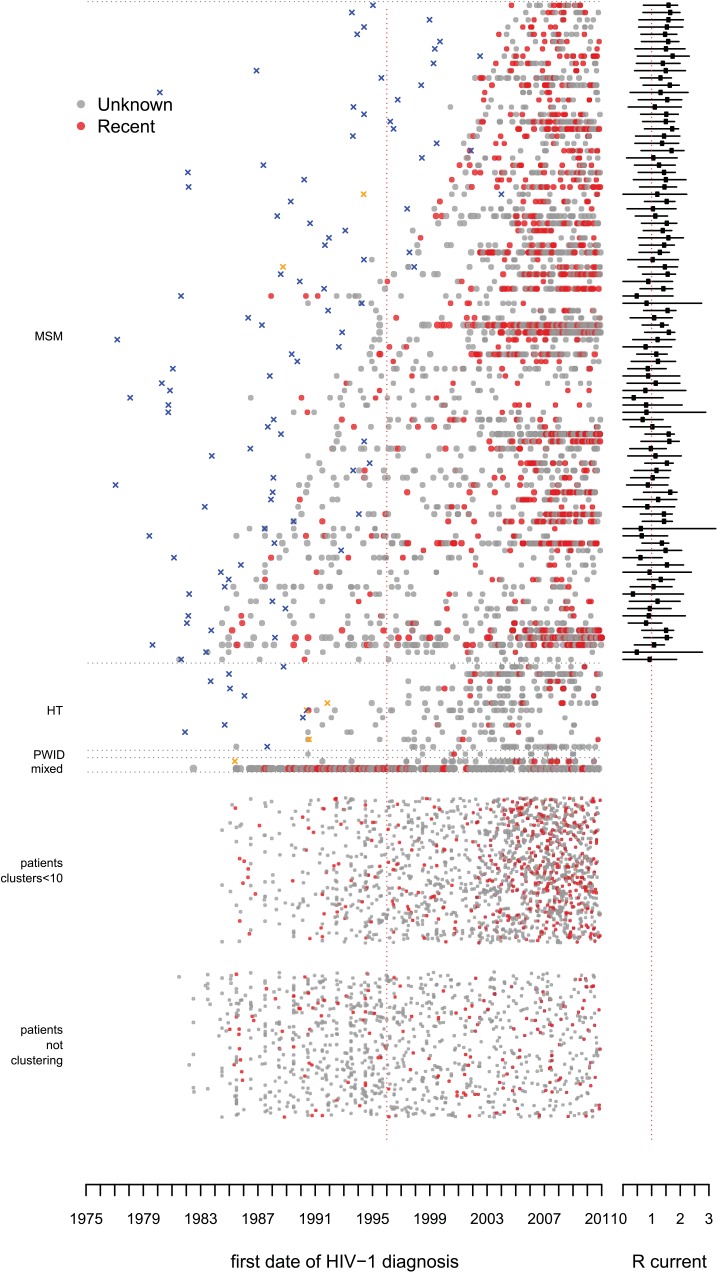
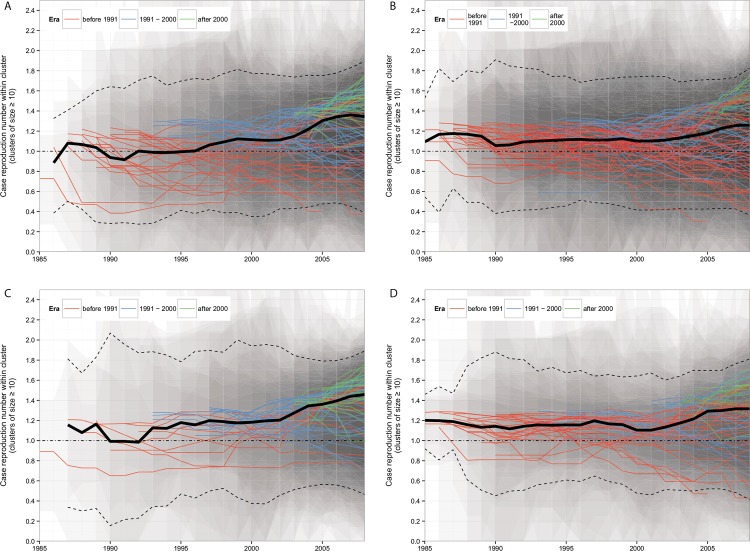
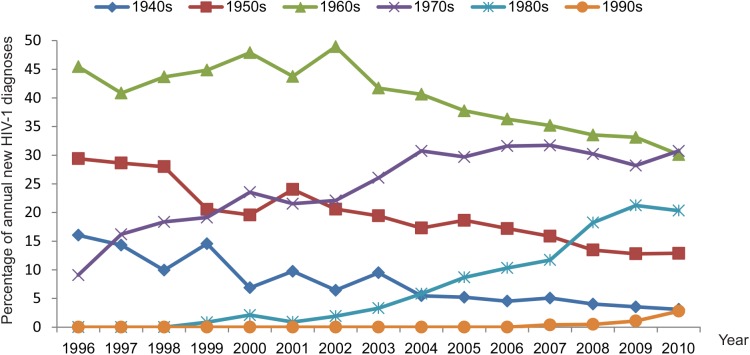
Methods and findings: As of November 2011, the ATHENA observational HIV cohort of all patients in care in the Netherlands since 1996 included HIV-1 subtype B polymerase sequences from 5,852 patients. Patients who were diagnosed between 1981 and 1995 were included in the cohort if they were still alive in 1996. The ten most similar sequences to each ATHENA sequence were selected from the Los Alamos HIV Sequence Database, and a phylogenetic tree was created of a total of 8,320 sequences. Large transmission clusters that included ≥10 ATHENA sequences were selected, with a local support value ≥ 0.9 and median pairwise patristic distance below the fifth percentile of distances in the whole tree. Time-varying reproduction numbers of the large MSM-majority clusters were estimated through mathematical modeling. We identified 106 large transmission clusters, including 3,061 (52%) ATHENA and 652 Los Alamos sequences. Half of the HIV sequences from MSM registered in the cohort in the Netherlands (2,128 of 4,288) were included in 91 large MSM-majority clusters. Strikingly, at least 54 (59%) of these 91 MSM-majority clusters were already circulating before 1996, when cART was introduced, and have persisted to the present. Overall, 1,226 (35%) of the 3,460 diagnoses among MSM since 1996 were found in these 54 long-standing clusters. The reproduction numbers of all large MSM-majority clusters were around the epidemic threshold value of one over the whole study period. A tendency towards higher numbers was visible in recent years, especially in the more recently introduced clusters. The mean age of MSM at diagnosis increased by 0.45 years/year within clusters, but new clusters appeared with lower mean age. Major strengths of this study are the high proportion of HIV-positive MSM with a sequence in this study and the combined application of phylogenetic and modeling approaches. Main limitations are the assumption that the sampled population is representative of the overall HIV-positive population and the assumption that the diagnosis interval distribution is similar between clusters.

Conclusions: The resurgent HIV epidemic amongst MSM in the Netherlands is driven by several large, persistent, self-sustaining, and, in many cases, growing sub-epidemics shifting towards new generations of MSM. Many of the sub-epidemics have been present since the early epidemic, to which new sub-epidemics are being added.


Conflict of interest statement

The authors have declared that no competing interests exist.

Figures

Fig 1
Fig 1. Flow diagram describing the methods and underlying assumptions.
Fig 2
Fig 2. Large transmission clusters over time: risk group of infection.
The picture illustrates the distribution of 106 large transmission clusters, where every horizontal line of dots represents one cluster, and each dot represents a single patient in the cluster by the year of diagnosis. The dots in a cluster represent in total 52% (3,061) of 5,852 ATHENA patients with a HIV-1 subtype B pol sequence in this study. The clusters are ordered by majority risk group and by the number of years between the first and last patient identified within each particular cluster. The color of each dot represents the self-reported risk group of infection. X’s indicate the estimated time of the MRCA, in orange for Curaçao. Some discrepancies may arise as the earliest cases sometimes are included with a sequence many years after their year of diagnosis. On the right-hand side the estimated mean reproduction number over the last 5 y is indicated. At the bottom of the figure, patients are represented who could not be identified as belonging to a cluster. The group above this one shows those patients who belonged to clusters in the phylogenetic tree with fewer than 10 ATHENA sequences included, which were not regarded as large clusters according to our definition. S8 Fig shows the same figure with also these smaller clusters stratified by duration. HT, heterosexual transmission.
Fig 3
Fig 3. Large transmission clusters over time: region of origin.
As in Fig 2, but here the color of each dot represents the region of origin. In large MSM-majority clusters 79% (1,673) of MSM were of Dutch origin. HT, heterosexual transmission.
Fig 4
Fig 4. Diagnosis and growth of transmission clusters over time.
Cluster types within the phylogenetic tree are defined as follows. Singletons (in blue) are clusters of size 1, or cases whose sequence solely clustered with sequences from the Los Alamos HIV Sequence Database. Small clusters (in green) comprise sequences from 2–9 ATHENA patients. Large clusters comprise sequences from ten or more patients in the ATHENA cohort. Amongst those, non-MSM-dominant clusters (in brown) contain a majority of sequences from non-MSM patients, whilst MSM-majority clusters contain a majority of sequences from MSM patients. Among large MSM-majority clusters, pre-1996 clusters (in dark orange) are defined as those in which the first diagnosed patient in the cluster was diagnosed before 1996, and post-1996 clusters are defined as those in which all patients in the cluster were diagnosed in or after 1996. Large MSM-majority post-1996 clusters are stratified as “time of MRCA pre-1996” (in light orange) when the estimated time of the MRCA is before 1996, and “time of MRCA post-1996” (in purple) when the estimated time of the MRCA is in or after 1996. (A) Number of MSM registered in the ATHENA cohort in the Netherlands with a sequence in this study by year of diagnosis and by cluster type. (B) Number of clusters of each type by year of first diagnosed case in each cluster.
Fig 5
Fig 5. Large transmission clusters over time: recent infections.
As in Fig 2, but here red dots represent patients with a documented recent infection. HT, heterosexual transmission.
Fig 6
Fig 6. Estimated case reproduction number over time for all MSM-majority transmission clusters of ≥10 cases.
The solid lines show the mean R t estimate for each transmission cluster. The bold black line is the mean R t of all clusters, with the 95% confidence interval shown by the dotted lines. The shaded areas show the 95% confidence intervals for each transmission cluster: darker areas indicate overlapping intervals across different transmission clusters. Transmission clusters are shown in red if their first sequence appeared before 1991, in blue if their first sequence appeared between 1991 and 2000, and in green if their first diagnosed case appeared after 2000. The black horizontal dotted line represents the threshold value R t = 1. (A) Main analysis. (B) Sensitivity analysis for a looser cluster definition. (C) Sensitivity analysis for a more stringent cluster definition. (D) Sensitivity analysis for the clusters defined under a single linkage branch length threshold.
Fig 7
Fig 7. Proportional contribution of new HIV-1 diagnoses amongst all MSM in the ATHENA cohort by decade of birth.

References

    1. Bezemer D, de Wolf F, Boerlijst MC, van Sighem A, Hollingsworth TD, et al. (2008) A resurgent HIV-1 epidemic among men who have sex with men in the era of potent antiretroviral therapy. AIDS 22: 1071–1077. 10.1097/QAD.0b013e3282fd167c - DOI - PubMed
    1. Bezemer D, de Wolf F, Boerlijst MC, vanSighem A, Hollingsworth TD, et al. (2010) 27 years of the HIV epidemic amongst men having sex with men in the Netherlands: an in depth mathematical model-based analysis. Epidemics 2: 66–79. 10.1016/j.epidem.2010.04.001 - DOI - PubMed
    1. van Sighem A, Vidondo B, Glass TR, Bucher HC, Vernazza P, et al. (2012) Resurgence of HIV infection among men who have sex with men in Switzerland: mathematical modelling study. PLoS ONE 7: e44819 10.1371/journal.pone.0044819 - DOI - PMC - PubMed
    1. Sullivan PS, Hamouda O, Delpech V, Geduld JE, Prejean J, et al. (2009) Reemergence of the HIV epidemic among men who have sex with men in North America, Western Europe, and Australia, 1996–2005. Ann Epidemiol 19: 423–431. 10.1016/j.annepidem.2009.03.004 - DOI - PubMed
    1. Phillips AN, Cambiano V, Nakagawa F, Brown AE, Lampe F, et al. (2013) Increased HIV incidence in men who have sex with men despite high levels of ART-induced viral suppression: analysis of an extensively documented epidemic. PLoS ONE 8: e55312 10.1371/journal.pone.0055312 - DOI - PMC - PubMed

Publication types