. 2015 Nov;27(11):3175-89.
doi: 10.1105/tpc.15.00585. Epub 2015 Nov 3.

Plants Release Precursors of Histone Deacetylase Inhibitors to Suppress Growth of Competitors

Affiliations

Plants Release Precursors of Histone Deacetylase Inhibitors to Suppress Growth of Competitors

Sascha Venturelli et al. Plant Cell. 2015 Nov.

Abstract

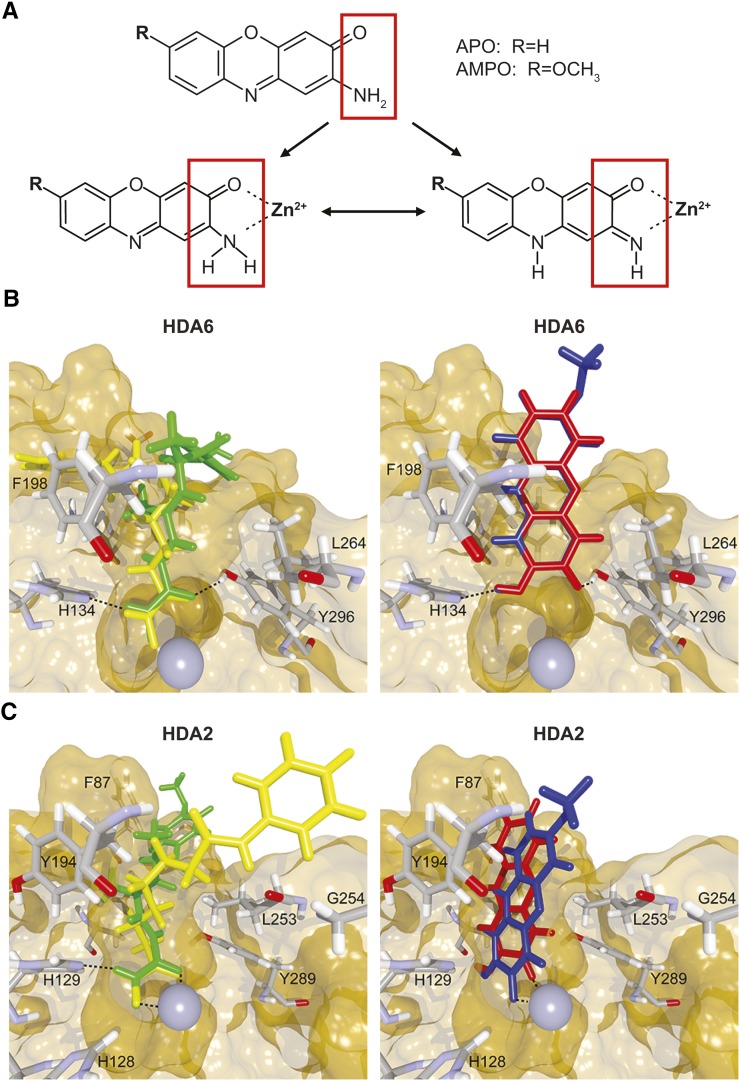
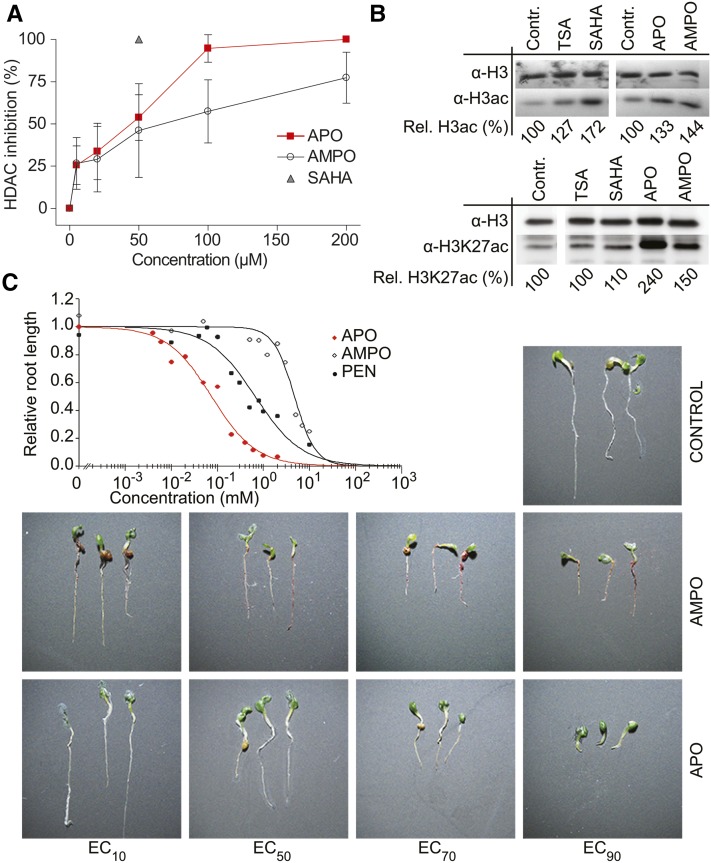
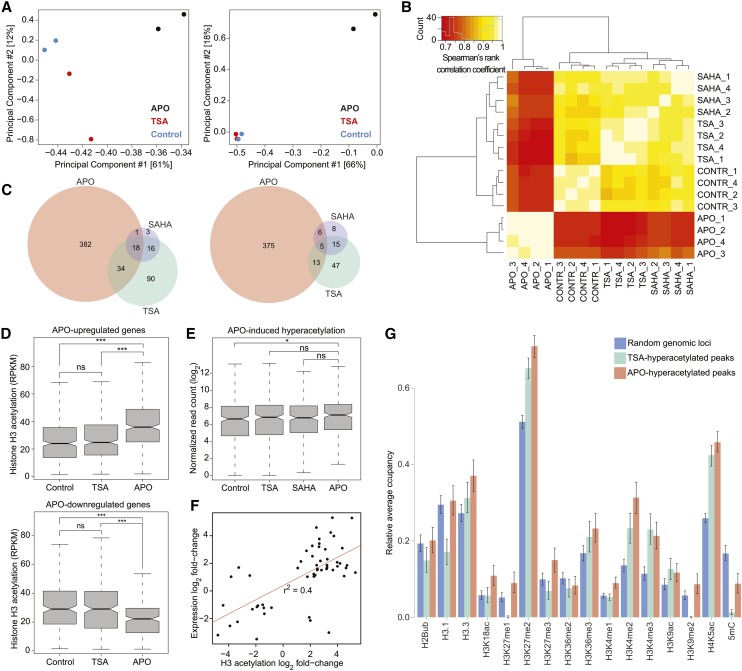
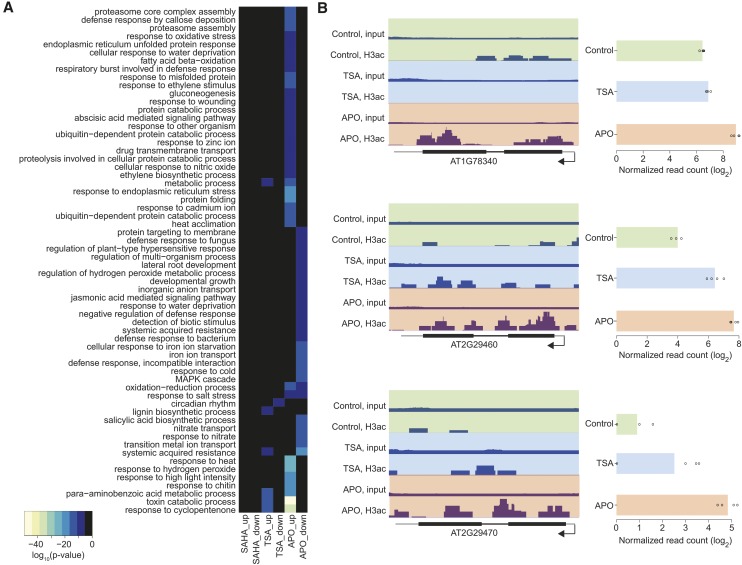
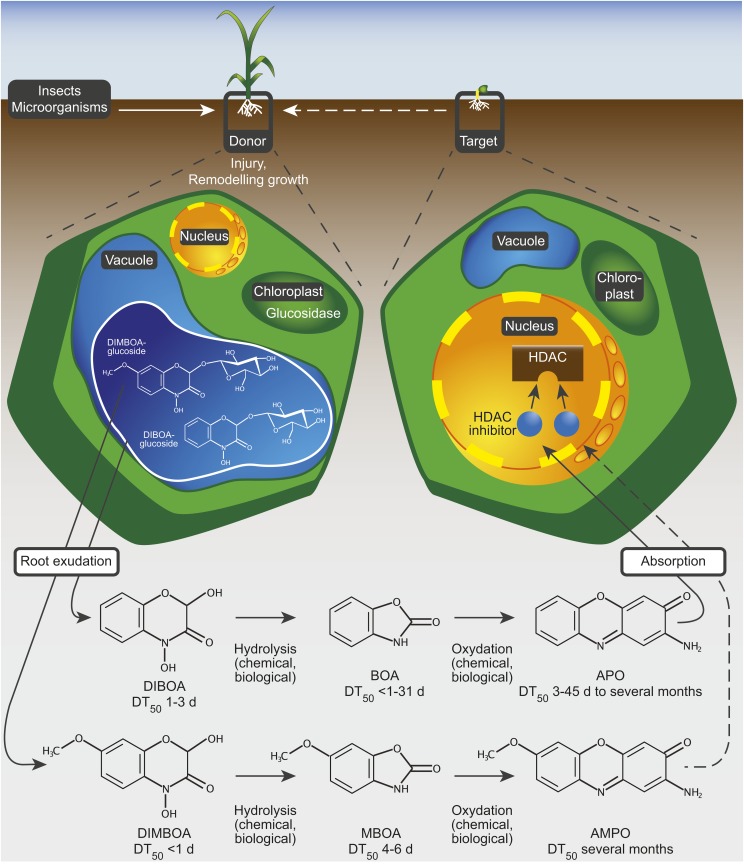
To secure their access to water, light, and nutrients, many plant species have developed allelopathic strategies to suppress competitors. To this end, they release into the rhizosphere phytotoxic substances that inhibit the germination and growth of neighbors. Despite the importance of allelopathy in shaping natural plant communities and for agricultural production, the underlying molecular mechanisms are largely unknown. Here, we report that allelochemicals derived from the common class of cyclic hydroxamic acid root exudates directly affect the chromatin-modifying machinery in Arabidopsis thaliana. These allelochemicals inhibit histone deacetylases both in vitro and in vivo and exert their activity through locus-specific alterations of histone acetylation and associated gene expression. Our multilevel analysis collectively shows how plant-plant interactions interfere with a fundamental cellular process, histone acetylation, by targeting an evolutionarily highly conserved class of enzymes.


Figures

Figure 1.
Figure 1.
Binding of APO and AMPO to Arabidopsis HDACs. (A) Chemical structure of the cyclic-hydroxamic-acid-derived allelochemicals APO and AMPO. Both substances have the capacity to coordinate a zinc ion in a bidentate fashion. (B) and (C) Simulated docking of TSA (green), SAHA (yellow), APO (red), and AMPO (blue) to the binding pocket of Arabidopsis HDA6 (B) and HDA2 (C) (surface representation), with crystal structure reference coordinates of TSA (atom colors). Residues with predicted interactions with the ligands are shown in stick representation; the zinc ion of the HDAC is shown as a gray sphere. Figures were rendered with BALLView and POVRay (v3.6).
Figure 2.
Figure 2.
HDAC and Growth Inhibition by Allelochemicals. (A) HDAC inhibition by APO and AMPO in Arabidopsis nuclear extracts. SAHA (50 µM) was used as reference inhibitor. Data points represent mean values ± sd of three independent experiments performed in duplicate. (B) Immunoblot showing acetylation of histone H3 (α-H3ac) and of lysine 27 acetylation of histone H3 (α-H3K27ac). Seedlings were treated for 24 h with EC50 concentrations of APO, AMPO, SAHA, or TSA 5 d after germination; upper row shows equal protein loading (histone protein H3) on a parallel blot. Relative amounts of acetylated histone were estimated by densitometric analysis; values are relative to the respective untreated control. (C) Concentration-response assays on root growth in seedlings. The commercially available herbicide PEN was used as a positive control. Root length was measured 6 d after sowing (≥0.1 mm minimum root length), and concentration-response curves were calculated using a logistic regression model. The quality of curve fitting was verified by F test for lack-of-fit based on ANOVAs (α = 0.05). Right panel: visualization of the concentration-dependent growth inhibitory effect of APO and AMPO on seedlings 6 d after sowing.
Figure 3.
Figure 3.
Locus-Specific Effect of APO on Histone Acetylation and Gene Expression. (A) Principal component analyses of histone acetylation on all identified acetylated genomic regions (left panel) and on peaks identified as differentially acetylated between APO- and non-APO-treated samples (right panel) using the DESeq2 implementation of the DiffBind package. Variation explained by the respective principal component is given in brackets. (B) Bihierarchical clustering of normalized read counts at differentially expressed genes. Numbers 1 to 4 indicate biological replicates. (C) Venn diagrams showing the overlap of upregulated (left) and downregulated (right) genes after 24-h treatment with EC50 concentrations of APO, TSA, and SAHA. (D) H3 acetylation in control-, TSA-, and APO-treated samples at peaks overlapping with APO-upregulated (upper panel) and APO-downregulated genes (lower panel). RPKM, reads per kilobase per million; ns, not significant; asterisks, significant difference in acetylation compared with control treatment: *P < 0.05 and ***P < 0.001, unpaired two-tailed Student’s t test. (E) Expression in control-, TSA-, and APO-treated samples of genes with hyperacetylated H3 levels in response to APO treatment (*P < 0.05, unpaired two-tailed Student’s t test; ns, not significant). (F) Correlation between H3ac level changes and gene expression changes at loci that had both differential histone acetylation levels and were differentially expressed in a comparison of control and APO-treated samples. Red line represents linear regression. (G) Chromatin landscape in Arabidopsis Col-0 according to Wang et al. (2015), at randomly chosen genomic loci and at loci hyperacetylated by APO or TSA. Relative occupancy was calculated as the fraction of hyperacetylated regions covered by the respective mark. Bars represent the mean; errors indicate 95% confidence intervals.
Figure 4.
Figure 4.
APO Affects Genes Related to Detoxification and Stress Response. (A) Overrepresented biological functions of genes induced or repressed by HDAC inhibitor treatment. Heat map shows P values of GO terms that were significantly overrepresented (P < 0.05) in at least one treatment. Black color indicates that the respective GO term was not significantly overrepresented after the corresponding treatment. (B) Left panel: H3 acetylation, represented by dark-blue stacks, at genomic loci corresponding to three differentially expressed glutathione S-transferase genes. Thick and thin black horizontal bars represent exons and introns, respectively, gray horizontal bars represent UTRs; arrows indicate direction of transcription. Track height was adjusted to the maximum value for each locus. Right panel shows the expression of the same genes. Bars represent the mean across four replicates; points indicate individual values.
Figure 5.
Figure 5.
Model of a Chromatin-Based Mode of Action of the Allelochemicals APO and AMPO. A donor plant exudes DIBOA and/or DIMBOA into the rhizosphere as a consequence of injury, plant age, or target plant interaction. These two unstable cyclic hydroxamic acids diffuse as parent compounds from the roots of the donor plant into the surrounding rhizosphere and are rapidly converted into the intermediates BOA and MBOA. Both intermediates are further converted into the more stable compounds APO and AMPO, which are absorbed by the target plant. APO and AMPO broadly inhibit HDAC enzymes and thereby modify the chromatin pattern of target cells, which profoundly affects plants in an early developmental stage. DT50, dissipation time 50%, according to Macías et al. (2004, 2005) and Understrup et al. (2005).

References

    1. Anders S., Huber W. (2010). Differential expression analysis for sequence count data. Genome Biol. 11: R106. - PMC - PubMed
    1. Anzai K., Isono K., Okuma K., Suzuki S. (1960). The new antibiotics, questiomycins A and B. J. Antibiot. 13: 125–132. - PubMed
    1. Aufsatz W., Mette M.F., van der Winden J., Matzke M., Matzke A.J. (2002). HDA6, a putative histone deacetylase needed to enhance DNA methylation induced by double-stranded RNA. EMBO J. 21: 6832–6841. - PMC - PubMed
    1. Baerson S.R., Sánchez-Moreiras A., Pedrol-Bonjoch N., Schulz M., Kagan I.A., Agarwal A.K., Reigosa M.J., Duke S.O. (2005). Detoxification and transcriptome response in Arabidopsis seedlings exposed to the allelochemical benzoxazolin-2(3H)-one. J. Biol. Chem. 280: 21867–21881. - PubMed
    1. Bailey T., Krajewski P., Ladunga I., Lefebvre C., Li Q., Liu T., Madrigal P., Taslim C., Zhang J. (2013). Practical guidelines for the comprehensive analysis of ChIP-seq data. PLOS Comput. Biol. 9: e1003326. - PMC - PubMed

Publication types

MeSH terms