. 2015 Nov 4:16:354.
doi: 10.1186/s12859-015-0800-0.

tDRmapper: challenges and solutions to mapping, naming, and quantifying tRNA-derived RNAs from human small RNA-sequencing data

Affiliations

tDRmapper: challenges and solutions to mapping, naming, and quantifying tRNA-derived RNAs from human small RNA-sequencing data

Sara R Selitsky et al. BMC Bioinformatics. .

Abstract

Background: Small RNA-sequencing has revealed the diversity and high abundance of small RNAs derived from tRNAs, referred to as tRNA-derived RNAs. However, at present, there is no standardized nomenclature and there are no methods for accurate annotation and quantification of these small RNAs. tRNA-derived RNAs have unique features that limit the utility of conventional alignment tools and quantification methods.

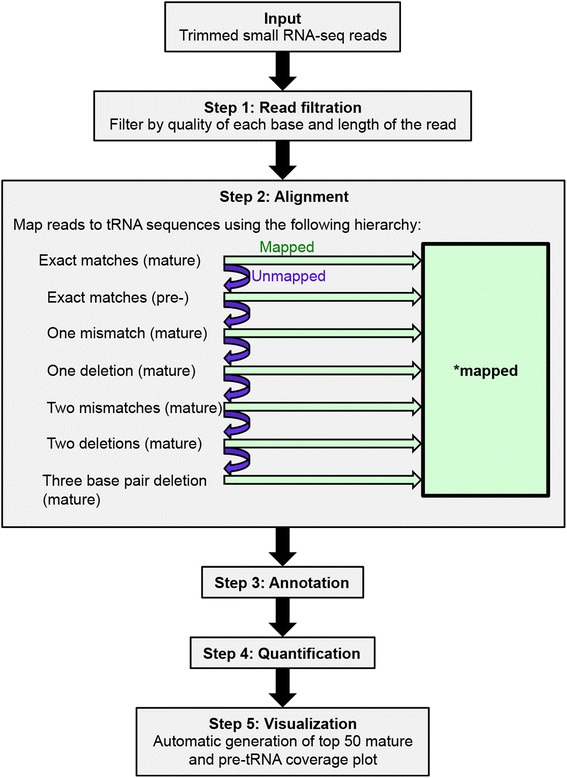
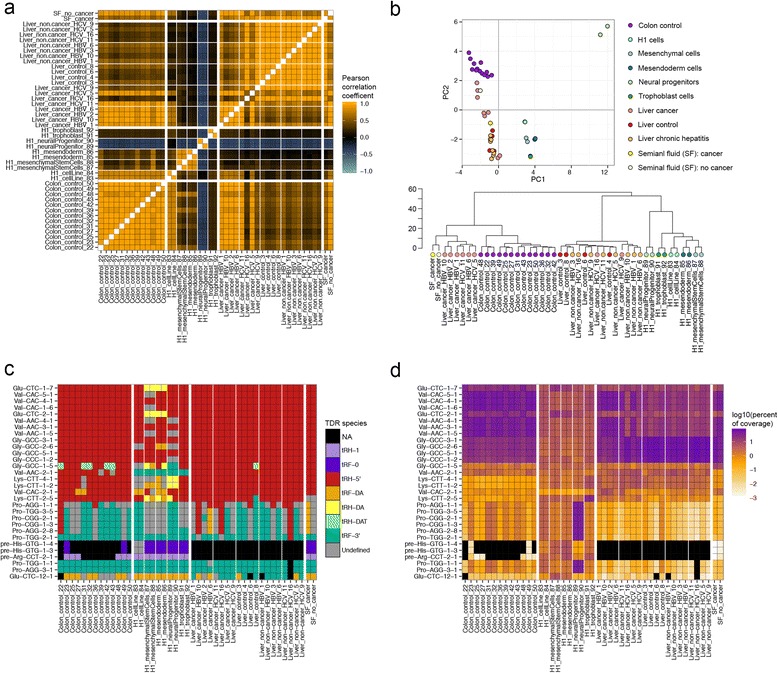
Results: We describe here the challenges of mapping, naming, and quantifying tRNA-derived RNAs and present a novel method that addresses them, called tDRmapper. We then use tDRmapper to perform a comparative analysis of tRNA-derived RNA profiles across different human cell types and diseases. We found that (1) tRNA-derived RNA profiles can differ dramatically across different cell types and disease states, (2) that positions and types of chemical modifications of tRNA-derived RNAs vary by cell type and disease, and (3) that entirely different tRNA-derived RNA species can be produced from the same parental tRNA depending on the cell type.

Conclusion: tDRmappernot only provides a standardized nomenclature and quantification scheme, but also includes graphical visualization that facilitates the discovery of novel tRNA and tRNA-derived RNA biology.


Figures

Fig. 1
Fig. 1
Relative abundance of all tRNA-derived RNAs across four categories of human cell types/tissues. Proportion of trimmed and filtered reads that map to tRNAs in primary colon tissue (control n = 13; Crohn’s disease uninflamed tissue, n = 21; Crohn’s disease inflamed tissue, n = 6), primary liver tissue (control, n = 4; chronic hepatitis B non-cancer tissue, n = 4; chronic hepatitis C non-cancer tissue, n = 4; chronic hepatitis B associated cancer tissue, n = 4; chronic hepatitis C associated cancer tissue, n = 4), the non-sperm fraction of seminal fluid (n = 2), and NIH roadmap H1 and H1-derived cells (H1 cells with no treatment, n = 2; H1-derived trophoblasts, n = 2; H1-derived mesendoderm, n = 2; H1-derived neuronal progenitor cells, n = 2; H1-derived mesenchymal stem cells, n = 2). Black lines show the median and interquartile range
Fig. 2
Fig. 2
Schematic of tDRmapper. The input into tDRmapper is trimmed small RNA-seq reads. (Step 1) Reads are discarded if quality <28 at any position, length <14 or >41, or if the sequence does not occur >100 times in the FASTQ file. (Step 2) Reads are aligned according to a specific “error type hierarchy.” First reads are aligned, allowing for exact matches only to mature tRNA sequences, then reads that do not map are aligned allowing for exact matches to pre-tRNA sequences, and then reads that do not map are aligned allowing for one mismatch, then one deletion, two mismatches, two deletions, and then a three base pair deletion to mature tRNA sequences. (Step 3) tDRs are annotated based on size and location within either pre-tRNA or mature tRNA. (Step 4) tDRs are quantified based on two features, the fraction of reads aligning to the parent tRNA and the maximum coverage across all positions of the tRNA. (Step 5) tDRs are visualized as color-coded coverage maps
Fig. 3
Fig. 3
Proportion of “error types” for specific tRNA-derived RNAs across different tissues and diseases. a-d Relative proportion of “error types” of reads mapping to a all tRNAs, b tRNA-Glu-CTC-1-7, c tRNA-Pro-CGG-1-3, d tRNA-Gly-GCC-1-5
Fig. 4
Fig. 4
Diagrammatic representation of the naming scheme for tRNA-derived RNAs. a & b Left panel: color-coded structure of tRNAs to illustrate how tDRs are named. Colors in panel correspond to coverage maps in right panel. Right panel: Example tDRs identified in the datasets analyzed are shown. Size of dot represents percent of reads mapping at each position within each tRNA shown. a Naming scheme of tDRs derived from mature tRNAs. Numbers correspond to the “generalized” start and stop positions for each loop. Purple represents the D-loop, “D”; green represents the anti-codon loop, “A”; dark green represents anti-codon triplet; and yellow represents T-loop, “T”. b Naming scheme of tDRs derived from pre-tRNAs. Red represents the leader sequence, “0”; orange represents the sequence of the tRNA body,“B”; and yellow represents the trailer sequence, “1”
Fig. 5
Fig. 5
Examples of mature tRNA coverage maps from each category of human cell types/tissues. a-d Size of dot represents percent of reads mapping at each position within each tRNA. The color represents each individual nucleotide or the anti-codon positions. The dots overlaid in a variety of shapes represent each “error type” and the color of these shapes represents the proportion of each “error type” at each position. Coverage map for (a) primary colon tissue from control subject #31, b the non-sperm fraction of seminal fluid from subjects with prostate cancer, c primary non-cancerous liver tissue from subject #6 with chronic hepatitis B, and d H1-derived neural progenitor cells
Fig. 6
Fig. 6
Example of pre-tRNA coverage maps. a & b Size of dot represents percent of reads mapping at each position within each tRNA. The color represents the location of the pre-tRNA: leader sequence is red, the tRNA body is orange, and the trailer is yellow. Coverage map for (a) H1-derived mesendoderm cells and b primary tissue from the inflamed section of colon tissue from a subject with Crohn’s disease, #413
Fig. 7
Fig. 7
Comparison of tDR profiles across four categories of human cell types/tissues. (A-D) tDR expression profiles for each human cell type/tissue; every tDR that has >5 % relative abundance in any sample is included in the analysis. a Pearson correlation coefficient heat map. Each cell in the map represents the correlation coefficient between tDR expression profiles from different two samples. Cells along the diagonal represent identical samples and are colored in white. Thick white lines divide each category of data sets; thin white lines divide sub-categories of datasets within each category. Midpoint of color change for bar r2 = 0. b Top panel: plot of principle components. Bottom panel: dendogram from hierarchical clustering of all tDR profiles. c Primary tDR species heat map. Each cell represents the dominant tDR species in each sample. d tDR expression heat map. Each cell represents the log10 of the relative tDR abundance of each tDR in each sample

References

    1. Kirchner S, Ignatova Z. Emerging roles of tRNA in adaptive translation, signalling dynamics and disease. Nat Rev Genet. 2015;16:98–112. doi: 10.1038/nrg3861. - DOI - PubMed
    1. Selitsky SR, Baran-Gale J, Honda M, Yamane D, Masaki T, Fannin EE, et al. Small tRNA-derived RNAs are increased and more abundant than microRNAs in chronic hepatitis B and C. Sci Rep. 2015;5:7675. doi:10.1038/srep07675. - PMC - PubMed
    1. Garcia-Silva MR, Cabrera-Cabrera F, Güida MC. Hints of tRNA-Derived Small RNAs Role in RNA Silencing Mechanisms. Genes. 2012;3:603–14. doi: 10.3390/genes3040603. - DOI - PMC - PubMed
    1. Haussecker D, Huang Y, Lau A, Parameswaran P, Fire AZ, Kay MA. Human tRNA-derived small RNAs in the global regulation of RNA silencing. RNA. 2010;16:673–95. doi:papers2://publication/doi/10.1261/rna.2000810. - PMC - PubMed
    1. Goodarzi H, Liu X, Nguyen HC, Zhang S, Fish L, Tavazoie SF. Endogenous tRNA-Derived Fragments Suppress Breast Cancer Progression via YBX1 Displacement. Cell. 2015;161:790–802. doi:10.1016/j.cell.2015.02.053. - PMC - PubMed

Publication types

LinkOut - more resources