. 2016:1371:43-78.
doi: 10.1007/978-1-4939-3139-2_4.

Standardization, Evaluation, and Area-Under-Curve Analysis of Human and Murine Treg Suppressive Function

Affiliations

Standardization, Evaluation, and Area-Under-Curve Analysis of Human and Murine Treg Suppressive Function

Tatiana Akimova et al. Methods Mol Biol. 2016.

Abstract

FOXP3+ T-regulatory (Treg) cells have important roles in immune homeostasis, and alterations in their number and function can predispose to diseases ranging from autoimmunity to allograft rejection and tumor growth. Reliable identification of human Tregs remains a persistent problem due to a lack of specific markers. The most definitive Treg characterization currently involves combined assessment of phenotypic, epigenetic and functional parameters, with the latter typically involving in vitro Treg suppression assays. Unfortunately, suppression assays are frequently performed using differing methods and readouts, limiting comparisons between studies. We provide a perspective on our experience with human and murine Treg suppression assay conditions, including Treg data obtained in clinical transplant studies, Tregs isolated from healthy donors and treated with epigenetically active compounds, and Tregs from standard murine strains (C57BL/6 and BALB/c). We provide detailed descriptions and illustrations of typical problems, shortcomings and troubleshooting; describe new modifications and approaches; and present a new method for calculation of suppressive assay data using a modified area-under-curve (AUC) method. This method allows us to directly compare Treg suppressive function between multiple patients (such as in clinical transplant studies), to reliably track changes in Treg function from the same person over time, or compare effects of Treg-modulating compounds tested with different healthy donors Tregs in separate or combined experimental settings.

Keywords: FOXP3+ regulatory T cells; Suppression assay; Tregs.


Figures
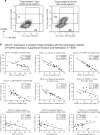
Fig. 1
Fig. 1
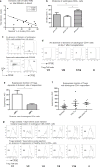
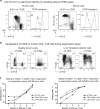
Treg phenotypes after isolation and assays of their suppressive function. (a) Tregs were isolated from the same liver allograft recipient 7 days prior (left) and 3 months after an acute rejection episode (right) and stained for live/dead, CD4, CD25, and FOXP3. Gated CD4+ cells demonstrate comparable CD25+ expression, but very low FOXP3 level in pre-rejection sample. (b) Tregs were isolated from 8 liver allograft recipients pre-transplant, and then at 7–14 days, 3 months, and 1 year post-Tx. Aliquots of isolated Tregs were cryopreserved and stained for live/dead, CD4, CD25, CTLA4, FOXP3, and CD127, while freshly isolated Tregs were used for suppression assays with healthy donor’s responder cells (PBMC). CD127 expression in isolated Tregs shows inverse correlations with many important Treg-associated markers and with suppressive function of these cells
Fig. 2
Fig. 2
Problems with use of autologous responder cells in Treg suppression assays. (a) Bilirubin levels in blood inversely correlated with Teff proliferation. CD4+CD25- Teffs were isolated from the same liver allograft recipients as in Fig. 1b (7–14 days and 3 months post-Tx), and stimulated with autologous CD4-depleted APC and anti-CD3 beads at 3.5/1 beads/Teff cell ratio for 4 days. Data of Teff proliferation was plotted against corresponding total bilirubin levels obtained at the same time point. (b) Allograft recipient CD4+ Teffs demonstrated impaired divisions in comparison with healthy donors cells. CD4+CD25- cells isolated from the same patients as shown at Fig. 1b (pre-Tx or 7–14 days and 3 months post-Tx) were stimulated as in (a), and their rates of division were compared with healthy donor CD4+CD25- Teffs stimulated under the same conditions. ANOVA with Newman-Keuls multiple comparison test was used for comparison. (c) Whole blood sample from a patient listed for lung transplant was shipped overnight at room temperature, and CD4+CD25- cells were isolated and stimulated as in panels (a) and (b). Four days later, Teffs were alive, but showed a lack of proliferation (top). At day 4, CD3/28 beads were added at 1/1 bead/cell ratio, and 4 days later Teffs demonstrated restored proliferation. (d) Treg suppression assay was performed with Tregs from liver transplant allograft recipient, with autologous Teffs and APC, stimulated as in panel (a). Autologous cells, collected 7 days post-Tx, exhibited a lack of proliferation, making evaluation of Tregs suppressive function impossible. (e) Results of autologous suppression assays of healthy donors and liver transplant patient Tregs (pre-Tx) were grouped according to maximal rate of CD4+CD25- divisions. When Teffs had impaired proliferation, corresponding Treg function seemed to be higher. Data were analyzed by Mann-Whitney test. (f) Results of autologous suppression assays of healthy donors and liver transplant patient Tregs (pre-Tx and 3 months post-Tx) were compared. Healthy donor Tregs tended to demonstrate worse suppressive function than patient Tregs, although data did not reach significant p value (Kruskal-Wallis test). (g) Tregs depicted in Fig. 1a on left, demonstrated marginal suppression in assay with autologous (top), but not with healthy donor responders (bottom). For all data, * p < 0.05 and ** p < 0.001
Fig. 3
Fig. 3
Use of different combinations of autologous or allogeneic responders to evaluate Treg function (a) Tregs shown in Fig. 1a (right) demonstrated suppressive function with healthy donor responders (top). Combination of pre-rejection autologous Teffs (middle) or pre-rejection autologous Teffs and APC (bottom) showed that pre-rejection APC provided better co-stimulation for Teffs and some resistance to Treg suppression in comparison with 3 months post-Tx APC. (b) Combination of 3 months post-Tx Tregs either with autologous responders collected the same time (top) or pre-Tx. Pre-Tx Teffs demonstrate better divisions (second row), pre-Tx APC confer increased resistance of Teffs to Treg suppress ion (third row), and combination of both pre-Tx respond-ers (Teffs and APC) demonstrate sufficiently enhanced Teff cell proliferation, as well as increased resistance to Tregs (bottom row)
Fig. 4
Fig. 4
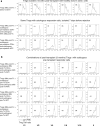
Factors affecting standardization of Treg suppression assays. (a) Tregs isolated at 3 months post-Tx from a liver allograft recipient demonstrated some suppression with healthy donor’s responders when stimulated with current aliquot of anti-CD3 beads (top), but a new aliquot of anti-CD3 beads used in the same 3.5/1 ratio, clearly over-stimulated responder cells, which led to extinction of Treg suppressive function (bottom). (b) PBMC from the same healthy donor, collected with 1-year period, demonstrate differences in their divisions. Both PBMC samples were cryopreserved and used within the same experiment. (c) Selection of the best responder cells for human Treg suppression assay. While use of both #339 and #345 responders demonstrate that #341 Tregs have better suppressive function than #339 Tregs, responder cells with larger range between 1/1 and 0 Tregs ratios (top two rows, #339 responder) provide better sensitivity to discriminate Treg function. (d). Impaired function of human Treg function after cryopreservation. While cryopreserved human Tregs were viable and had no evident changes in their phenotype when evaluated by flow cytometry after thawing, they demonstrated impaired suppressive function
Fig. 5
Fig. 5
Use of Treg suppression assay to evaluate compounds suggested to affect Treg function. Murine Tregs (a) or Teffs (b) were preincubated with a chemically active compound isolated from Australian pigweed plant, or with control inactive compound, for 2 h, washed twice and tested in a Treg suppression assay. In preliminary experiments, 400 nM of compound did not show any evident toxic effects during 3 days of culture of murine splenocytes. While data show impaired Treg suppression (a), additional data (b) demonstrated impaired division of pretreated CD4+CD25- Teffs, suggesting the effect of the compound is not specific for Tregs. Each experiment was performed twice with different concentrations of compounds and similar results. (c) Human Tregs, CD4+CD25- Teffs and CD3-depleted irradiated APC were incubated with different concentrations of SAHA for 4 days. As the concentrations of SAHA used directly inhibited Teff division, a finding of enhanced Treg function due to SAHA treatment cannot be distinguished from direct inhibitory effect of SAHA on responder cells, and therefore no reliable conclusions can be derived from such experiments
Fig. 6
Fig. 6
Different approaches to the analysis of Treg suppression assay data. (a) Human (top) and murine (bottom) Treg division in mixed cell populations consisting of PBMC (top) or splenocytes (bottom). Cells were stimulated with CD3, without addition of IL-2. Percent of dividing cells is shown. (b) Human Treg division in 4 day suppression assays, 1/1 ratio. Tregs with stable FOXP3+ phenotype upregulated Ki-67 better than Tregs that lost FOXP3. (c) Differences in cell division when live cells were gated according to FS-SS properties (black histograms), or when FS-SS gating was complemented with live/dead staining (grey histograms). Differences in CFSE mean fluorescence (d) or in percent of dividing cells (e) of the same cells after 20 min of light exposure of murine cells in Treg suppression assay
Fig. 7
Fig. 7
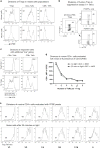
Readout of CFSE- based suppression assay. (a) Co-staining with Ki-67 helps to locate the first CFSE peak of nondividing cells in human (left) or murine (right) suppression assays. (b) In human suppression assays, Teffs cells that upregulated CD2 5 are better dividers than CD25- cells. Healthy donor (left) or pediatric liver allograft patients (middle and right) Tregs were used in suppression assays with autologous CD4+CD25- Teffs (left) or with healthy donor PBMC (middle and right) as responders cells. 4 days later, cells were stained for CD4 and CD25, and CD25+ cells were plotted vs. CFSE in CD4+ gated cells. Tregs are located on left two quadrants of each dot plot. (c) In murine Treg suppression assays using cells from C57BL/6 mice, CD4+CD25+ responder cells demonstrate better divisions than CD25- Teffs (left), while using cells from BALB/c mice, cells with upregulated CD25 proliferated less than CD4+CD25- Teffs (right). Each murine experiment was performed twice with the same results
Fig. 8
Fig. 8
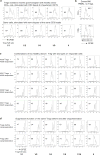
Calculation of standardized suppression and AUC for Treg assays in clinical Treg studies. (a) Raw data showing CD4+ Teff proliferation in four autologous suppression assays, performed with samples from the same liver allograft recipient. Cells were isolated preoperative (Pre-op), and at 7 days, 3 months, and 1 year post-Tx. (b) Standardized suppression (S) was calculated using S=((divisions without Tregs -divisions in current ratio)/divisions without Tregs) × 100. (c) Two areas under the standardized suppression curves, as in (b), are shaded for illustrative purposes. Corresponding AUC values are shown in graph legend on right. (d) Suppressive function of four Treg samples for autologous CD4+ responders, calculated as AUCs
Fig. 9
Fig. 9
Calculation of standardized suppression and AUC for Treg assays with epigenetic compounds. Healthy donor CD4+CD25+ Tregs, CD4+CD25- Teffs, and CD4-depleted irradiated APC were used in a suppression assay with different concentrations of valproic acid (HDACi), RG108 (DNMTi), and SAHA (HDACi). Then, one concentration of each compound, which demonstrated no direct inhibitory effect of given compound on Teff divisions, was chosen for following calculations. (a) Raw data show division of CD4+ Teffs at corresponding Treg/Teff ratios. Data are plotted as number of Teffs per (one) Treg vs. corresponding division of CD4+ Teffs. Table 3, Step 1 shows the same data as % of dividing CD4+ Teffs. (b) Within this experiment, the lowest and the highest divisions (bolded in Table 3, Steps 1 and 2) were used to define 0 and 100 % for percentage normalization. A screenshot of the dialog box from GraphPad Prism with corresponding data is shown. (c) Data from Table 3, Step 3, are plotted. Normalized suppression data were transformed using formula: Yt = 100 – Y, where Yt is transformed normalized suppression, and Y is normalized division. Y values show normalized and transformed suppression. All values in ratios without Tregs were excluded from further AUC calculations. (d) Treg suppressive function, calculated in AUCs units, is shown. All compounds clearly enhance Treg suppressive function. (e) The same data as (d) were re-calculated with control Treg suppressive function as denominator. As a result, data shown fold increase of Treg suppressive function for each compound vs. control (which is 1). These data may be further grouped with results of similar suppression assays with other Tregs and responders, to compare means of enhanced Treg function and p value for differences

References

    1. Sakaguchi S, Sakaguchi N, Asano M, Itoh M, Toda M. Immunologic self-tolerance maintained by activated T cells expressing IL-2 receptor alpha-chains (CD25). Breakdown of a single mechanism of self-tolerance causes various autoimmune diseases. J Immunol. 1995;155:1151–1164. - PubMed
    1. Fontenot JD, Gavin MA, Rudensky AY. Foxp3 programs the development and function of CD4+ CD25+ regulatory T cells. Nat Immunol. 2003;4:330–336. - PubMed
    1. Rubtsov YP, Rasmussen JP, Chi EY, Fontenot J, Castelli L, Ye X, Treuting P, Siewe L, Roers A, Henderson WR, Jr, Muller W, Rudensky AY. Regulatory T cell-derived interleukin-10 limits inflammation at environmental interfaces. Immunity. 2008;28:546–558. - PubMed
    1. Allan SE, Crome SQ, Crellin NK, Passerini L, Steiner TS, Bacchetta R, Roncarolo MG, Levings MK. Activation-induced FOXP3 in human T effector cells does not suppress proliferation or cytokine production. Int Immunol. 2007;19:345–354. - PubMed
    1. Ohkura N, Kitagawa Y, Sakaguchi S. Development and maintenance of regulatory T cells. Immunity. 2013;38:414–423. - PubMed

Publication types

MeSH terms

Substances