

Radiologic evidence that hypothalamic gliosis is associated with obesity and insulin resistance in humans
- PMID: 26530930
- PMCID: PMC4634110
- DOI: 10.1002/oby.21248
Radiologic evidence that hypothalamic gliosis is associated with obesity and insulin resistance in humans
Erratum in
-
Radiologic evidence that hypothalamic gliosis is associated with obesity and insulin resistance in humans.Obesity (Silver Spring). 2022 Jul;30(7):1520. doi: 10.1002/oby.23460. Epub 2022 May 25. Obesity (Silver Spring). 2022. PMID: 35614849 No abstract available.
Abstract
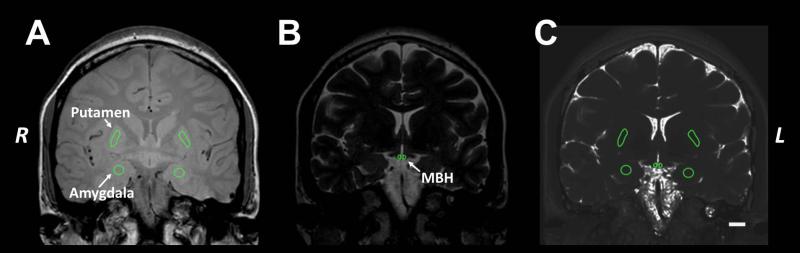
Objective: To use quantitative magnetic resonance imaging (MRI) to test whether mediobasal hypothalamic (MBH) gliosis is associated with obesity and insulin resistance in humans.
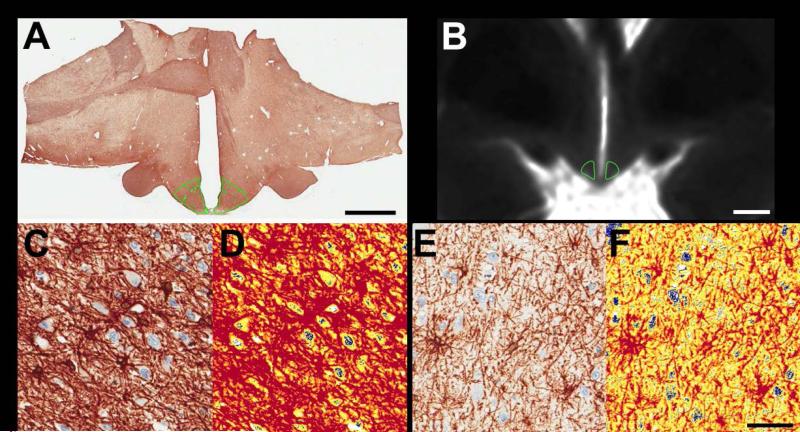
Methods: Sixty-seven participants underwent a fasting blood draw and MRI. Cases with radiologic evidence of MBH gliosis (N = 22) were identified as the upper tertile of left MBH T2 relaxation time and were compared to controls (N = 23) from the lowest tertile. In a separate postmortem study, brain slices (N = 10) through the MBH were imaged by MRI and stained for glial fibrillary acidic protein (GFAP).
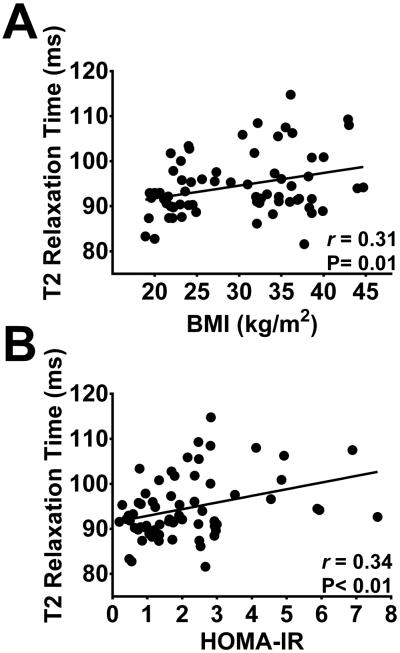
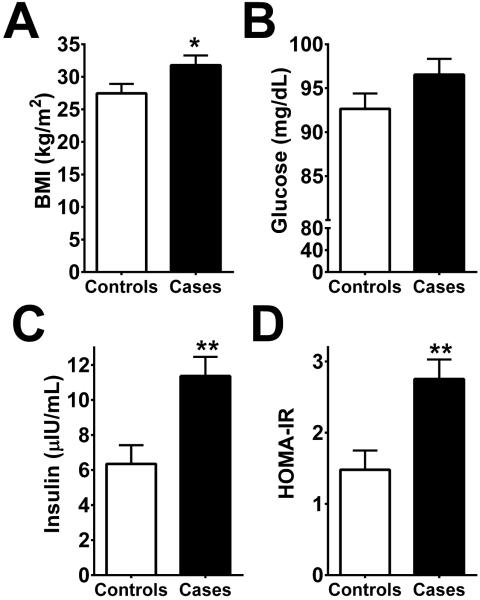
Results: In all participants, longer T2 relaxation time in the left MBH was associated with higher BMI (P = 0.01). Compared with controls, cases had longer T2 relaxation times in the right MBH (P < 0.05), as well as higher BMI (P < 0.05), fasting insulin concentrations (P < 0.01), and HOMA-IR values (P < 0.01), adjusted for sex and age. Elevations in insulin and HOMA-IR were also independent of BMI. In the postmortem study, GFAP staining intensity was positively associated with MBH T2 relaxation time (P < 0.05), validating an MRI-based method for the detection of MBH gliosis in humans.
Conclusions: These findings link hypothalamic gliosis to insulin resistance in humans and suggest that the link is independent of the level of adiposity.
© 2015 The Obesity Society.
Figures
References
-
- Garcia-Caceres C, Yi CX, Tschop MH. Hypothalamic astrocytes in obesity. Endocrinology and Metabolism Clinics of North America. 2013;42(1):57–66. - PubMed
-
- Morari J, Anhe GF, Nascimento LF, de Moura RF, Razolli D, Solon C, et al. Fractalkine (CX3CL1) is involved in the early activation of hypothalamic inflammation in experimental obesity. Diabetes. 2014;63(11):3770–84. - PubMed
Publication types
MeSH terms
Substances
Grants and funding
- T32 HL007028/HL/NHLBI NIH HHS/United States
- T32 DK007247/DK/NIDDK NIH HHS/United States
- K12 HD053984/HD/NICHD NIH HHS/United States
- P30 CA015704/CA/NCI NIH HHS/United States
- R01 DK052989/DK/NIDDK NIH HHS/United States
- P30DK035816/DK/NIDDK NIH HHS/United States
- R01DK052989/DK/NIDDK NIH HHS/United States
- R01 DK083042/DK/NIDDK NIH HHS/United States
- R01DK089036/DK/NIDDK NIH HHS/United States
- R01 DK089036/DK/NIDDK NIH HHS/United States
- P30 DK035816/DK/NIDDK NIH HHS/United States
- R01 DK101997/DK/NIDDK NIH HHS/United States
- T32DK007247/DK/NIDDK NIH HHS/United States
- K12HD053984/HD/NICHD NIH HHS/United States
LinkOut - more resources
Full Text Sources
Other Literature Sources
Medical
Miscellaneous
