. 2016 Jan 7;127(1):122-31.
doi: 10.1182/blood-2014-05-575704. Epub 2015 Nov 3.

Targeting CD123 in acute myeloid leukemia using a T-cell-directed dual-affinity retargeting platform

Affiliations

Targeting CD123 in acute myeloid leukemia using a T-cell-directed dual-affinity retargeting platform

Muneera Al-Hussaini et al. Blood. .

Abstract

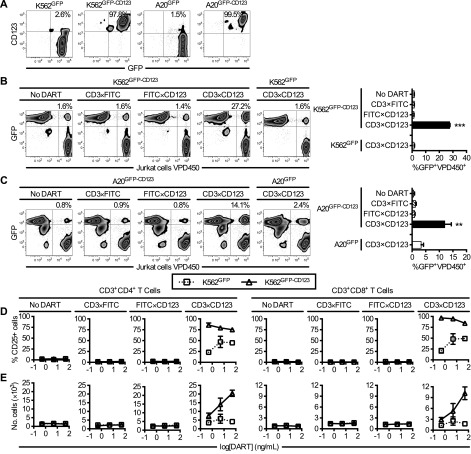
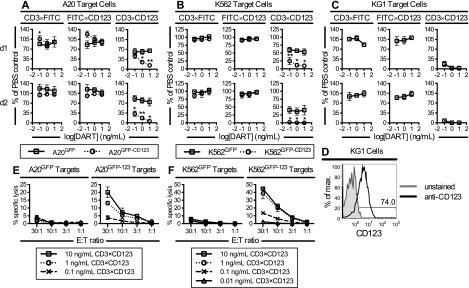
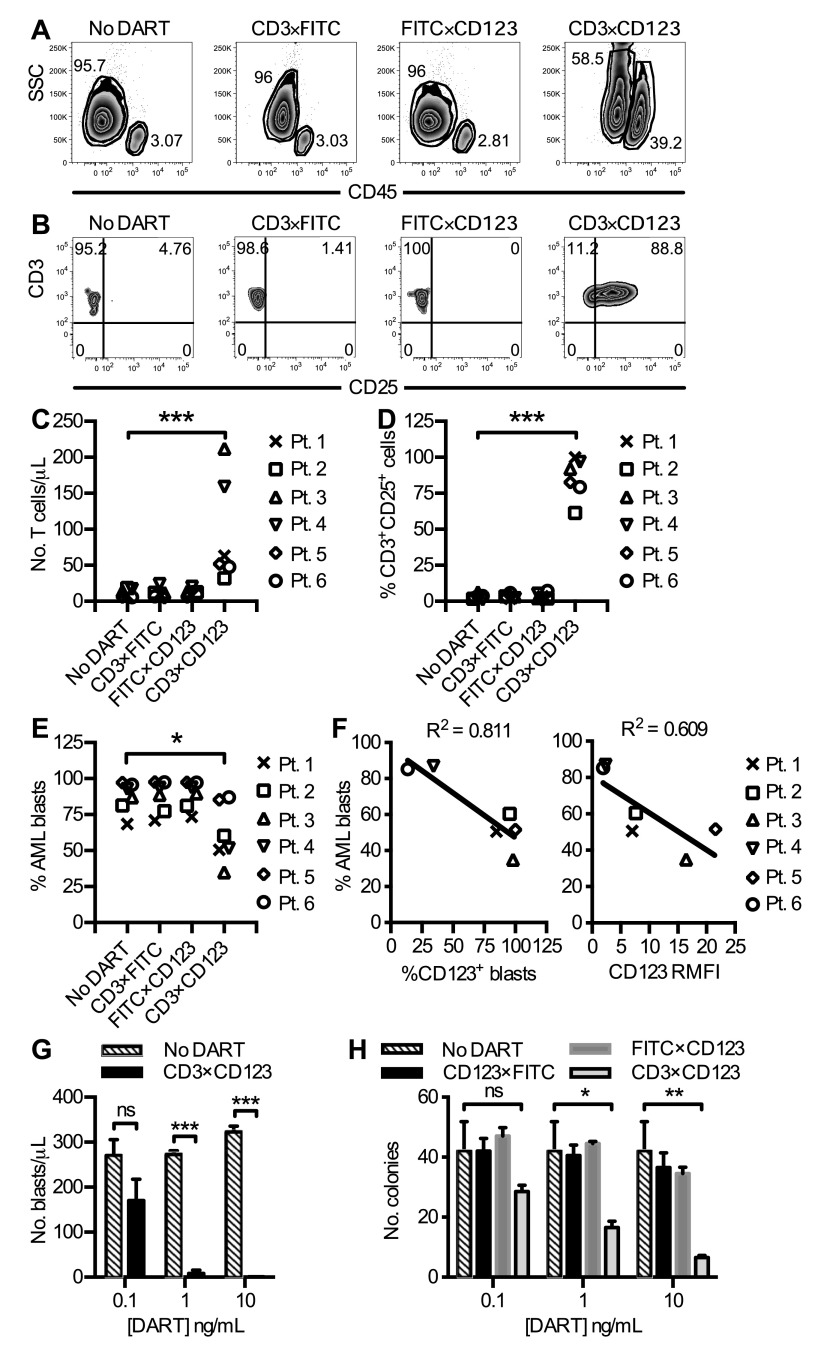
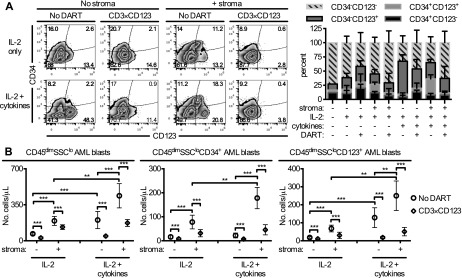
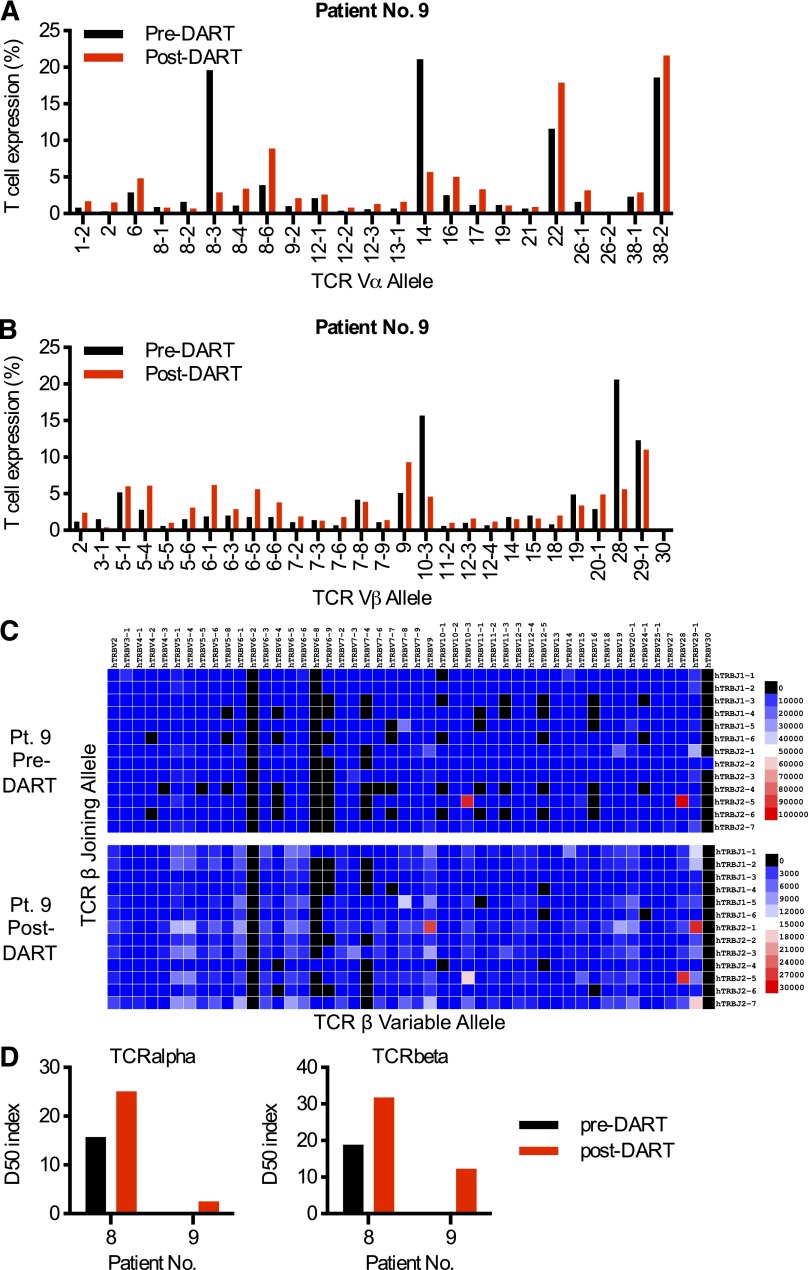
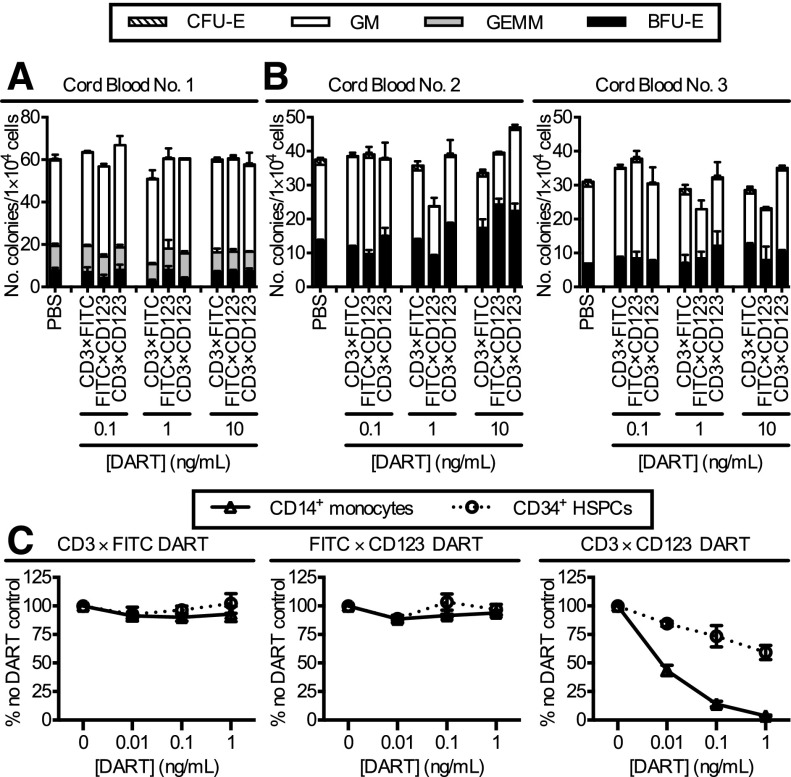
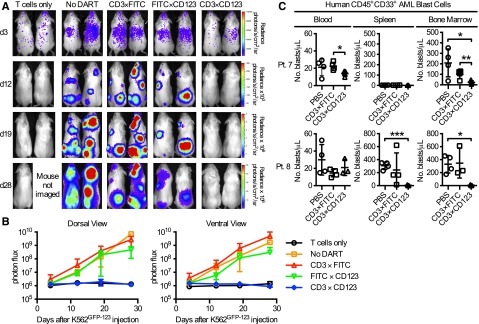
T-cell-directed killing of tumor cells using bispecific antibodies is a promising approach for the treatment of hematologic malignancies. Here we describe our preclinical work with a dual-affinity retargeting (DART) molecule generated from antibodies to CD3 and CD123, designed to redirect T cells against acute myeloid leukemia blasts. The CD3×CD123 DART (also referred to as MGD006/S80880) consists of 2 independent polypeptides, each composed of the VH of 1 antibody in tandem with the VL of the other antibody. The target antigen CD123 (interleukin 3RA) is highly and differentially expressed in acute myeloid leukemia (AML) blasts compared with normal hematopoietic stem and progenitor cells. In this study we demonstrate that the CD3×CD123 DART binds to both human CD3 and CD123 to mediate target-effector cell association, T-cell activation, proliferation, and receptor diversification. The CD3×CD123 DART also induces a dose-dependent killing of AML cell lines and primary AML blasts in vitro and in vivo. These results provide the basis for testing the CD3×CD123 DART in the treatment of patients with CD123(+) AML.


Figures

Figure 1
Figure 1
The CD3×CD123 DART binds the CD3/TCR complex and human CD123 and mediates cell association and T-cell activation and expansion in vitro. (A) Expression of GFP and CD123 in K562 and A20 cell lines transduced with GFP alone or GFP-CD123. (B) K562GFP-CD123 and (C) A20GFP-CD123 cells were incubated at a 1:1 ratio with VPD450-labeled Jurkat cells in the presence of the indicated DARTs (10 ng/mL). K562GFP and A20GFP cell lines were used as controls. Association is measured by flow cytometry as the percentage of GFP+VPD450+ events divided by the total number of GFP+ and VPD450+ cells. Each bar in the summary graphs represents the average of 3 separate experiments, where samples were analyzed in duplicate in each experiment. (D-E) Human T cells (4 × 10⁴ cells/well) were cultured with IL-2 (10 IU/mL) and irradiated K562GFP or K562GFP-CD123 cells (100 Gy) at a 1:1 ratio in the presence or absence of the indicated DARTs for 5 days. (D) Assay of T-cell activation after exposure to DARTs. An increase in CD25 expression by flow cytometry demonstrates activation of T cells in the presence of CD3×CD123 DART compared with control DARTs. (E) Assay of T-cell proliferation after exposure to DARTs. An increase in the number of CD3+ cells demonstrates proliferation of T cells in the presence of K562GFP-CD123 cells and CD3×CD123 DART compared with control DARTs and K562GFP cells. One representative example is shown out of two experiments with different donors. The data are shown as means ± standard deviations, where each point was measured in triplicate. *P < .05, **P < .01, ***P < .001.
Figure 2
Figure 2
The CD3×CD123 DART enhances T-cell-mediated elimination of CD123-expressing cell lines in vitro. (A-C) Human T cells (2.5 × 10⁵ cells/well) were cultured with (A) A20GFP or A20GFP-CD123 cells, (B) K562GFP or K562GFP-CD123 cells, or (C) KG1 cells at a 10:1 ratio in the presence or absence of the indicated DARTs for 1 or 2 days. The absolute number of viable A20, K562, or KG1 targets were quantitated by flow cytometry, using 7-amino-actinomycin D (7-AAD), and cell survival is expressed relative to the PBS control. Each data point represents the average ± SD of 3 separate experiments, using different T-cell donors, where samples were analyzed in duplicate in each experiment. (D) Expression of CD123 on KG1 cells. (E-F) Human T cells were cultured with [51Cr]-labeled (E) A20GFP or A20GFP-CD123 cells or (F) K562GFP or K562GFP-CD123 at various E:T ratios in the presence of the indicated DARTs for 4 hours. *P < .05, **P < .01.
Figure 3
Figure 3
The CD3×CD123 DART induces T-cell activation, expansion, and redirected killing of blasts in primary AML samples. PBMCs (2 × 10⁵ cells/well in 96-well plate) from primary AML samples (n = 6) were incubated with DARTs at 0.1 ng/mL in the absence of exogenous cytokines for 6 days. (A) Representative flow cytometry analyses reveal an increase in the relative percentage of CD45hi lymphocytes compared with CD45dim blasts in response to CD3×CD123 DART. (B) Representative flow cytometry of CD25 expression in T cells after exposure to DARTs. (C) T-cell number and (D) CD25 expression in primary patient samples. (E) AML blast percentage after DART exposure in primary patient samples. (F) Correlation between the relative percentage of surviving blasts after exposure to CD3×CD123 DART for 6 days and baseline expression of CD123 on AML blasts. The percentage of AML cells expressing CD123 and the relative mean fluorescence intensity (RMFI) of CD123 is shown. (G) Dose-response relationship in total number of surviving blasts after exposure to CD3×CD123 DART. PBMCs (2 × 10⁵ cells/well in 96-well plate) from AML patient 5 were incubated with PBS (No DART) or DARTs in the absence of exogenous cytokines for 6 days. Error bars represent the SD of duplicate or triplicate cultures in a single experiment. (H) Mononuclear cells from primary AML patient 1 were treated in duplicate for 6 days with DARTs 0.1 to 10 ng/mL in complete medium followed by incubation of viable cells in methylcellulose-based medium. Colonies were counted after 7 to 14 culture days. Data are representative of 2 patient samples. *P < .05, **P < .01, ***P < .001.
Figure 4
Figure 4
The CD3×CD123 DART induces redirected killing of human AML blasts in the presence and absence of stroma. Cells from AML patient 9 were grown in the presence or absence of NSG stroma in media supplemented with IL-2 or a mixture of IL-2 and murine macrophage-colony-stimulating factor (100 ng/mL), murine IL-3, human IL-6, murine thrombopoietin, and human FLT3L. Twelve hours after initiation of culture, PBS (No DART) or 1 ng/mL CD3×CD123 DART were added to the wells. Six days later, cells were harvested and analyzed by flow cytometry for CD45dimSSClo AML blasts expressing CD34 and CD123. (A) Representative flow cytometry of CD34 and CD123 expression on CD45dimSSClo AML blasts. Bar graph represents the percentage of cells of the indicated phenotype out of all blasts in the wells. (B) The absolute numbers of total CD45dimSSClo AML blasts and CD45dimSSClo AML cells expressing CD34 and CD123. Each data point represents the average of 4 separate experiments, where samples were analyzed in duplicate or triplicate in each experiment. The average number of cells under different culture conditions were summarized using means and standard deviations and compared by two-way ANOVA for repeated measurement data. As a result of relatively large variability in data, a logarithm transformation was performed to better satisfy the assumption of normal distribution. All the tests were two-sided, and a P-value of .05 or less was taken to indicate statistical significance. *P < .05, **P < .01, ***P < .001.
Figure 5
Figure 5
The CD3×CD123 DART induces TCR diversification in primary AML samples. Banked PBMCs from AML patients 8 and 9 were grown for 5 days in the presence of CD3×CD123 DART molecules. Purified T cells obtained at baseline (pre-DART) and after DART treatment (post-DART) were evaluated by next-generation sequencing of the TCR-Vα and TCR-Vβ families. Relative levels of 23 specific TCR-Vα (A) and 28 specific TCR-Vβ (B) families are shown here for AML patient 9 and in supplemental Figure 4 for patient 8. These genes were selected for presentation based on being expressed in more than 1% of the T cells in either of the patient samples. (C) TCRβ gene usage. A heat map of the relative frequency of a germline TCR variable (V)-gene allele is plotted relative to the germline joining (J)-gene allele for AML patient 9. The frequency of each V-J combination is represented by the color of the map. (D) D50 index. The D50 index is a quantitative measure of the degree of diversity of T cells within a sample. The D50 is the percentage of T-cell clones that account for the cumulative 50% of the total CDR3s counted in the sample. The more diverse a library, the closer the value will be to 50. Low diversity values are associated with decreased diversity. The data suggest that TCRβ and TCRα diversity increased after DART treatment of both patients.
Figure 6
Figure 6
Effect of CD3×CD123 DART on normal CD34+ progenitor cells. Cord blood cells from 3 healthy donors were incubated with DARTs for either (A) 4 hours or (B) 18 hours and plated in methylcellulose-based medium. Colonies were scored on day 7. Error bars represent the SD of duplicate plates. (C) Purified CD34+ progenitors and CD14+CD123+ monocytes from a healthy donor mobilized peripheral blood product (n = 2) were incubated with DARTs and autologous T cells for 18 hours. Cell survival was determined by flow cytometry.
Figure 7
Figure 7
CD3×CD123 DART suppresses CD123+ leukemia xenograft in NSG mice. (A-B) Irradiated NSG mice (n = 5/group) injected with K562GFP-CD123 cells and treated with DARTs. Bioluminescence imaging on days 3, 12, 19, and 28 showed significant inhibition (P < .0001) of tumor growth in CD3×CD123 DART-treated cells compared with CD3×FITC, FITC×CD123 control DARTs, or no DART (PBS). (C) NSG mice (n = 3-4/group) were sublethally irradiated (300 cGy) on day 0 and injected with primary human AML cells (5 × 10⁶ cells/mouse) from patient number 7 or 8 on day 5. Mice were treated with PBS, CD3×FITC control DART, or CD3×CD123 DART (0.5 mg/kg/day) on days 5 to 8. Peripheral blood, spleen, and bone marrow specimens were obtained 6 weeks after injection and analyzed by flow cytometry for CD45+CD33+ AML blasts. Data represent the mean and ±SD. *P < .05, **P < .01, ***P < .001.

References

    1. Byrne H, Conroy PJ, Whisstock JC, O’Kennedy RJ. A tale of two specificities: bispecific antibodies for therapeutic and diagnostic applications. Trends Biotechnol. 2013;31(11):621–632. - PMC - PubMed
    1. Johnson S, Burke S, Huang L, et al. Effector cell recruitment with novel Fv-based dual-affinity re-targeting protein leads to potent tumor cytolysis and in vivo B-cell depletion. J Mol Biol. 2010;399(3):436–449. - PubMed
    1. Moore PA, Zhang W, Rainey GJ, et al. Application of dual affinity retargeting molecules to achieve optimal redirected T-cell killing of B-cell lymphoma. Blood. 2011;117(17):4542–4551. - PubMed
    1. Agis H, Füreder W, Bankl HC, et al. Comparative immunophenotypic analysis of human mast cells, blood basophils and monocytes. Immunology. 1996;87(4):535–543. - PMC - PubMed
    1. Jordan CT, Upchurch D, Szilvassy SJ, et al. The interleukin-3 receptor alpha chain is a unique marker for human acute myelogenous leukemia stem cells. Leukemia. 2000;14(10):1777–1784. - PubMed

Publication types

MeSH terms

Substances