. 2016 Jan 29;44(2):838-51.
doi: 10.1093/nar/gkv1168. Epub 2015 Nov 3.

A dynamic intron retention program enriched in RNA processing genes regulates gene expression during terminal erythropoiesis

Affiliations

A dynamic intron retention program enriched in RNA processing genes regulates gene expression during terminal erythropoiesis

Harold Pimentel et al. Nucleic Acids Res. .

Abstract

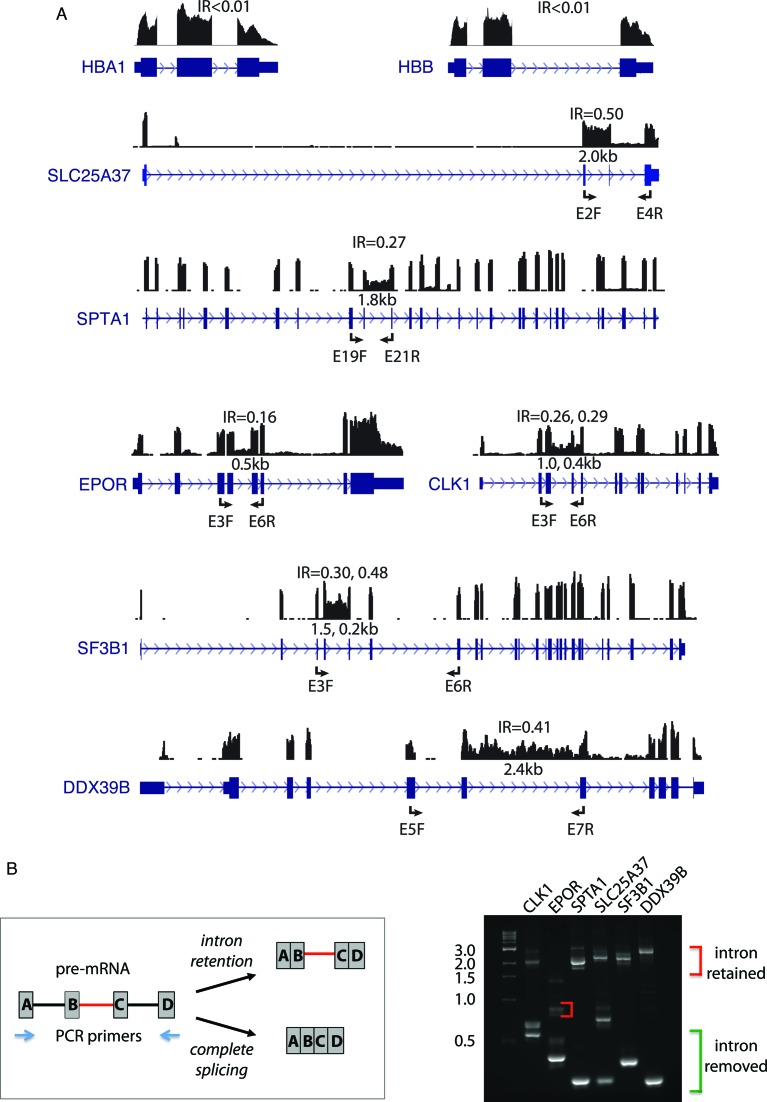
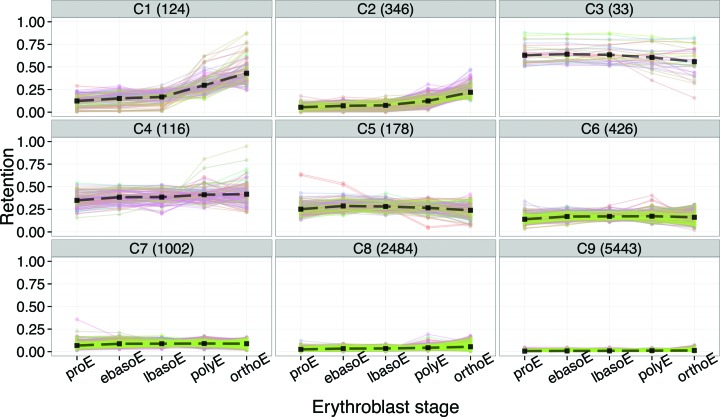
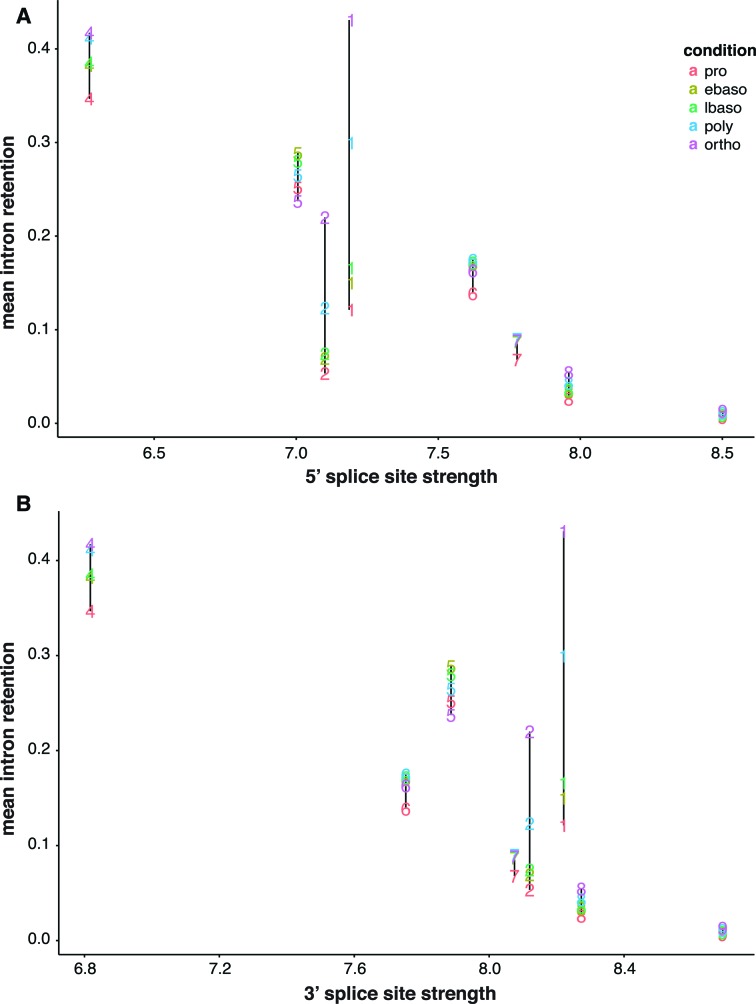
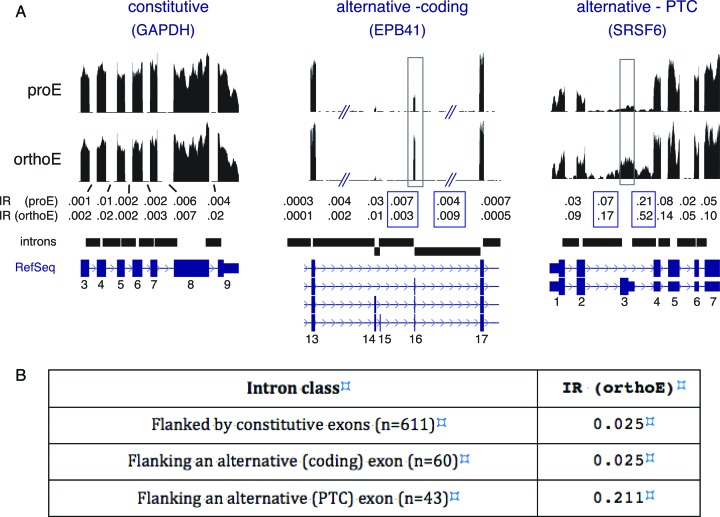
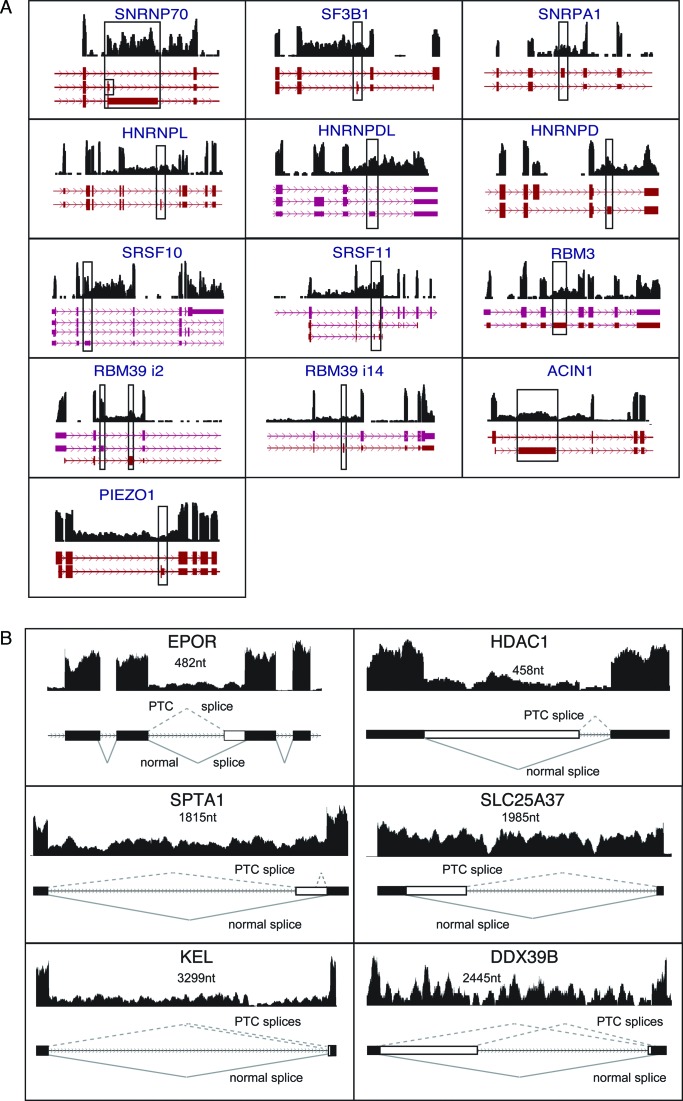
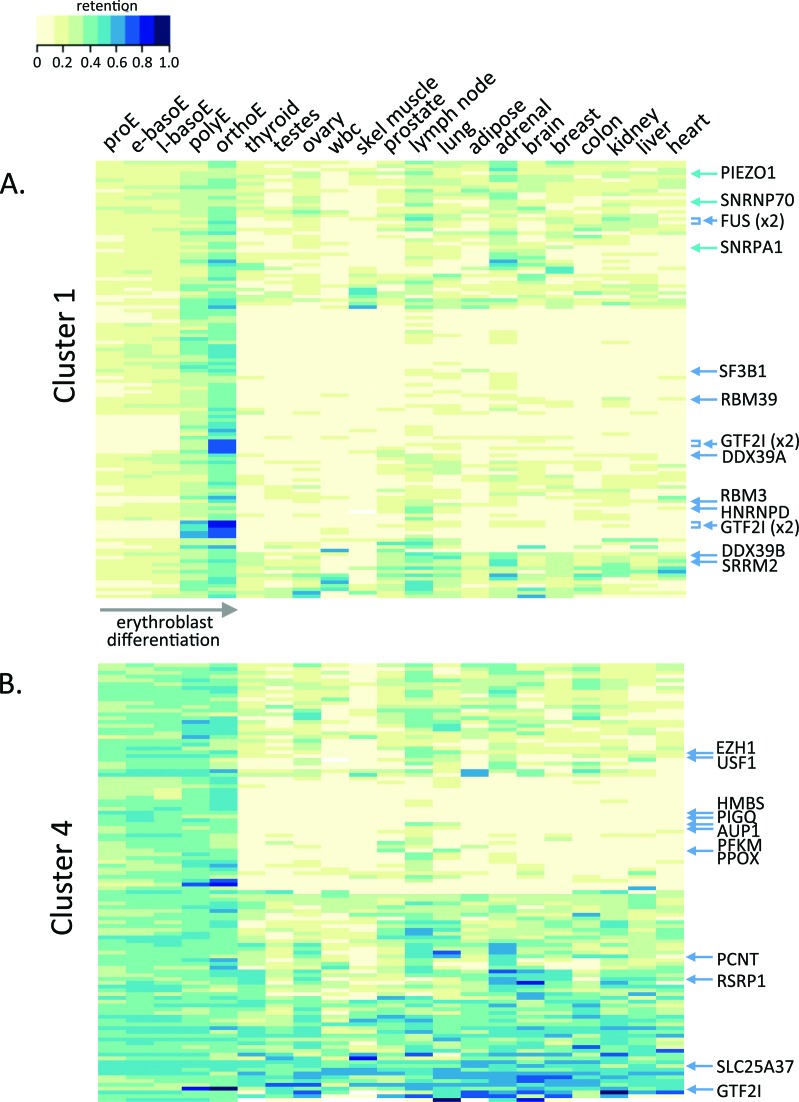
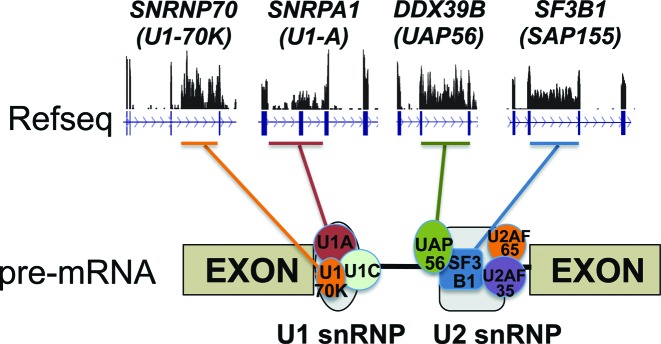
Differentiating erythroblasts execute a dynamic alternative splicing program shown here to include extensive and diverse intron retention (IR) events. Cluster analysis revealed hundreds of developmentally-dynamic introns that exhibit increased IR in mature erythroblasts, and are enriched in functions related to RNA processing such as SF3B1 spliceosomal factor. Distinct, developmentally-stable IR clusters are enriched in metal-ion binding functions and include mitoferrin genes SLC25A37 and SLC25A28 that are critical for iron homeostasis. Some IR transcripts are abundant, e.g. comprising ∼50% of highly-expressed SLC25A37 and SF3B1 transcripts in late erythroblasts, and thereby limiting functional mRNA levels. IR transcripts tested were predominantly nuclear-localized. Splice site strength correlated with IR among stable but not dynamic intron clusters, indicating distinct regulation of dynamically-increased IR in late erythroblasts. Retained introns were preferentially associated with alternative exons with premature termination codons (PTCs). High IR was observed in disease-causing genes including SF3B1 and the RNA binding protein FUS. Comparative studies demonstrated that the intron retention program in erythroblasts shares features with other tissues but ultimately is unique to erythropoiesis. We conclude that IR is a multi-dimensional set of processes that post-transcriptionally regulate diverse gene groups during normal erythropoiesis, misregulation of which could be responsible for human disease.


Figures

Figure 1.
Figure 1.
Intron retention in important erythroid genes. (A) Wiggle plots showing RNA-seq reads from the orthoE stage mapped to genes with no IR (top panel, HBA1 and HBB) and genes with significant retention of one or more introns (SLC25A37, SPTA1, EPOR, CLK1, SF3B1 and DDX39B). 5′ and 3′ ends of the SPTA1 gene are not shown due to size constraints. Size of retained introns is indicated in kilobases and primer locations for PCR validations are shown. (B) RT-PCR confirmation of IR. The general PCR scheme is pictured at the left, while PCR products are shown at the right. Lane M, size standards.
Figure 2.
Figure 2.
Cluster analysis of IR during erythroblast differentiation. The number of introns in each cluster C1–C9 is indicated in parentheses.
Figure 3.
Figure 3.
Analysis of splice site strength in IR clusters. Average 5′ splice site strength (panel A) and 3′ splice site strength (panel B) is indicated for each cluster at each stage of terminal erythropoiesis, color coded according to differentiation stage (“condition"). In clusters C4–C9, IR is relatively stable across erythroblast populations and is inversely correlated with splice site strength. Clusters C1 and C2 display a much greater dynamic range of IR that is not correlated with splice site strength.
Figure 4.
Figure 4.
IR characteristics of three intron classes. (A) RNA-seq read mapping data for Refseq annotated gene regions with no alternative splicing (GAPDH), alternative splicing of a coding exon (exon 16 in EPB41) and alternative splicing of a PTC exon (exon 3 in SRSF6). Boxed regions indicate the alternative exons of interest and the IR values of their flanking introns. (B) Summary of IR results for introns adjacent to alternative exons studied in (2), Figures 3, 4 and 6. Constitutive exons are from the same gene sets.
Figure 5.
Figure 5.
Intron retention flanking PTC exons in RNA processing genes. (A) Wiggle plots showing RNA-seq reads from orthoE cells are aligned with Ensembl-annotated gene regions spanning PTC exons. Boxes indicate PTC exons. (B) Wiggle plots showing retained introns that are associated with unproductive ‘PTC’ splice sites supported by RNA-seq reads, either Ensembl-annotated (SLC25A37, DDX39B, HDAC1, KEL, EPOR) or novel (SPTA1, KEL). Size of the retained intron in nucleotides is indicated.
Figure 6.
Figure 6.
(A) Nuclear localization of IR transcripts. Nuclear (N) and cytoplasmic (C) fractions of human erythroblasts were assayed for intron retention by RT-PCR. Migration of IR isoforms is indicated by filled arrowheads, unproductive splicing by open arrowheads and productive splicing by open circles. IR isoforms are greatly enriched in the nucleus relative to spliced transcripts. (B) IR isoform is not degraded by NMD. Erythroblast RNA from cells cultured without (−) or with (+) cycloheximide plus emetine were amplified by RT-PCR. Enhanced detection of the PTC isoform of the SNRNP70 transcript indicates successful inhibition of NMD, but the IR isoform of SLC25A28 did not increase under the same conditions. A novel PTC isoform of SLC25A28, which was NMD sensitive, was revealed in this experiment. * indicates a PCR artifact. CHI, cycloheximide.
Figure 7.
Figure 7.
Comparison of IR in erythroblasts and other tissues. (A) Heat map displaying IR values for introns in cluster 1, with the five erythroblast populations at the left. Individual genes of interest are indicated at the right. (B) Heat map displaying IR values for introns in cluster 4.
Figure 8.
Figure 8.
Model showing that major spliceosomal genes can be regulated by IR. Shown above are the wiggle plots in mature erythroblasts (orthoE); much reduced IR is evident in earlier stages.

References

    1. An X., Schulz V.P., Li J., Wu K., Liu J., Xue F., Hu J., Mohandas N., Gallagher P.G. Global transcriptome analyses of human and murine terminal erythroid differentiation. Blood. 2014;123:3466–3477. - PMC - PubMed
    1. Pimentel H., Parra M., Gee S., Ghanem D., An X., Li J., Mohandas N., Pachter L., Conboy J.G. A dynamic alternative splicing program regulates gene expression during terminal erythropoiesis. Nucleic Acids Res. 2014;42:4031–4042. - PMC - PubMed
    1. Paralkar V.R., Mishra T., Luan J., Yao Y., Kossenkov A.V., Anderson S.M., Dunagin M., Pimkin M., Gore M., Sun D., et al. Lineage and species-specific long noncoding RNAs during erythro-megakaryocytic development. Blood. 2014;123:1927–1937. - PMC - PubMed
    1. Cheng A.W., Shi J., Wong P., Luo K.L., Trepman P., Wang E.T., Choi H., Burge C.B., Lodish H.F. Muscleblind-like 1 (Mbnl1) regulates pre-mRNA alternative splicing during terminal erythropoiesis. Blood. 2014;124:598–610. - PMC - PubMed
    1. Shi L., Lin Y.H., Sierant M.C., Zhu F., Cui S., Guan Y., Sartor M.A., Tanabe O., Lim K.C., Engel J.D. Developmental transcriptome analysis of human erythropoiesis. Hum. Mol. Genet. 2014;23:4528–4542. - PMC - PubMed

Publication types

MeSH terms