. 2016 Mar 18;44(5):e42.
doi: 10.1093/nar/gkv1144. Epub 2015 Nov 3.

EMERGE: a flexible modelling framework to predict genomic regulatory elements from genomic signatures

Affiliations

EMERGE: a flexible modelling framework to predict genomic regulatory elements from genomic signatures

Karel van Duijvenboden et al. Nucleic Acids Res. .

Abstract

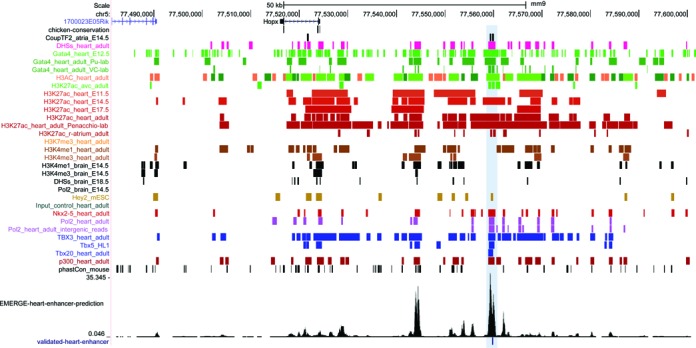
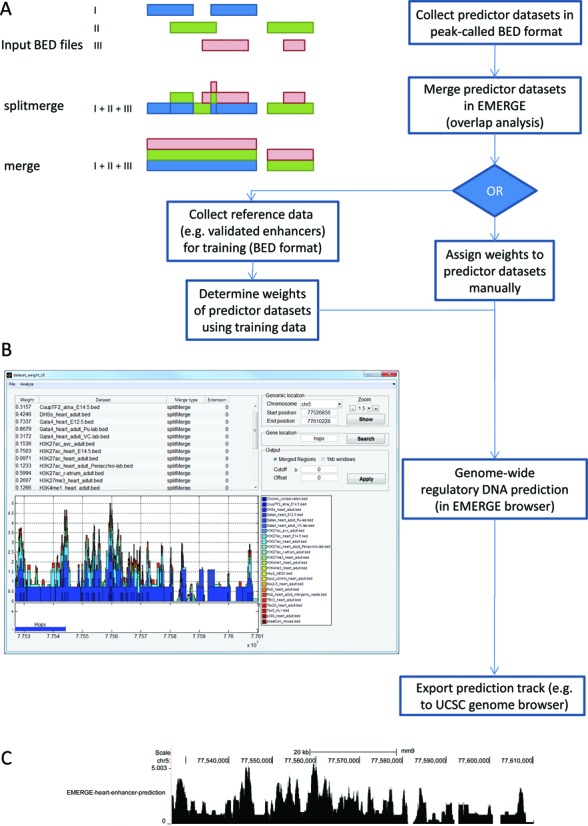
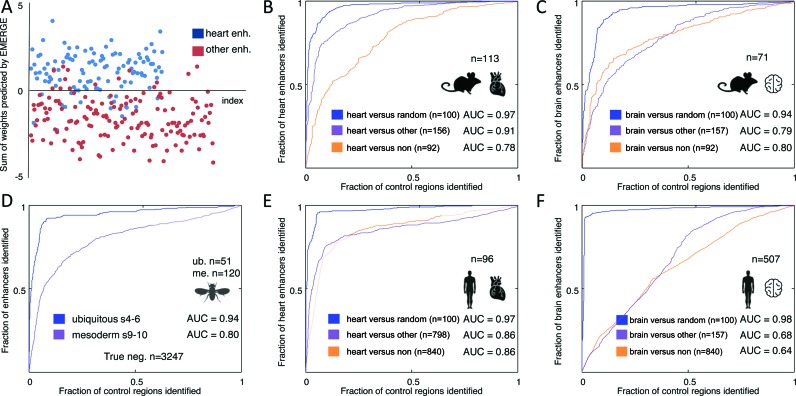
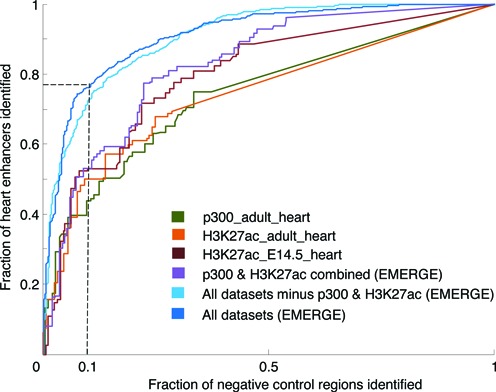
Regulatory DNA elements, short genomic segments that regulate gene expression, have been implicated in developmental disorders and human disease. Despite this clinical urgency, only a small fraction of the regulatory DNA repertoire has been confirmed through reporter gene assays. The overall success rate of functional validation of candidate regulatory elements is low. Moreover, the number and diversity of datasets from which putative regulatory elements can be identified is large and rapidly increasing. We generated a flexible and user-friendly tool to integrate the information from different types of genomic datasets, e.g. ATAC-seq, ChIP-seq, conservation, aiming to increase the ease and success rate of functional prediction. To this end, we developed the EMERGE program that merges all datasets that the user considers informative and uses a logistic regression framework, based on validated functional elements, to set optimal weights to these datasets. ROC curve analysis shows that a combination of datasets leads to improved prediction of tissue-specific enhancers in human, mouse and Drosophila genomes. Functional assays based on this prediction can be expected to have substantially higher success rates. The resulting integrated signal for prediction of functional elements can be plotted in a build-in genome browser or exported for further analysis.


Figures

Figure 1.
Figure 1.
The EMERGE approach. UCSC browser view of the Hopx locus. The wealth of functional genomic data available for the heart generates a complex landscape of peaks, making it difficult to pinpoint enhancer locations. EMERGE calculates dataset overlap and collapses the signal into an overall (heart enhancer) prediction. The highlighted region denotes a strong peak in the prediction signal which coincides with a validated heart enhancer.
Figure 2.
Figure 2.
Overview of the EMERGE framework. (A) The EMERGE flowchart, including the collecting and merging of input BED files, the assignment of dataset weights for prediction and the possibility to export the resulting prediction tracks. (B) Screenshot of the graphical user interface of the EMERGE program, after the combination of the datasets shown in panel A. The build-in genome browser shows the accumulated signal at the Hopx locus. After calculation of dataset overlap, weights can be assigned to determine each set's contribution to enhancer prediction. (C) The resulting overall prediction signal can be exported for use in external tools, such as the UCSC genome browser.
Figure 3.
Figure 3.
Benchmarking EMERGE performance with ROC curves. Populations of validated tissue-specific enhancers were split into training and testing data. EMERGE assigns the optimal dataset weights through modelling with an elastic net logistic regression approach on the training data. These weights are subsequently tested on the testing data. (A) Scatterplot of the modelled weights assigned to validated heart enhancers and enhancers active in other tissues, showing clearly separated distributions. This same data served to construct an ROC curve in panel B (purple line). (B–F) Plotted ROC curves of EMERGE enhancer prediction using the training data as indicated and explained in the text. Area under the curve (AUC) values are given for each ROC curve. The number of true positive training regions is indicated above the organ and species icons. The number of true negative (TN) training regions is indicated per category. (B and C) Performance of mouse enhancer prediction by EMERGE on heart (B) and brain (C) tissue. (D) Performance of Drosophila enhancer prediction by EMERGE. Regions tested negative in validation assays were used as TN reference data. (E and F) Performance of human enhancer prediction by EMERGE on heart (E) and brain (F) tissue.
Figure 4.
Figure 4.
Combining datasets in EMERGE outperforms classical enhancer hallmarks p300 and H3K27ac. Performance of enhancer prediction by EMERGE and heart H3K27ac and p300 ChIP-seq. Individual ChIP-seq datasets were sorted on significance. The combination of H3K27ac and p300 and EMERGE without these three datasets are also plotted. Enhancers active in other tissue were used as negative control region reference data. The dashed line indicates the fraction of reporter assays that will detect a true enhancer when a false positive rate of 10% is accepted (see Table 1).
Figure 5.
Figure 5.
Validated human heart enhancer located in significantly interacting chromatin domains. The HiC and HiC-complement peaks in red and green denote chromatin domains that are frequently interacting with each other. The chromatin domain that covers part of a GATA4 intron contains a validated heart enhancer.
Figure 6.
Figure 6.
EMERGE enhancer prediction is able to recognize and use tissue-specific signatures. Screenshot of the Pim1 locus, containing a validated heart and a validated brain enhancer located in close proximity. Using tissue-specific training data, the logistic regression approach of EMERGE is able to discriminate between heart and brain enhancers on the basis of their genomic signatures. The images of the enhancer screened transgenic embryos are taken from the Vista enhancer browser (reference in main text).

References

    1. de Laat W., Duboule D. Topology of mammalian developmental enhancers and their regulatory landscapes. Nature. 2013;502:499–506. - PubMed
    1. Banerji J., Rusconi S., Schaffner W. Expression of a beta-globin gene is enhanced by remote SV40 DNA sequences. Cell. 1981;27:299–308. - PubMed
    1. Jenuwein T., Allis C.D. Translating the histone code. Science. 2001;293:1074–1080. - PubMed
    1. Hindorff L.A., Sethupathy P., Junkins H.A., Ramos E.M., Mehta J.P., Collins F.S., Manolio T.A. Potential etiologic and functional implications of genome-wide association loci for human diseases and traits. Proc. Natl. Acad. Sci. U.S.A. 2009;106:9362–9367. - PMC - PubMed
    1. Maurano M.T., Humbert R., Rynes E., Thurman R.E., Haugen E., Wang H., Reynolds A.P., Sandstrom R., Qu H., Brody J., et al. Systematic localization of common disease-associated variation in regulatory DNA. Science. 2012;337:1190–1195. - PMC - PubMed

Publication types

LinkOut - more resources