. 2016 Jul;27(7):1958-69.
doi: 10.1681/ASN.2015030231. Epub 2015 Nov 3.

2-Deoxy-d-Glucose Ameliorates PKD Progression

Affiliations

2-Deoxy-d-Glucose Ameliorates PKD Progression

Marco Chiaravalli et al. J Am Soc Nephrol. 2016 Jul.

Abstract

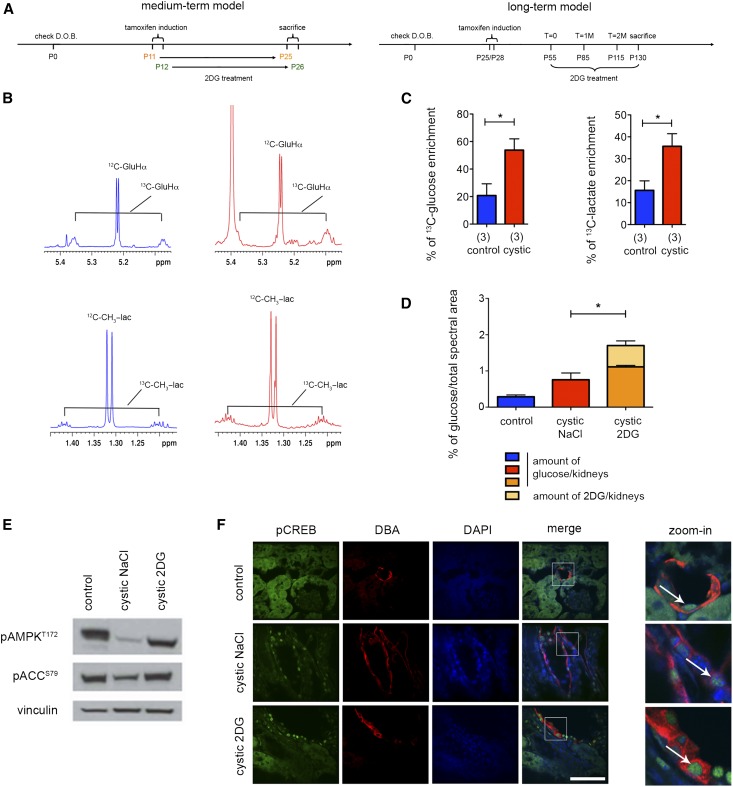
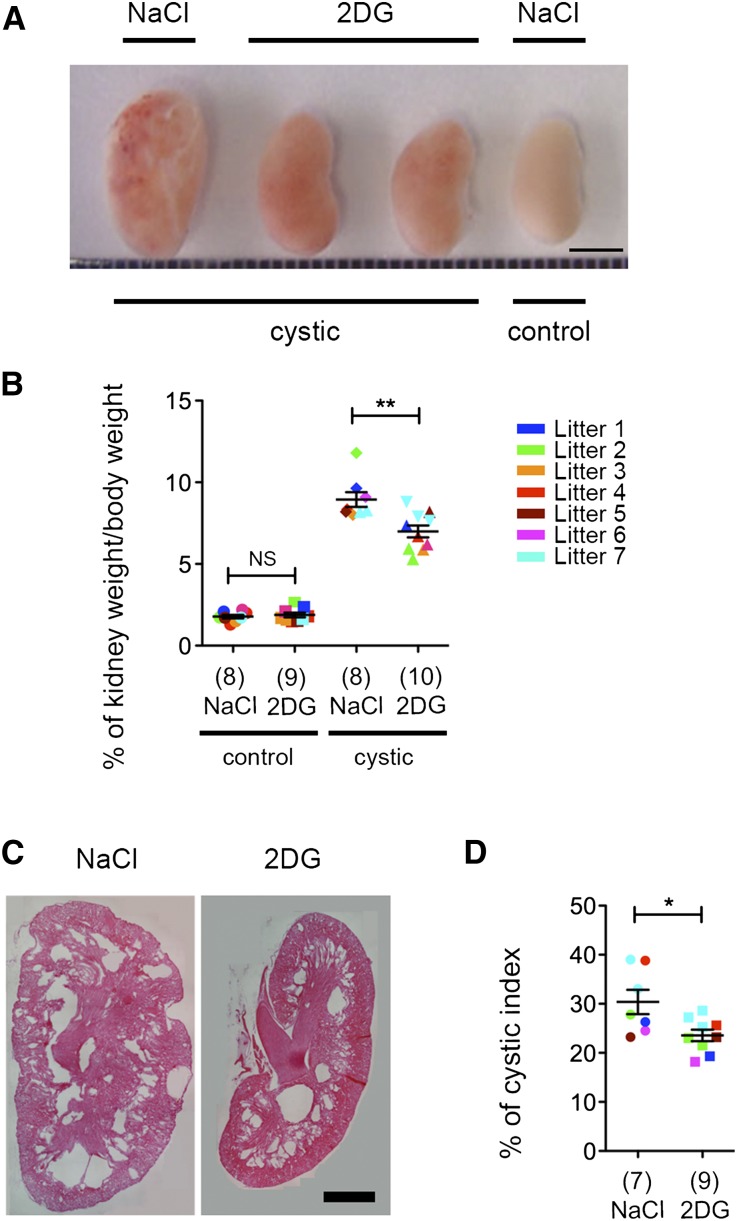
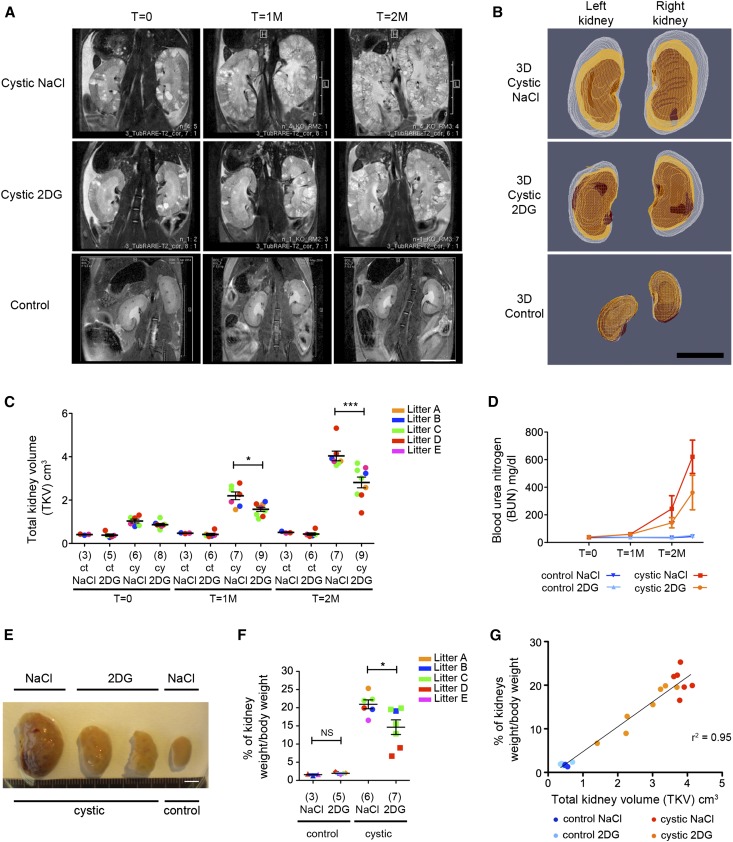
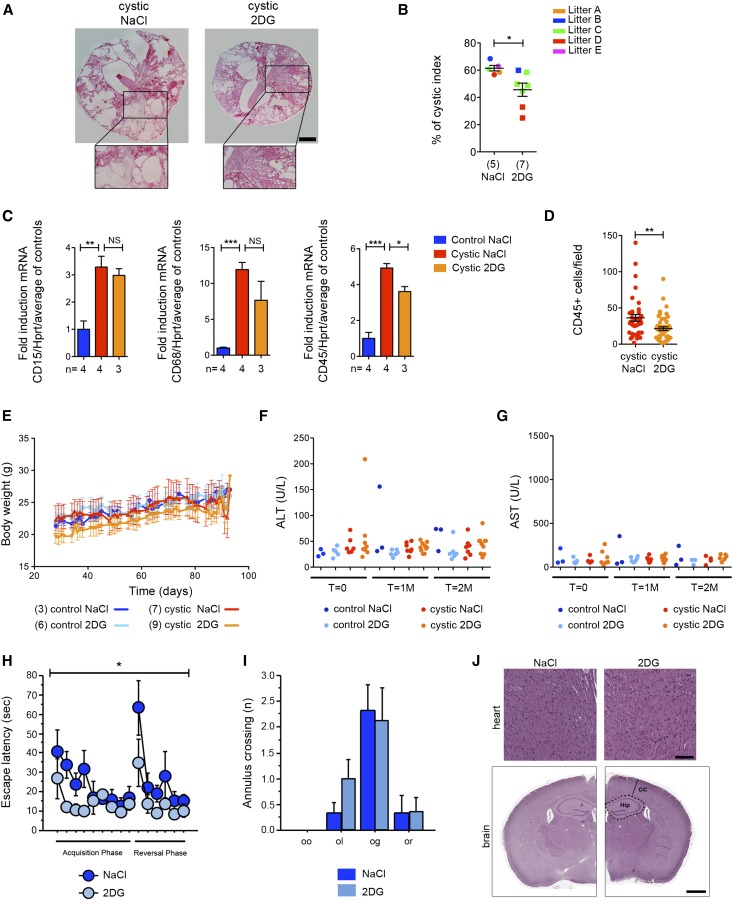
Autosomal dominant polycystic kidney disease (ADPKD) is an important cause of ESRD for which there exists no approved therapy in the United States. Defective glucose metabolism has been identified as a feature of ADPKD, and inhibition of glycolysis using glucose analogs ameliorates aggressive PKD in preclinical models. Here, we investigated the effects of chronic treatment with low doses of the glucose analog 2-deoxy-d-glucose (2DG) on ADPKD progression in orthologous and slowly progressive murine models created by inducible inactivation of the Pkd1 gene postnatally. As previously reported, early inactivation (postnatal days 11 and 12) of Pkd1 resulted in PKD developing within weeks, whereas late inactivation (postnatal days 25-28) resulted in PKD developing in months. Irrespective of the timing of Pkd1 gene inactivation, cystic kidneys showed enhanced uptake of (13)C-glucose and conversion to (13)C-lactate. Administration of 2DG restored normal renal levels of the phosphorylated forms of AMP-activated protein kinase and its target acetyl-CoA carboxylase. Furthermore, 2DG greatly retarded disease progression in both model systems, reducing the increase in total kidney volume and cystic index and markedly reducing CD45-positive cell infiltration. Notably, chronic administration of low doses (100 mg/kg 5 days per week) of 2DG did not result in any obvious sign of toxicity as assessed by analysis of brain and heart histology as well as behavioral tests. Our data provide proof of principle support for the use of 2DG as a therapeutic strategy in ADPKD.

Keywords: ADPKD; metabolism; polycystic kidney disease.


Figures

Figure 1.
Figure 1.
The Warburg effect the Pkd1 inducible KO model irrespective of the inactivation timepoint and effects of 2DG. (A) Schematic view of the experimental plan. Medium-term model (left panel): Pkd1ΔC/floxTmCre mice were injected with a single dose of Tamoxifen (10 mg/40 g) at either P11 or P12, and kidneys were collected at P25 or P26, respectively. Long-term model (right panel): Pkd1ΔC/floxTmCre mice were injected with a single dose of Tamoxifen (10 mg/40 g) at P25–P28, MRI was performed after 1, 2, and 3 months, and kidneys were finally collected 2 weeks after the last MRI. (B and C) Comparison of 13C enrichment on control and mutant mice. Representative 1H-1D spectra of the long-term experiment showing the 13C satellite pattern of the 13C-glucose (Hα) and 13C-lactate (CβH3) in control (blue) and cystic mice (red) in the long-term model. The two sets of spectra were acquired with the same spectral parameters and normalized to dry weight, such that the peak intensity of individual resonances is directly comparable. (C) The percentage of 13C-glucose and 13C-lactate enrichment (calculated as described in Concise Methods) was higher in the kidneys from the cystic mice (Pkd1ΔC/floxTmCre) compared with those in the controls (Pkd1flox/+TmCre; Pkd1flox/+ and Pkd1ΔC/flox interchangeably) as calculated from multiple samples acquired as in B. (D) The percentage of the total amount of glucose (glucose and 2DG) taken up by the kidneys of mice treated with 2DG (100 mg/kg) was significantly increased. (E) pAMPK T172 and its target pAcetyl-CoA Carboxylase (pACC) S69 were downregulated in cystic kidneys treated with vehicle compared with control and restored after 2DG treatment. (F) Nuclear pCREB staining is observed in the DBA-positive cysts in both 2DG–treated and untreated cystic kidneys. Scale bar, 50 μm in F. *P<0.05 determined using the unpaired t-test. D.O.B., day of birth.
Figure 2.
Figure 2.
Treatment with 2DG ameliorates cystic kidney disease in the medium-term model. (A) Images of cystic kidneys treated with 2DG at 100 mg/kg or NaCl from P12 to P26 and littermates controls. The best example is shown (litter 2). (B) The percentage of kidney weight to total body weight in cystic mice treated as described in A was significantly reduced compared with the vehicle control (NaCl). The same treatment had no effect on the percentage of kidney to total body weight in control mice. The power of the study was 0.94. (C) Representative images of the histologic analysis of kidneys treated as described in A. (D) Cystic index calculated for the kidneys from Pkd1ΔC/floxTmCre mice treated with 2DG or vehicle as described in A–C. Means±SEMs are indicated. NS indicates P≥0.05. Scale bars, 4 mm in A; 1 mm in C. *P<0.05 determined using the Mann–Whitney test for B and D; **P<0.01 determined using the Mann–Whitney test for B and D.
Figure 3.
Figure 3.
Treatment with 2DG retards PKD progression in the long-term model. (A) Follow-up of kidneys in vivo using MRI in the long–term animal model. Both cystic (Pkd1ΔC/floxTmCre) and control (Pkd1flox/+TmCre; Pkd1flox/+ and Pkd1ΔC/flox interchangeably) animals were injected with a single dose of Tamoxifen (10 mg/40 g) at P25/P28 followed by treatment with either vehicle (NaCl) or 2DG at 100 mg/kg. Representative images acquired by MRI as described in Concise Methods are shown. The first MRI was acquired 1 month after injection of Tamoxifen before initiation of treatment (T=0), and the second and third MRIs were acquired 1 (T=1M) and 2 (T=2M) months later, respectively. (B) Three-dimensional reconstruction of the kidneys from the left and right kidneys 1 (red), 2 (orange), and 3 months (white) after injection. (C) TKV was calculated for the cystic and control kidneys treated with 100 mg/kg 2DG or vehicle only at each of the time points described in A. The volume of the 2DG–treated cystic kidneys is significantly reduced both 1 and 2 months after treatment. The power of the study was 0.93. (D) BUN was evaluated on the blood withdrawn from the tails of the animals at each time point in which MRIs were acquired plus at euthanasia 2 weeks after the last MRI, showing a trend to renal function improvement in cystic animals on 2DG treatment compared with vehicle–treated (NaCl) cystic animals. (E) Images of cystic and control kidneys treated as described above and collected 2 weeks after the last MRI show a significant reduction of volume after 2DG treatment. The best example is shown. (F) Percentage of kidney weight to total body weight in the cystic or control mice treated as described above. (G) Graph showing the relation between the kidney to total body weight versus the TKV evaluated by MRI shows a linear correlation (r2=0.95). NS indicates P≥0.05. Scale bars, 1 cm in A and B; 5 mm in E. *P<0.05 determined using the Mann–Whitney test for C and F; ***P<0.001 determined using the Mann–Whitney test for C and F.
Figure 4.
Figure 4.
Treatment with 2DG ameliorates cystic kidney disease in the long-term model without evident signs of toxicity. (A) Representative histologic pictures of treated cystic (Pkd1ΔC/floxTmCre) kidneys as defined in Figure 1A with 2DG or vehicle (NaCl) only reveal a marked reduction in cystic burden in the 2DG-treated kidneys. (B) Cystic index evaluated in kidneys from cystic (Pkd1ΔC/floxTmCre) animals treated with either 2DG or vehicle (NaCl) only as described in A. (C) Key inflammation genes were upregulated in untreated cystic (Pkd1ΔC/floxTmCre) compared with control kidneys. With 2DG, a trend of reduction (CD15 and CD68) or significant reduction (CD45) could be observed. Hprt expression was used as a normalizer for total cell number. (D) Immunohistochemistry confirmed a significant reduction in the number of CD45-positive cells per acquired field (350×435 μm) in 2DG–treated cystic kidneys compared with NaCl-treated tissues; ten fields were acquired in one renal medial section from three different animals. (E) 2DG treatment had no significant effect on the total body weight in either controls or mutant mice. (F) Alanine aminotransferase (ALT) and (G) aspartate aminotransferase (AST) values showed no liver toxicity induced by 2DG in any of the animals used. (H) During the standard hidden platform version of the water maze trials, 2DG-treated mice were faster to reach the hidden platform (escape latency) compared with the vehicle-treated littermates. (I) No difference was observed in the annulus crossing during the probe trial in the first day (first 30 seconds) of the reversal phase. Old goal (og) indicates the old platform position, old opposite (oo) specifies the new opposite position of the platform, and old left (ol) and old right (or) show the quadrant at the left and the right of the old goal, respectively. (J) Representative images of heart sections of NaCl- (n=6) and 2DG-treated (n=9) mice stained with Hematoxylin-Eosin showing absence of vacuolization caused by 2DG (upper panel). Representative brain coronal sections (5 µm) of NaCl (n=5) and 2DG-treated (n=6) mice stained with Hematoxylin-Eosin show absence of differences (lower panel). Cortical thickness (CC) and the hippocampal region (Hip) are indicated. NS indicates P≥0.05. Scale bars, 100 µm in J, upper panel; 1 mm in J, lower panel. *P<0.05 determined using the Mann–Whitney test for B and D, t test for C, and ANOVA for H and I; **P<0.01 determined using the Mann–Whitney test for B and D, t test for C, and ANOVA for H and I; ***P<0.001 determined using the Mann–Whitney test for B and D, t test for C, and ANOVA for H and I.

References

    1. Torres VE, Harris PC, Pirson Y: Autosomal dominant polycystic kidney disease. Lancet 369: 1287–1301, 2007 - PubMed
    1. Harris PC, Torres VE: Polycystic kidney disease. Annu Rev Med 60: 321–337, 2009 - PMC - PubMed
    1. Boletta A: Emerging evidence of a link between the polycystins and the mTOR pathways. PathoGenetics 2: 6, 2009 - PMC - PubMed
    1. Grantham JJ, Geiser JL, Evan AP: Cyst formation and growth in autosomal dominant polycystic kidney disease. Kidney Int 31: 1145–1152, 1987 - PubMed
    1. Gattone VH 2nd, Wang X, Harris PC, Torres VE: Inhibition of renal cystic disease development and progression by a vasopressin V2 receptor antagonist. Nat Med 9: 1323–1326, 2003 - PubMed

Publication types