Review
. 2016 May;4(2):96-106.
doi: 10.1093/gastro/gov057. Epub 2015 Nov 3.

Imaging panorama in postoperative complications after liver transplantation

Affiliations
Review

Imaging panorama in postoperative complications after liver transplantation

Binit Sureka et al. Gastroenterol Rep (Oxf). 2016 May.

Abstract

The liver is the second most-often transplanted solid organ after the kidney, so it is clear that liver disease is a common and serious problem around the globe. With the advancements in surgical, oncological and imaging techniques, orthotopic liver transplantation has become the first-line treatment for many patients with end-stage liver disease. Ultrasound, and Doppler are the most economical and cost-effective imaging modalities for evaluating postoperative fluid collections and vascular complications. Computed tomography (CT) is used to confirm the findings of ultrasound and look for pulmonary complications. Magnetic resonance imaging (MRI) is used for the diagnosis of biliary complications, bile leaks and neurological complications. This article illustrates the imaging options for diagnosing the various complications that can be encountered in the postoperative period after liver transplantation.

Keywords: imaging; liver transplant; postoperative complications.


Figures

Figure 1.
Figure 1.
Hepatic artery thrombosis. (A) Coronal-oblique MIP contrast-enhanced CT images acquired in the arterial phase demonstrating abrupt termination of the hepatic artery (HA) at the anastomotic site (interrupted arrow) with non-visualization of the intrahepatic branches of HA. (B) Post-thrombolysis image showing opacification of the segment of the HA beyond the anastomosis (interrupted arrow) as well as the intrahepatic arteries (solid arrows).
Figure 2.
Figure 2.
Portal vein thrombosis. (A) Coronal-oblique MIP image demonstrating thrombosis of the extrahepatic portal vein (interrupted arrow) as well as its intrahepatic branches (solid arrows). (B) Post-thrombolysis DSA image showing recanalization of the main portal vein (interrupted arrow) and the intrahepatic portal venous radicals (solid arrow). Arrowheads denote the percutaneously placed angiographic catheter with its tip at the splenoportal confluence.
Figure 3.
Figure 3.
Portal vein stenosis. (A) Coronal-oblique MIP image showing short-segment stenosis of the portal vein (arrow) at the anastomotic site. (B) Post-angioplasty and stenting DSA image demonstrating recanalization of the vein (arrow).
Figure 4.
Figure 4.
Anastomotic biliary stricture. (A) Coronal thick-slab three-dimensional MRCP image demonstrating a stricture at the choledocho-choledochal anastomotic site (solid arrow) with resultant moderate upstream dilatation of the intrahepatic biliary radicals (interrupted arrows). The common bile duct (arrowhead) is also mildly dilated. (B) Post-percutaneous transhepatic biliary drainage (PTBD) fluoroscopic image showing drainage catheters in the anterior and posterior sectoral ducts (arrow) with their tips in the second part of duodenum (arrowheads).
Figure 5.
Figure 5.
Seroma. Ultrasound image showing collection in the perihepatic location (arrow).
Figure 6.
Figure 6.
Hematoma. (A) Axial non-contrast CT scan image showing collection in the subhepatic location with hyperdense contents within (arrow). (B) Ultrasound image showing collection (arrows) with thick internal septations and internal echoes.
Figure 7.
Figure 7.
Intestinal perforation. (A,B) Axial non-contrast CT scan images showing free extraluminal air in the peritoneal cavity (arrows) and active contrast extravasation in a case of intestinal perforation (arrowhead).
Figure 8.
Figure 8.
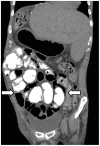
Internal hernia. Coronal oblique reformatted image showing clumped and dilated small bowel loops in a case of internal hernia.
Figure 9.
Figure 9.
Stercoral colitis. Axial CT image showing dilated colon with impacted fecal material, focal inflammatory wall thickening (black arrow) and fat stranding (white arrow).
Figure 10.
Figure 10.
Pleural effusion. Ultrasound image showing right pleural effusion (arrow) with passive atelectasis.
Figure 11.
Figure 11.
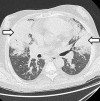
Fungal pneumonia. Axial high resolution CT lung window scan showing Aspergillus infection in the form of dense mass-like consolidation (arrows) in bilateral lungs with surrounding areas of ground-glass opacities.
Figure 12.
Figure 12.
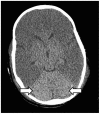
Cerebral edema. Axial non-contrast CT head showing diffuse hypodense cerebral parenchyma with loss of grey-white matter differentiation and classical white cerebellum sign (arrows).
Figure 13.
Figure 13.
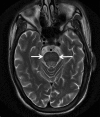
Central pontine myelinolysis. Axial T2-weighted MR brain showing central hyperintensity in pons in a case of pontine myelinolysis.

References

    1. Davis GL, Alter MJ, El-Serag H, et al. Aging of hepatitis C virus (HCV)-infected persons in the United States: a multiple cohort model of HCV prevalence and disease progression. Gastroenterology 2010;138:513–21. - PubMed
    1. Chung W. The cost of liver disease in Korea: methodology, data, and evidence. Clin Mol Hepatol 2015;21:14–21. - PMC - PubMed
    1. Neff GW, Duncan CW, Schiff ER. The current economic burden of cirrhosis. Gastroenterol Hepatol (N Y) 2011;7:661–71. - PMC - PubMed
    1. Ammori JB, Pelletier SJ, Lynch R, et al. Incremental costs of post-liver transplantation complications. J Am Coll Surg 2008;206:89–95. - PubMed
    1. Crossin JD, Muradali D, Wilson SR. US of liver transplants: normal and abnormal. Radiographics 2003;23:1093–114. - PubMed

LinkOut - more resources