

doi: 10.1002/psp4.12015.
Epub 2015 Sep 22.
Establishing Good Practices for Exposure-Response Analysis of Clinical Endpoints in Drug Development
Affiliations
- PMID: 26535157
- PMCID: PMC4625861
- DOI: 10.1002/psp4.12015
Item in Clipboard
Establishing Good Practices for Exposure-Response Analysis of Clinical Endpoints in Drug Development
CPT Pharmacometrics Syst Pharmacol.
2015 Oct.
Abstract
This tutorial aims at promoting good practices for exposure-response (E-R) analyses of clinical endpoints in drug development. The focus is on practical aspects of E-R analyses to assist modeling scientists with a process of performing such analyses in a consistent manner across individuals and projects and tailored to typical clinical drug development decisions. This includes general considerations for planning, conducting, and visualizing E-R analyses, and how these are linked to key questions.
Figures
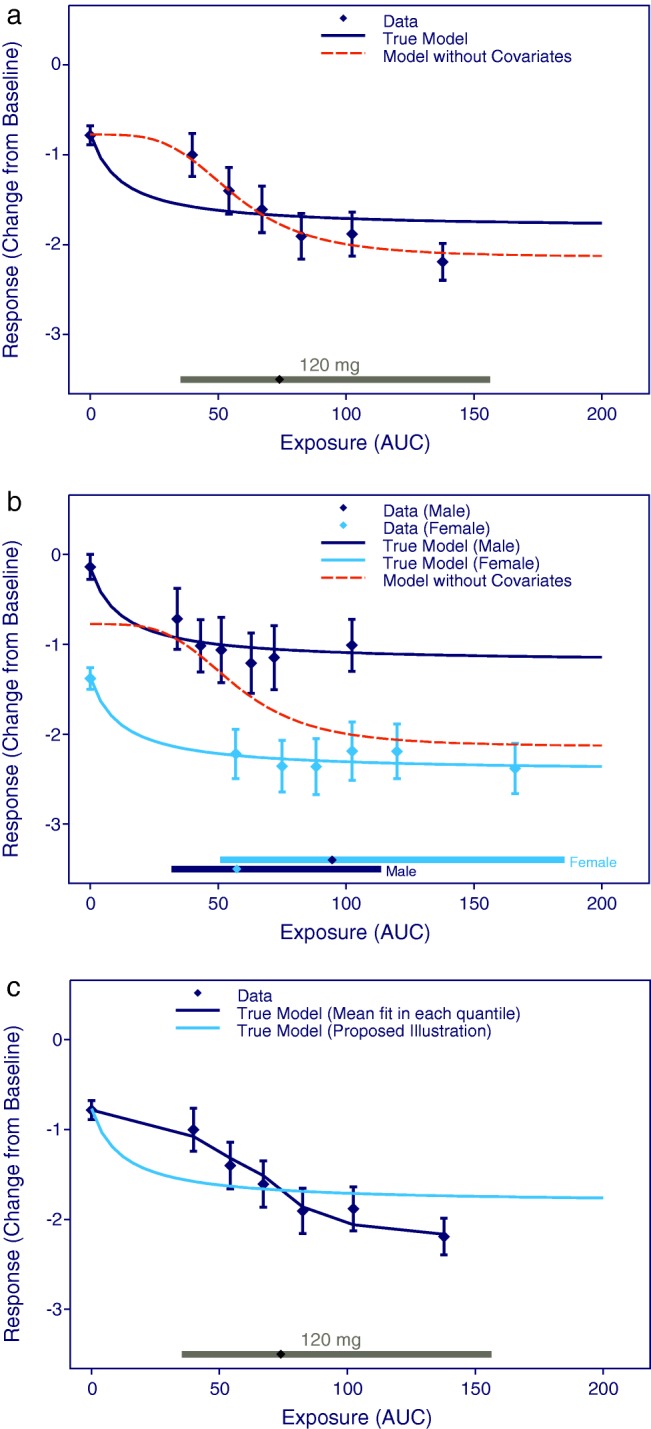
Visualization of E-R relationships (a) without and (b) with stratification for a confounding covariate (gender). (c) The proposed method for model visualization compared to the model fit for each quantile. Data points are mean effects with 95% CIs for quantiles of AUC values and the lines represent the estimated E-R relationships. The horizontal lines with diamonds along the abscissa represent medians and 90% exposure ranges at each dose level. The three panels are based on identical datasets generated by simulation of 1,000 subjects equally distributed between males and females.
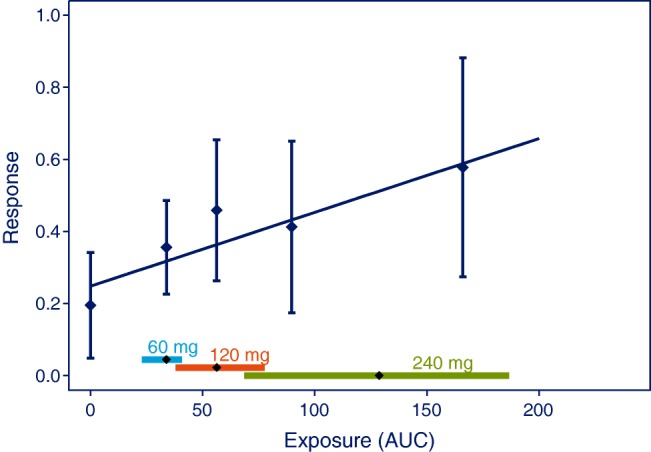
Plot to visualize a prespecified analysis for establishing supportive evidence of effectiveness. Data points are mean and 95% CI of effects for quantiles of AUC values. The horizontal lines with diamonds along the abscissa represent medians and 90% exposure ranges at each dose level. Data was simulated with 8 active + 4 placebo subjects at the two lower dose levels, and 16 active + 8 placebo subjects at the highest dose level.
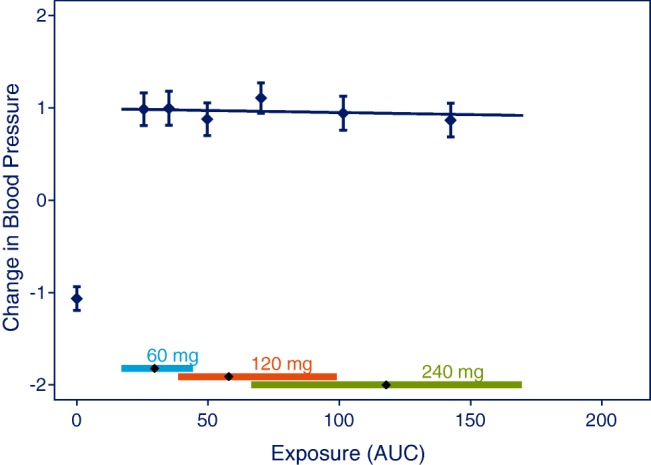
Plot to visualize the analysis used to test if already established effects increase with dose in the studied dose range. Data points are mean and 95% CI of effects for quantiles of AUC values. The vertical lines with diamonds along the abscissa represent medians and 90% exposure ranges at each dose level. Data were simulated with 240 subjects at each dose level or placebo.
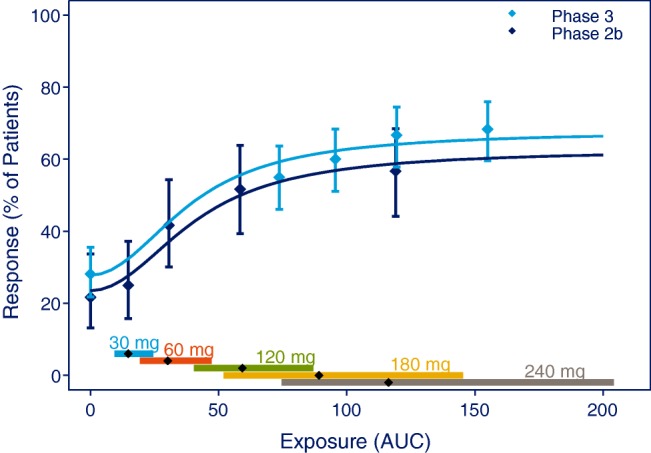
E-R relationship obtained from phase II and phase III trials. Data points are mean effects with 95% CI for quantiles of AUC values and the line represents the estimated E-R relationship. The vertical lines with diamonds along the abscissa represent medians and 90% exposure ranges at each dose level. Data were a simulated phase IIb trial including 60 subjects at each dose level 30, 60, 120, 240 mg, or placebo, and a simulated phase III trial randomizing 160:160:320 subjects to placebo, 180 mg, or 240 mg.
References
-
- Pinheiro J. Duffull S. Exposure response—getting the dose right. Pharmaceut. Statist. 2009;8:173–175. & ) - PubMed
-
- Ette EI. Williams PJ. Population pharmacokinetics I: background, concepts, and models. Ann. Pharmacother. 2004;38:1702–1706. & ) - PubMed
-
- Ette EI. Williams PJ. Population pharmacokinetics II: estimation methods. Ann. Pharmacother. 2004;38:1907–1915. & ) - PubMed
-
- Ette EI. Williams PJ. Population pharmacokinetics III: design, analysis, and application of population pharmacokinetic studies. Ann. Pharmacother. 2004;38:2136–2144. & ) - PubMed
-
- Sherwin CMT, Kiang TKL, Spigarelli MG. Ensom MHH. Fundamentals of population pharmacokinetic modeling, validation methods. Clin. Pharmacokinet. 2012;51:573–590. & ) - PubMed
LinkOut - more resources
Full Text Sources
Other Literature Sources
Molecular Biology Databases
