. 2016 Feb;89(2):498-505.
doi: 10.1038/ki.2015.316.

Phenotyping by magnetic resonance imaging nondestructively measures glomerular number and volume distribution in mice with and without nephron reduction

Phenotyping by magnetic resonance imaging nondestructively measures glomerular number and volume distribution in mice with and without nephron reduction

Edwin J Baldelomar et al. Kidney Int. 2016 Feb.

Erratum in

Abstract

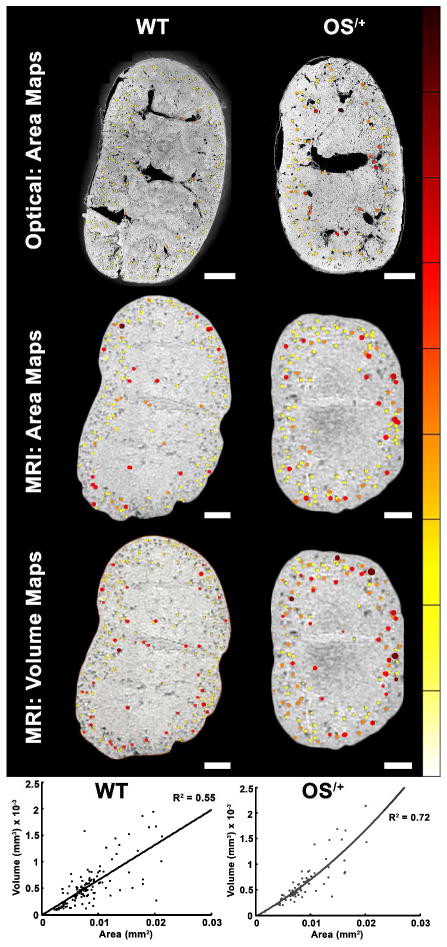
Reduced nephron mass is strongly linked to susceptibility to chronic renal and cardiovascular diseases. There are currently no tools to identify nephropenia in clinical or preclinical diagnostics. Such new methods could uncover novel mechanisms and therapies for chronic kidney disease (CKD) and reveal how variation among traits can affect renal function and morphology. Here we used cationized ferritin (CF)–enhanced MRI (CFE-MRI) to investigate the relationship between glomerular number (Nglom) and volume (Vglom) in kidneys of healthy wild-type mice and mice with oligosyndactylism (Os/+), a model of congenital nephron reduction. Mice were injected with CF and perfused, and the resected kidneys were imaged with 7T MRI to detect CF-labeled glomeruli. CFE-MRI was used to measure the intrarenal distribution of individual glomerular volumes and revealed two major populations of glomeruli distinguished by size. Spatial mapping revealed that the largest glomeruli were located in the juxtamedullary region in both wild-type and Os/+ mice and the smallest population located in the cortex. Os/+ mice had about a 50% reduction and 35% increase of Nglom and Vglom, respectively, in both glomerular populations compared with wild type, consistent with glomerular hypertrophy in the Os/+ mice. Thus, we provide a foundation for whole-kidney, MRI-based phenotyping of mouse renal glomerular morphology and provide new potential for quantitative human renal diagnostics.


Figures

Figure 1
Figure 1
Kidneys labeled with cationized ferritin (CF) were imaged together in a single 3D Magnetic Resonance Image (MRI) scan and separated in post-processing for analysis. Axial image, A, with its corresponding identification-maps, B, show clear CF labeling in all kidneys at 7 Tesla. The axial plane is defined orthogonal to the main B0 magnetic field. Scale bar = 1mm.
Figure 2
Figure 2
Detection of cationized ferritin (CF) labeling in healthy wild type (WT) and oligosyndactylism (Os/+) mice kidneys after retro-orbital injection using immunofluorescence (IF) imaging. Sections were stained with anti-horse spleen ferritin (AHSF) (A and C) and without AHSF (B and D). Both A and C images show fluorescence in the glomerular basement membrane (GBM), indicating CF uptake in WT and Os/+ glomeruli. Sections that were not stained with the AHSF, B and D, showed no GBM labeling.
Figure 3
Figure 3
Stereology was performed on kidneys imaged with magnetic resonance imaging (MRI) for direct comparison of glomerular volume and number. A and C show whole sagittal slice sections of kidneys stained with wheat germ agglutinin (WGA) in wild type (WT) and oligosyndactylism (Os/+) mice, respectively. Glomeruli were identified in both animals (E–H). Overlayed maps (B and D) show all identified glomeruli in each section along with its cortex. It was clear during segmentation/inspection of all kidneys that Os/+ mice had abnormally large glomerular profiles, as seen in G–H, as compared with WT, E–F. (Top row scale bars equal ~.5 mm; Bottom row scale bars equal ~.1 mm)
Figure 4
Figure 4
Individual glomerular volumes measured with cationic ferritin enhanced magnetic resonance imaging (CFE-MRI) were calculated using line profile widths at different heights of the line profile and volumes were calculated based on the assumption that glomeruli are spherical. Widths were taken from 50%, 55%, 60%, and 75% of total profile height and corresponding volumes were calculated using the width as glomerular diameter. Full width at 55% height matched stereology the best for both wild type (WT) and oligosyndactylism (Os/+) mice. (A) Top figure and inset (B) shows how CF labeled glomeruli in MRI before and after image resampling and how line profiles were used to measure IGV. B and C show the corresponding mean distribution of all calculated glomerular volumes. Both WT and OS/+ kidneys exhibited bimodal distributions. (Symbol Meanings: M – Median Value; M̄ – Mean Value; * - Mean Value from Stereology)
Figure 5
Figure 5
A, Glomerular number (Nglom) and volume (Vglom) were measured in wild type (WT) and oligosyndactylism (Os/+) mice kidneys by histology/stereology, acid maceration and by cationized ferritin enhanced magnetic resonance imaging (CFE-MRI). The number of glomeruli per total volume (NV) was calculated using the formula NV = k/β × NA1.5/VV0.5 with constant values listed in Methods. Cortical volume (VCortex) was assessed from segmentation of 3D-MRI images based on the difference signal magnitude between cortex and medulla in MRI. The number of glomeruli per kidney (Nglom) was calculated by Nglom = NV × VCortex. Vglom was calculated by Vglom = (Vglom/VKidney) / (Nglom/VKidney) with Vglom/VKidney defined as VV and the relation AA = VV (VV = Particle volume density; AA = Particle area density; NA = Number of glomeruli per cortex section). Vglom in MRI was defined from mean IGV calculated from line profiles through each identified glomerulus. Profile widths of glomeruli were measured in 3D, and glomerular volume was calculated from this width. Measurements performed with MRI agreed with estimates obtained with stereology and acid maceration. As shown in B, Vglom trends lower with increasing Nglom using both MRI and stereology.
Figure 6
Figure 6
Intrarenal glomerular volume distributions in all mice exhibited bimodal distributions of small (VG-Low) and larger (VG-High) glomeruli. A shows a representative data set for both wild type (WT) and oligosyndactylism (Os/+) mice kidneys and shows an overlay of the Gaussian model with measured data. The inset also shows volume distributions for all other kidneys with the double Gaussian curve fit overlain. We obtained mean values (Vglom) and standard deviations (sDev-Vglom) from the double Gaussian model fitted to all volume distributions. B shows the correlations of Nglom with Vglom and Nglom with sDev-Vglom for VG-Low and VG-High in WT and Os/+ kidneys.
Figure 7
Figure 7
Spatial distribution of glomerular size. Sagittal image slices from MRI and histological sections were taken from similar locations in wild type (WT) (Top) and oligosyndactylism (Os/+) (Bottom) kidneys and their glomerular areas and volume profiles overlain. The areas of the profiles from both magnetic resonance imaging (MRI) and stereology images appeared larger and denser in the Os/+ kidney compared with WT. Both MRI and stereology indicated that Os/+ kidneys had on average larger glomeruli based on their profile area, and an increased percentage of larger glomeruli compared with the WT kidney. Individual glomerular volumes measured from glomerular centroids were calculated and rendered in 3D with the original MR dataset. As shown in the sagittal MR images with maps of the glomeruli colored by volume, the Os/+ mice had at least a 7% larger number of glomeruli with increased volume. There was a ~ 60% correlation between MRI-based measurements of area and volume for both WT and Os/+ kidneys using a second-order polynomial fit. Largest glomeruli were most frequently observed in the juxtamedulary areas in both WT and Os/+ kidneys. (Scale bars equal ~ 0.5 mm)

References

    1. Keller G, Zimmer G, Mall G, et al. Nephron Number in Patients with Primary Hypertension. N Eng J Med. 2002;348:1–8. - PubMed
    1. Moritz KM, Wintour EM, Black MJ, et al. Factors Influencing Mammalian Kidney Development: Implications for Health in Adult Life. Adv Anat Embryol Cell Biol. 2008;196:1–78. - PubMed
    1. Freese A, Wehland M, Freese F, et al. Genetic low nephron number hypertension is associated with altered expression of osteopontin and CD44 during nephrogenesis. J Perinat Med. 2013;41:295–299. - PubMed
    1. Hayman JMJ, Johnston SM. Experiments on the relation of creatinine and urea clearance tests of kidney function and the number of glomeruli in the human kidney obtained at autopsy. J Clin Invest. 1933;12:877–884. - PMC - PubMed
    1. Collins AJ. Excerpts from the United States Renal Data System 2004 Annual Data Report: Atlas of end-stage renal disease in the United States. 2005;45:A5–A7. - PubMed

Publication types