. 2015 Nov 4;10(11):e0141966.
doi: 10.1371/journal.pone.0141966. eCollection 2015.

Loss of CD24 in Mice Leads to Metabolic Dysfunctions and a Reduction in White Adipocyte Tissue

Affiliations

Loss of CD24 in Mice Leads to Metabolic Dysfunctions and a Reduction in White Adipocyte Tissue

Nicholas A Fairbridge et al. PLoS One. .

Abstract

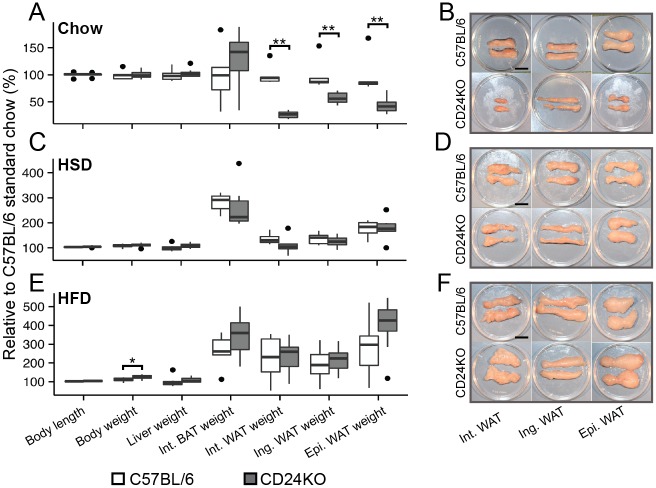
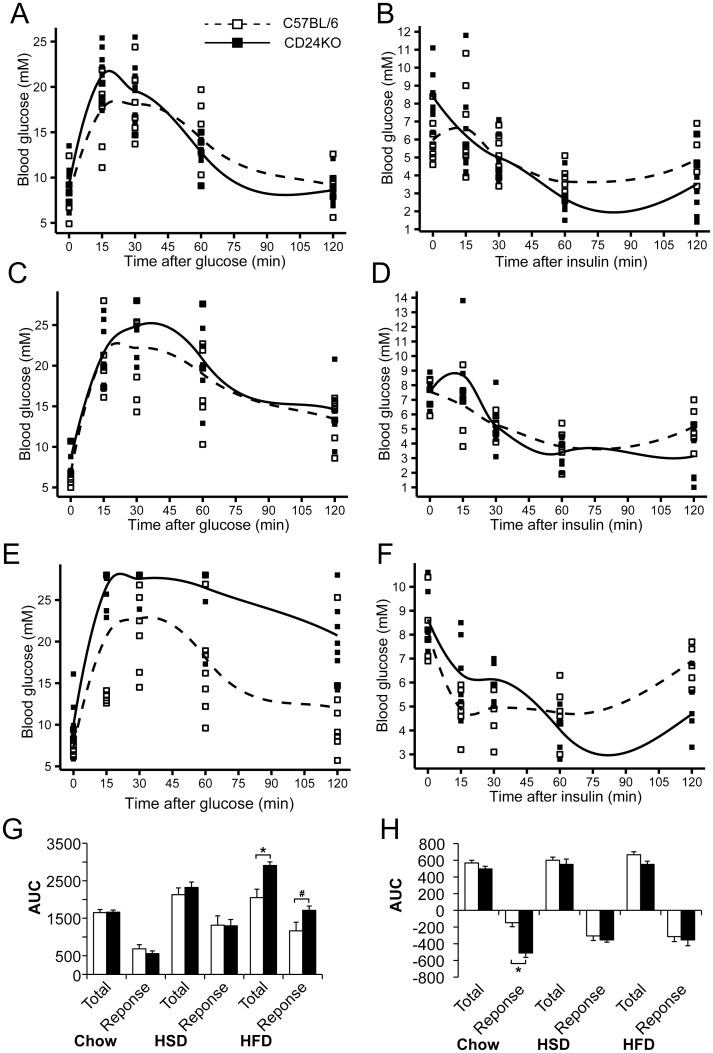
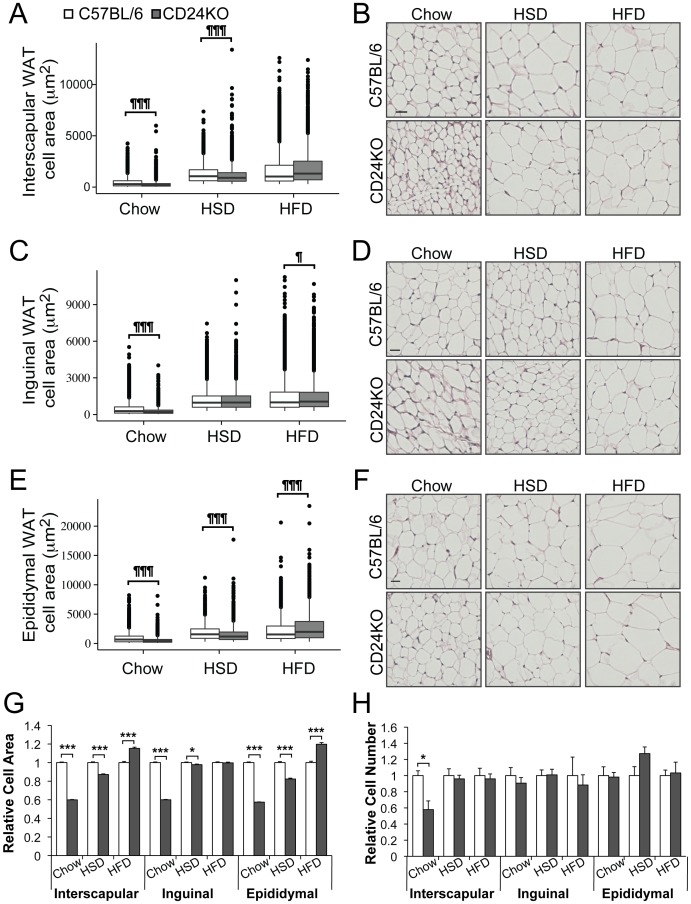
CD24 is a glycophosphatidylinositol (GPI)-linked cell surface receptor that is involved in regulating the survival or differentiation of several different cell types. CD24 has been used to identify pre-adipocytes that are able to reconstitute white adipose tissue (WAT) in vivo. Moreover, we recently found that the dynamic upregulation of CD24 in vitro during early phases of adipogenesis is necessary for mature adipocyte development. To determine the role of CD24 in adipocyte development in vivo, we evaluated the development of the inguinal and interscapular subcutaneous WAT and the epididymal visceral WAT in mice with a homozygous deletion of CD24 (CD24KO). We observed a significant decrease in WAT mass of 40% to 74% in WAT mass from both visceral and subcutaneous depots in male mice, with no significant effect in female mice, compared to wild-type (WT) sex- and age-matched controls. We also found that CD24KO mice had increased fasting glucose and free fatty acids, decreased fasting insulin, and plasma leptin. No major differences were observed in the sensitivity to insulin or glucose, or in circulating triglycerides, total cholesterol, HDL-cholesterol, or LDL-cholesterol levels between WT and CD24KO mice. Challenging the CD24KO mice with either high sucrose (35%) or high fat (45%) diets that promote increased adiposity, increased WAT mass and fasting insulin, adiponectin and leptin levels, as well as reduced the sensitivity to insulin and glucose, to the levels of WT mice on the same diets. The CD24-mediated reduction in fat pad size was due to a reduction in adipocyte cell size in all depots with no significant reduction pre-adipocyte or adipocyte cell number. Thus, we have clearly demonstrated that the global absence of CD24 affects adipocyte cell size in vivo in a sex- and diet-dependent manner, as well as causing metabolic disturbances in glucose homeostasis and free fatty acid levels.


Conflict of interest statement

Competing Interests: The authors have declared that no competing interests exist.

Figures

Fig 1
Fig 1. CD24KO male mice have reduced fat and increased lean and bone weight compared to wild-type male mice.
A. Total fat weight, B. percent fat weight, C. total lean weight, D. percent lean weight, E. bone weight, F. percent bone weight, and G. estimated total body weight from dual X-ray absorptiometry (DEXA) scans of male wild-type C57BL/6 and CD24KO mice at 5, 9, and 12 weeks of age on standard show diet. Trend lines display the Loess conditional means and squares represent individual animals. Statistical significance determined by repeated measures ANOVA, n = 6, interaction effects between genotype (G) and time (T) are indicated as P(G*T), main effects of genotype are shown as P(G) and the effect of time within each genotype is shown as P(G[T]).
Fig 2
Fig 2. Impaired fat mass accumulation in CD24KO affects all WAT depots and is rescued by adiposity-promoting diets.
Male CD24KO and wild-type mice were fed A-B. standard chow diet (chow), C-D. high sucrose diet (HSD), or E-F. high fat diet (HFD) for 5 weeks starting at 4 weeks of age. A, C, E. Relative body length, total weight, and weights of liver, interscapular (Int.) brown adipose tissue (BAT), Int. white adipose tissue (WAT), inguinal (Ing.) WAT, epididymal (Epi.) WAT are shown. Data are relative to the mean of the WT chow fed group and are shown as box-and-whisker plots. Statistical significance was determined by Wilcoxon rank sum, n = 5–9, *P<0.05, **P<0.01. B, D, F. Representative images of whole WAT from Int, Ing, and Epi WAT depots from 9-week-old CD24KO and WT male mice. Scale bar = 1 cm
Fig 3
Fig 3. CD24KO male mice show altered glucose and insulin tolerance that is affected by adiposity-promoting diets.
Male CD24KO and WT C57BL/6 mice were fed A-B. standard chow diet (chow), C-D. high sucrose diet (HSD), and E-F. high fat diet (HFD), as described in Fig 2. A, C, E. Blood glucose was determined after a 6 h fast and then 15 min, 30 min, 60 min, and 120 min following intraperitoneal injection of 2 mg/g glucose for glucose tolerance test. B, E, F. Blood glucose was determined after a 4 h fast and then 15 min, 30 min, 60 min, and 120 min following intraperitoneal injection of 1 mU/g bovine insulin for insulin tolerance test. Trend lines display the Loess conditional means and squares represent individual animals. The total glucose load (Total) and the glucose response from control levels (Response) for G. GTT and H. ITT were determined and compared between genotypes by Wilcoxon rank sum, *P<0.05, #P = 0.09, n = 7–9 animals per group for glucose tolerance and 6–8 for insulin tolerance.
Fig 4
Fig 4. Adipocytes from CD24KO mice are hypotrophic.
Male CD24KO and wild-type C57BL/6 mice were fed as described in Fig 2. At 9 weeks of age, A-B. interscapular WAT depots, C-D. inguinal WAT, and E-F. epididymal WAT were analyzed by H&E staining to determine adipocyte size. A, C, E. Data are shown as box-and-whisker plots with B, D, F. representative H&E images. Scale bar = 30 μm. Statistical differences in the distributions between WT and CD24KO were determined using the Kolmogorov-Smirnov test, P<0.05, ¶¶¶P<0.001. G. Relative cell area compared to the WT on each diet from the respective WAT are shown. H. The relative cell number compared to the WT on each diet from the respective WAT is shown. Statistical significant was determined by Wilcoxon rank sum *P<0.05, ***P<0.001. n = 5–7, ≥225 cells were analyzed per animal.

Similar articles

Cited by

References

    1. Chaput JP, Doucet E, Tremblay A (2012) Obesity: a disease or a biological adaptation? An update. Obes Rev 13: 681–691. 10.1111/j.1467-789X.2012.00992.x - DOI - PubMed
    1. Rochford JJ (2014) Mouse models of lipodystrophy and their significance in understanding fat regulation. Curr Top Dev Biol 109: 53–96. 10.1016/B978-0-12-397920-9.00005-6 - DOI - PubMed
    1. Berry DC, Stenesen D, Zeve D, Graff JM (2013) The developmental origins of adipose tissue. Development 140: 3939–3949. 10.1242/dev.080549 - DOI - PMC - PubMed
    1. Martin S (2013) Caveolae, lipid droplets, and adipose tissue biology: pathophysiological aspects. Horm Mol Biol Clin Investig 15: 11–18. 10.1515/hmbci-2013-0035 - DOI - PubMed
    1. Spalding KL, Arner E, Westermark PO, Bernard S, Buchholz BA, Bergmann O et al. (2008) Dynamics of fat cell turnover in humans. Nature 453: 783–787. 10.1038/nature06902 - DOI - PubMed

Publication types