

Estimation of evolutionary parameters using short, random and partial sequences from mixed samples of anonymous individuals
- PMID: 26536860
- PMCID: PMC4634753
- DOI: 10.1186/s12859-015-0810-y
Estimation of evolutionary parameters using short, random and partial sequences from mixed samples of anonymous individuals
Abstract
Background: Over the last decade, next generation sequencing (NGS) has become widely available, and is now the sequencing technology of choice for most researchers. Nonetheless, NGS presents a challenge for the evolutionary biologists who wish to estimate evolutionary genetic parameters from a mixed sample of unlabelled or untagged individuals, especially when the reconstruction of full length haplotypes can be unreliable. We propose two novel approaches, least squares estimation (LS) and Approximate Bayesian Computation Markov chain Monte Carlo estimation (ABC-MCMC), to infer evolutionary genetic parameters from a collection of short-read sequences obtained from a mixed sample of anonymous DNA using the frequencies of nucleotides at each site only without reconstructing the full-length alignment nor the phylogeny.
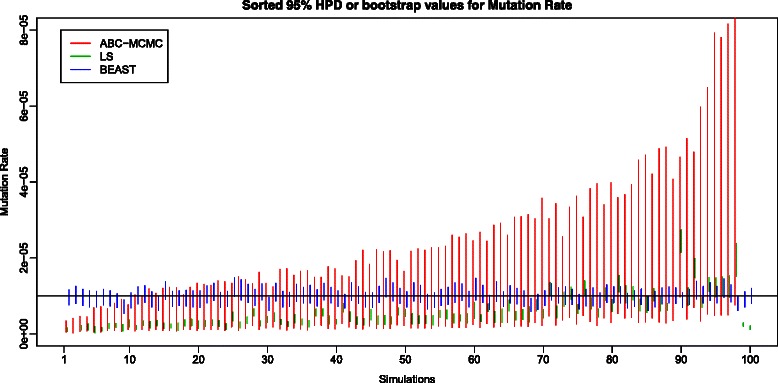
Results: We used simulations to evaluate the performance of these algorithms, and our results demonstrate that LS performs poorly because bootstrap 95% Confidence Intervals (CIs) tend to under- or over-estimate the true values of the parameters. In contrast, ABC-MCMC 95% Highest Posterior Density (HPD) intervals recovered from ABC-MCMC enclosed the true parameter values with a rate approximately equivalent to that obtained using BEAST, a program that implements a Bayesian MCMC estimation of evolutionary parameters using full-length sequences. Because there is a loss of information with the use of sitewise nucleotide frequencies alone, the ABC-MCMC 95% HPDs are larger than those obtained by BEAST.
Conclusion: We propose two novel algorithms to estimate evolutionary genetic parameters based on the proportion of each nucleotide. The LS method cannot be recommended as a standalone method for evolutionary parameter estimation. On the other hand, parameters recovered by ABC-MCMC are comparable to those obtained using BEAST, but with larger 95% HPDs. One major advantage of ABC-MCMC is that computational time scales linearly with the number of short-read sequences, and is independent of the number of full-length sequences in the original data. This allows us to perform the analysis on NGS datasets with large numbers of short read fragments. The source code for ABC-MCMC is available at https://github.com/stevenhwu/SF-ABC.
Figures


References
Publication types
MeSH terms
LinkOut - more resources
Full Text Sources
Other Literature Sources
