. 2015 Nov 3;7(12):3226-38.
doi: 10.1093/gbe/evv212.

Inferring Indel Parameters using a Simulation-based Approach

Affiliations

Inferring Indel Parameters using a Simulation-based Approach

Eli Levy Karin et al. Genome Biol Evol. .

Abstract

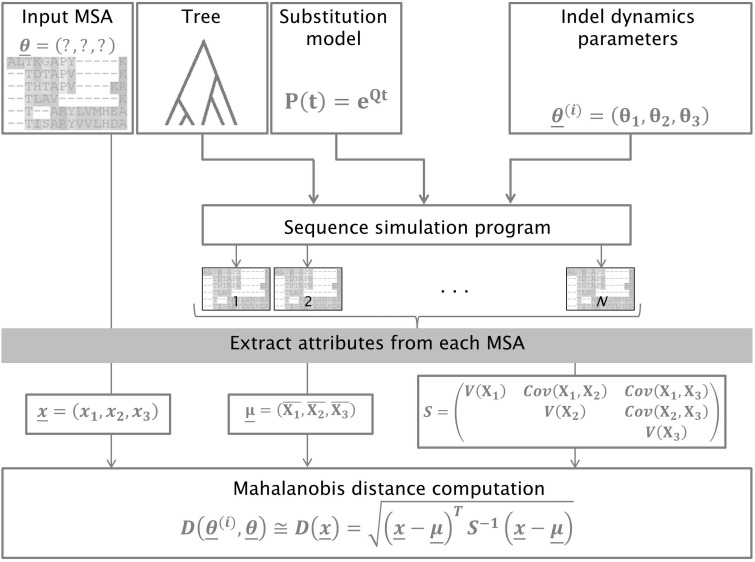
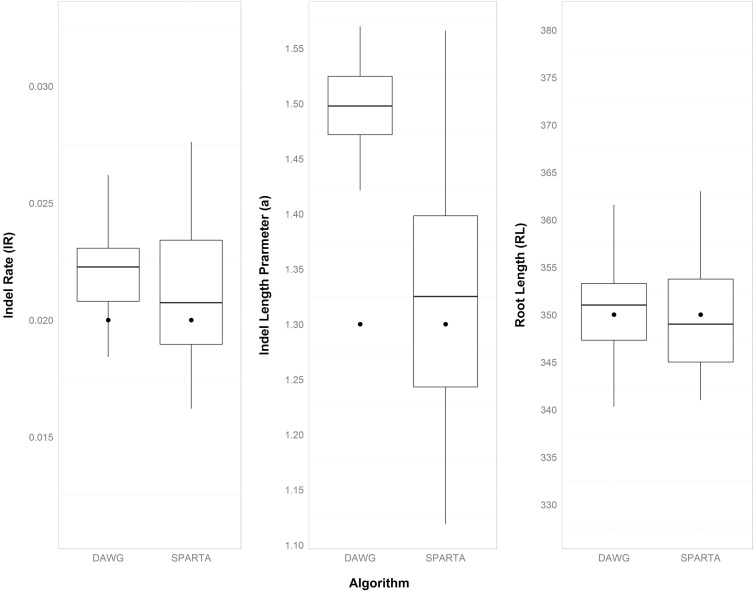
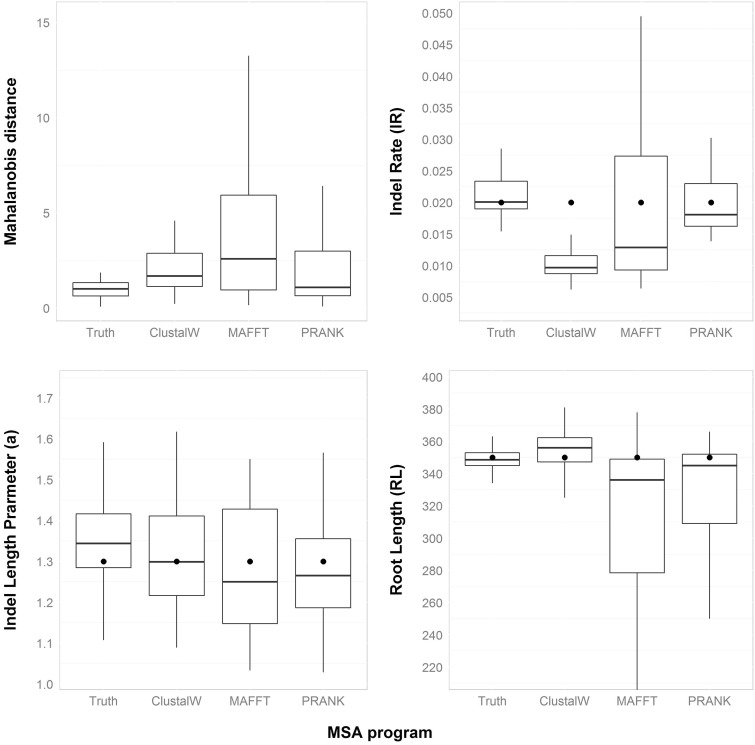
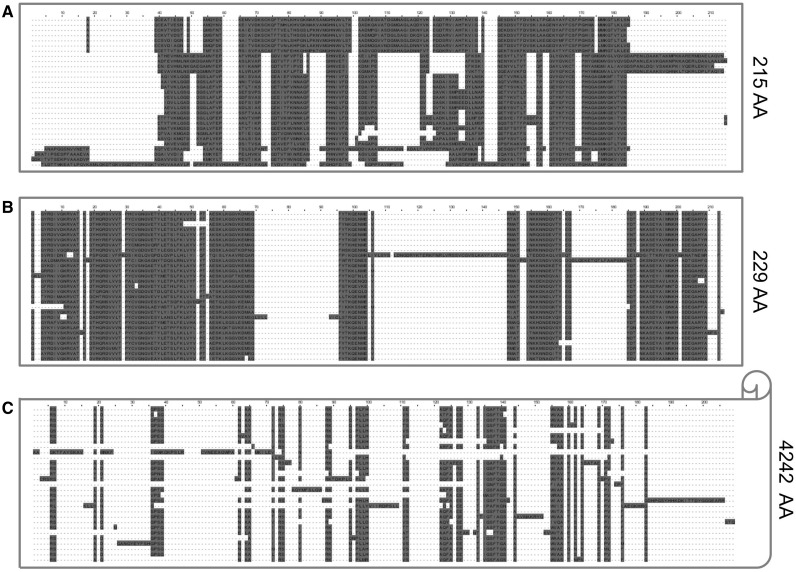
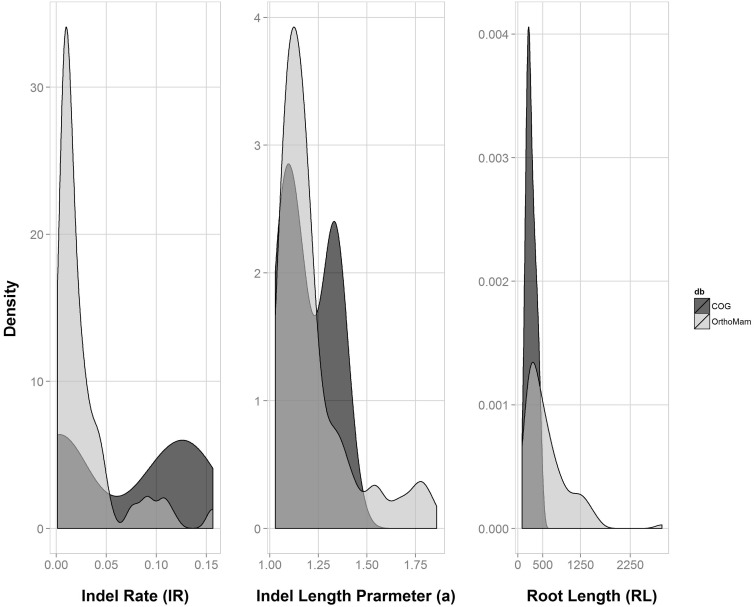
In this study, we present a novel methodology to infer indel parameters from multiple sequence alignments (MSAs) based on simulations. Our algorithm searches for the set of evolutionary parameters describing indel dynamics which best fits a given input MSA. In each step of the search, we use parametric bootstraps and the Mahalanobis distance to estimate how well a proposed set of parameters fits input data. Using simulations, we demonstrate that our methodology can accurately infer the indel parameters for a large variety of plausible settings. Moreover, using our methodology, we show that indel parameters substantially vary between three genomic data sets: Mammals, bacteria, and retroviruses. Finally, we demonstrate how our methodology can be used to simulate MSAs based on indel parameters inferred from real data sets.

Keywords: Mahalanobis distance; alignments; indels; phylogeny; simulations.


Figures

F<sc>ig</sc>. 1.—
Fig. 1.—
SPARTA methodology uses Mahalanobis distance to measure the fit of proposed parameters to input data. Presented is a single search step, in which the distance between a proposed set of parameters, Θ(i), and the true unknown parameters Θ is computed. Standard hill-climbing heuristics are used to search for a set of parameters that minimizes the distance between simulated data and input data.
F<sc>ig</sc>. 2.—
Fig. 2.—
Inference accuracy is positively correlated with the number of simulated MSAs (N) used in each search step. Fifty “real” MSAs were simulated using the basic parameter configuration (see Materials and Methods). The parameters of each of these MSAs were then searched for, with different values of N. Panel A depicts the Mahalanobis distance and the computation time as a function of N and panel B shows how each of the inferred parameters depends on N. The real parameter values are marked as bold points.
F<sc>ig</sc>. 3.—
Fig. 3.—
SPARTA’s inference is better than lambda.pl’s. Fifty “real” MSAs simulated using the basic parameter configuration were given as input to SPARTA as well as to Dawg’s lambda.pl script. The real parameter values are marked as bold points.
F<sc>ig</sc>. 4.—
Fig. 4.—
SPARTA’s inference is robust to biases introduced by MSA programs. Fifty sequence data sets obtained using the basic parameter configuration were aligned by either ClustalW, MAFFT, or PRANK. The MSAs computed by each alignment program were given as input to SPARTA. The real parameter values are marked as bold points. As reference, we also present the inferred values using the “true” MSAs generated by INDELible.
F<sc>ig</sc>. 5.—
Fig. 5.—
SPARTA can be used to simulate MSAs similar to a target MSA. The plot depicts three MSAs. The real Azurin MSA (panel A), a simulated MSA using the parameters the algorithm inferred for the Azurin MSA (IR = 0.0135, a = 1.325, RL = 119; panel B) and a simulated MSA using INDELible’s default parameters (as described in the Materials and Methods section) (panel C). As the MSA simulated based on the default parameters is 4,242 amino acids long, only the first 200 columns are presented in the plot.
F<sc>ig</sc>. 6.—
Fig. 6.—
Distribution of parameter values in real data sets. The algorithm was run on 498 mammalian MSAs obtained from the OrthoMam database as well as 100 COG MSAs. The panels depict the distribution of the inferred parameter values in cases where the P value was not significant (P > 0.05; 104 OrthoMam genes and 28 COG genes).
F<sc>ig</sc>. 7.—
Fig. 7.—
PRANK MSA of the vif protein across 50 HIV-1 samples.

References

    1. Abhiman S, Daub CO, Sonnhammer EL. 2006. Prediction of function divergence in protein families using the substitution rate variation parameter alpha. Mol Biol Evol. 23:1406–1413. - PubMed
    1. Abram ME, Ferris AL, Shao W, Alvord WG, Hughes SH. 2010. Nature, position, and frequency of mutations made in a single cycle of HIV-1 replication. J Virol. 84:9864–9878. - PMC - PubMed
    1. Barry D, Hartigan JA. 1987. Asynchronous distance between homologous DNA sequences. Biometrics 43:261–276. - PubMed
    1. Bay RA, Bielawski JP. 2011. Recombination detection under evolutionary scenarios relevant to functional divergence. J Mol Evol. 73:273–286. - PubMed
    1. Bay RA, Bielawski JP. 2013. Inference of functional divergence among proteins when the evolutionary process is non-stationary. J Mol Evol. 76:205–215. - PubMed

Publication types

LinkOut - more resources