. 2015 Nov 5:6:8712.
doi: 10.1038/ncomms9712.

Genetic interactions contribute less than additive effects to quantitative trait variation in yeast

Affiliations

Genetic interactions contribute less than additive effects to quantitative trait variation in yeast

Joshua S Bloom et al. Nat Commun. .

Abstract

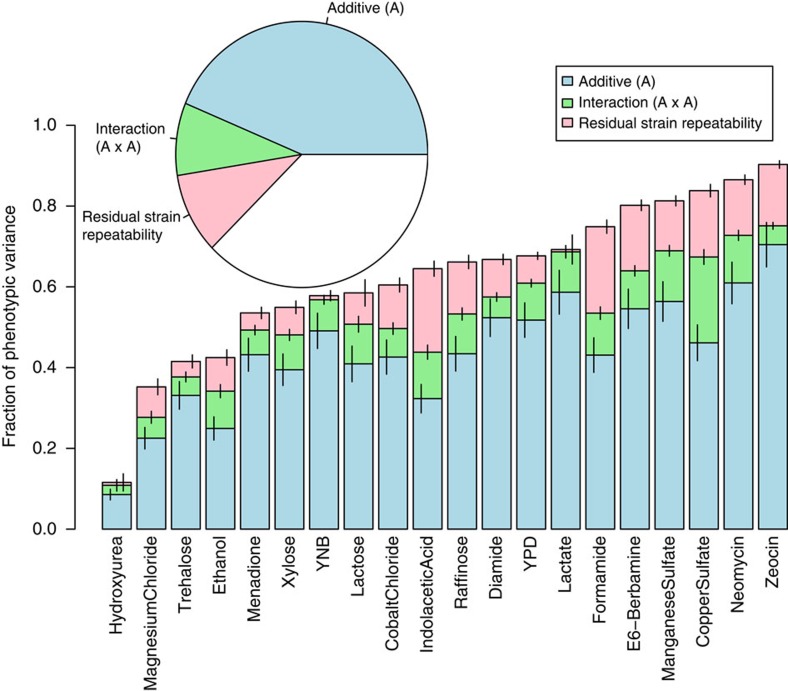
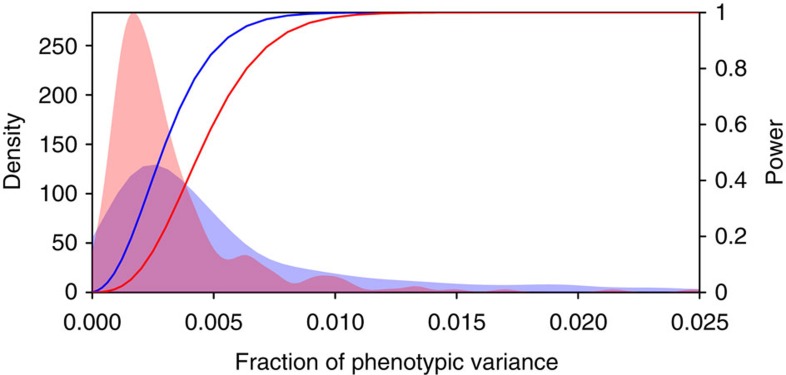
Genetic mapping studies of quantitative traits typically focus on detecting loci that contribute additively to trait variation. Genetic interactions are often proposed as a contributing factor to trait variation, but the relative contribution of interactions to trait variation is a subject of debate. Here we use a very large cross between two yeast strains to accurately estimate the fraction of phenotypic variance due to pairwise QTL-QTL interactions for 20 quantitative traits. We find that this fraction is 9% on average, substantially less than the contribution of additive QTL (43%). Statistically significant QTL-QTL pairs typically have small individual effect sizes, but collectively explain 40% of the pairwise interaction variance. We show that pairwise interaction variance is largely explained by pairs of loci at least one of which has a significant additive effect. These results refine our understanding of the genetic architecture of quantitative traits and help guide future mapping studies.


Figures

Figure 1
Figure 1. Contributions to trait variation.
Stacked bar plots of a variance component analysis for each trait are shown. The variance component model included terms for additive genetic variance (blue), two-way interaction variance (green), residual strain repeatability (pink) and residual error (not shown). Error bars show ±s.e. Inset, the average of the variance components across traits. Additive genetic effects, two-way interactions, and residual repeatability account for 43, 9 and 10% of phenotypic variance, respectively.
Figure 2
Figure 2. Additive and interaction variance captured by detected loci.
(a) Total variance captured by detected QTL for each trait is plotted against the whole-genome estimate of additive genetic variance. Error bars show ±s.e. The diagonal line represents (variance captured by detected QTL=additive genetic variance) and is shown as a visual guide. (b) Total variance captured by detected QTL–QTL interactions from the marginal scan for each trait is plotted against the whole-genome estimate of interaction variance. Error bars show ±s.e. The diagonal line represents (variance captured by detected QTL–QTL interactions=interaction genetic variance) and is shown as a visual guide.
Figure 3
Figure 3. Phenotype variance captured by different variance component models of two-way interactions.
The average fraction of phenotypic variance captured by different variance component models of two-way interactions across traits. The bar heights represent variance estimated with all markers (genome × genome; grey), significant additive QTL by all markers (QTL × genome; blue), additive QTL by additive QTL (QTL × QTL; green), significant QTL–QTL detected from the marginal scan (orange), and significant QTL–QTL from the exhaustive two-dimensional scan (purple). Error bars show ±s.e.
Figure 4
Figure 4. Distribution of genetic effects and power to detect them.
A density plot of the fraction of phenotypic variance (x axis) explained by individual significant QTL (blue area) and QTL–QTL interactions (red area) across all traits. The curves correspond to the statistical power at a genome-significance threshold (right, y axis) for QTL (blue) and QTL–QTL interactions (red).

References

    1. Hill W. G., Goddard M. E. & Visscher P. M. Data and theory point to mainly additive genetic variance for complex traits. PLoS Genet. 4, e1000008 (2008). - PMC - PubMed
    1. Mäki-Tanila A. & Hill W. G. Influence of gene interaction on complex trait variation with multilocus models. Genetics 198, 355–367 (2014). - PMC - PubMed
    1. Nelson R. M., Pettersson M. E. & Carlborg Ö. A century after Fisher: time for a new paradigm in quantitative genetics. Trends Genet. 29, 669–676 (2013). - PubMed
    1. Zuk O., Hechter E., Sunyaev S. R. & Lander E. S. The mystery of missing heritability: Genetic interactions create phantom heritability. Proc. Natl Acad. Sci. USA 109, 1193–1198 (2012). - PMC - PubMed
    1. Mackay T. F. C. Epistasis and quantitative traits: using model organisms to study gene-gene interactions. Nat. Rev. Genet. 15, 22–33 (2014). - PMC - PubMed

Publication types