

CFAssay: statistical analysis of the colony formation assay
- PMID: 26537797
- PMCID: PMC4634140
- DOI: 10.1186/s13014-015-0529-y
CFAssay: statistical analysis of the colony formation assay
Abstract
Background: Colony formation assay is the gold standard to determine cell reproductive death after treatment with ionizing radiation, applied for different cell lines or in combination with other treatment modalities. Associated linear-quadratic cell survival curves can be calculated with different methods. For easy code exchange and methodological standardisation among collaborating laboratories a software package CFAssay for R (R Core Team, R: A Language and Environment for Statistical Computing, 2014) was established to perform thorough statistical analysis of linear-quadratic cell survival curves after treatment with ionizing radiation and of two-way designs of experiments with chemical treatments only.
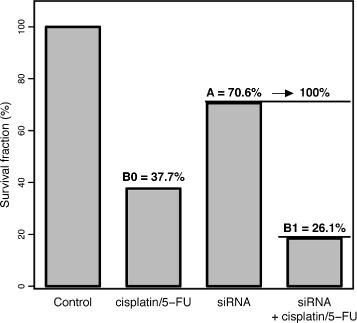
Methods: CFAssay offers maximum likelihood and related methods by default and the least squares or weighted least squares method can be optionally chosen. A test for comparision of cell survival curves and an ANOVA test for experimental two-way designs are provided.
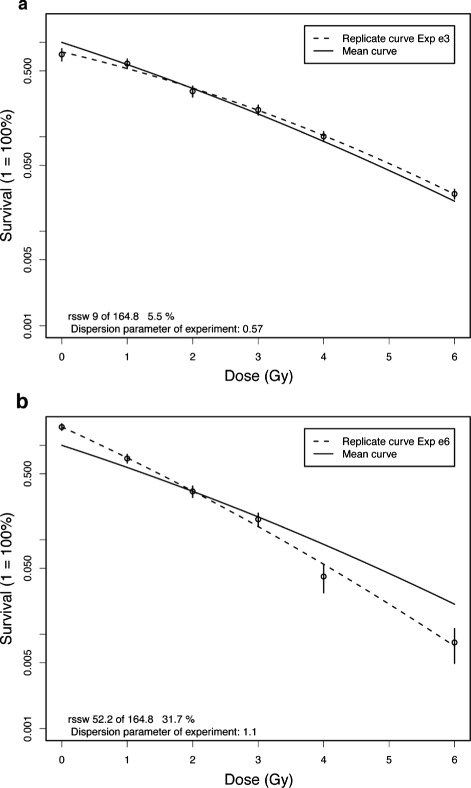
Results: For the two presented examples estimated parameters do not differ much between maximum-likelihood and least squares. However the dispersion parameter of the quasi-likelihood method is much more sensitive for statistical variation in the data than the multiple R (2) coefficient of determination from the least squares method.
Conclusion: The dispersion parameter for goodness of fit and different plot functions in CFAssay help to evaluate experimental data quality. As open source software interlaboratory code sharing between users is facilitated.
Availability: The package is available at http://www.bioconductor.org/packages/release/bioc/html/CFAssay.html .
Figures
References
-
- Franken NAP, Oei AL, Kok HP, Rodermond HM, Sminia P, Crezee J, et al. Cell survival and radiosensitisation: modulation of the linear and quadratic parameters of the lq model (review) Int J Oncol. 2013;42(5):1501–15. - PubMed
MeSH terms
LinkOut - more resources
Full Text Sources
Other Literature Sources
Molecular Biology Databases
Research Materials
