. 2015 Nov 4:14:85.
doi: 10.1186/s12940-015-0071-2.

Projections of temperature-attributable premature deaths in 209 U.S. cities using a cluster-based Poisson approach

Affiliations

Projections of temperature-attributable premature deaths in 209 U.S. cities using a cluster-based Poisson approach

Joel D Schwartz et al. Environ Health. .

Abstract

Background: A warming climate will affect future temperature-attributable premature deaths. This analysis is the first to project these deaths at a near national scale for the United States using city and month-specific temperature-mortality relationships.

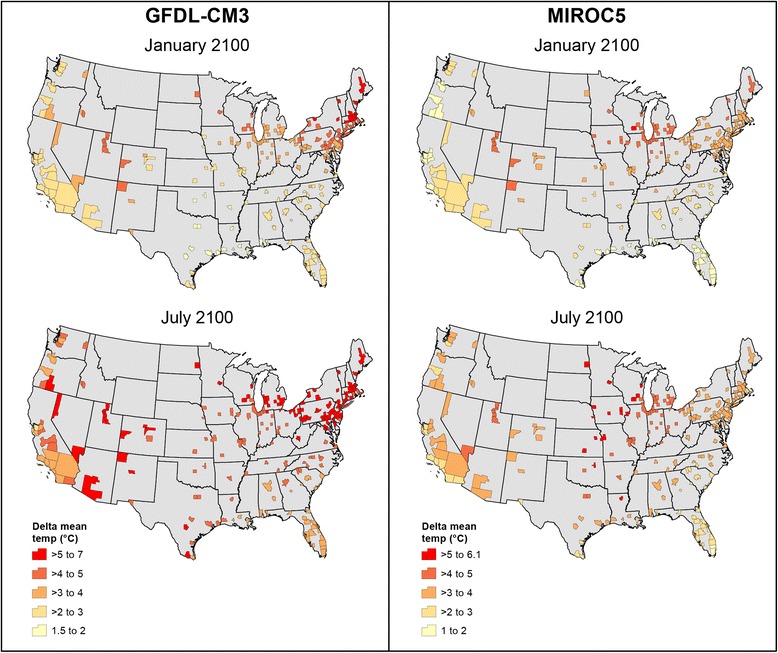
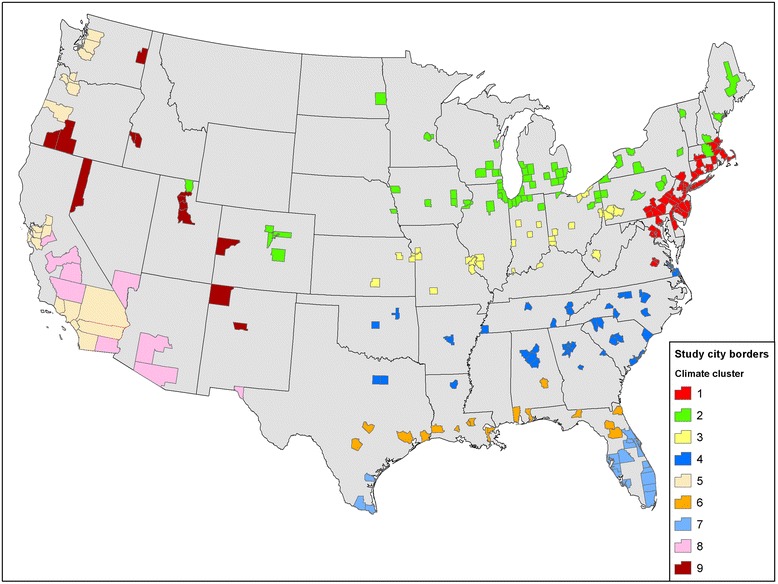
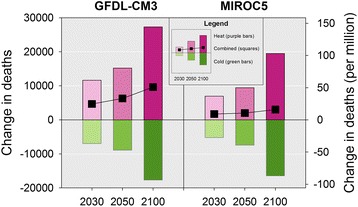
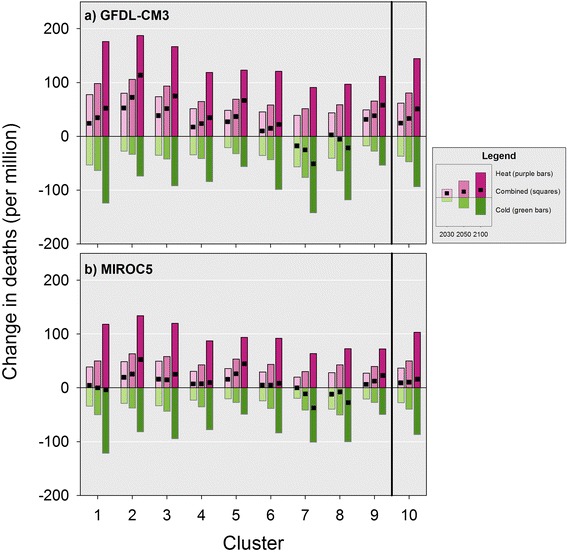
Methods: We used Poisson regressions to model temperature-attributable premature mortality as a function of daily average temperature in 209 U.S. cities by month. We used climate data to group cities into clusters and applied an Empirical Bayes adjustment to improve model stability and calculate cluster-based month-specific temperature-mortality functions. Using data from two climate models, we calculated future daily average temperatures in each city under Representative Concentration Pathway 6.0. Holding population constant at 2010 levels, we combined the temperature data and cluster-based temperature-mortality functions to project city-specific temperature-attributable premature deaths for multiple future years which correspond to a single reporting year. Results within the reporting periods are then averaged to account for potential climate variability and reported as a change from a 1990 baseline in the future reporting years of 2030, 2050 and 2100.

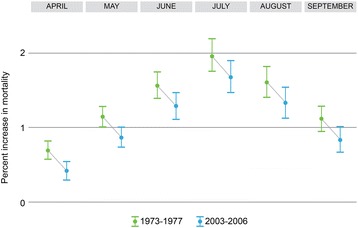
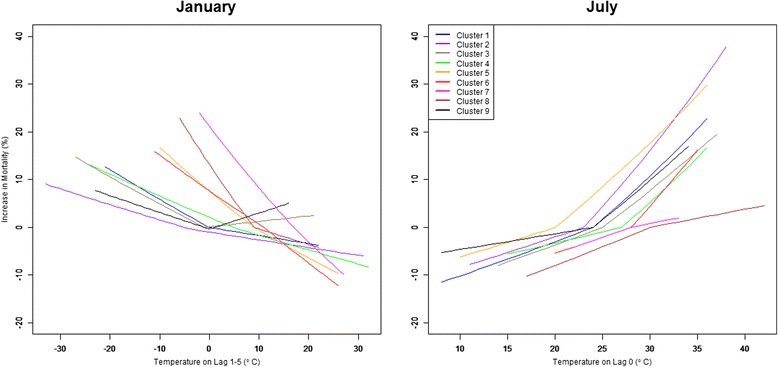
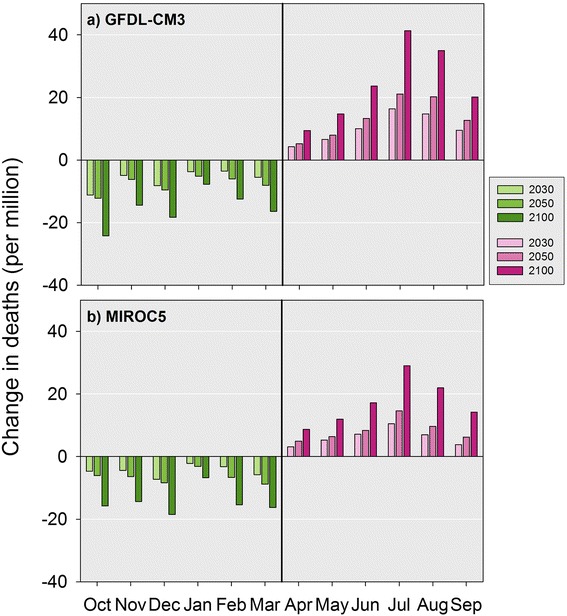
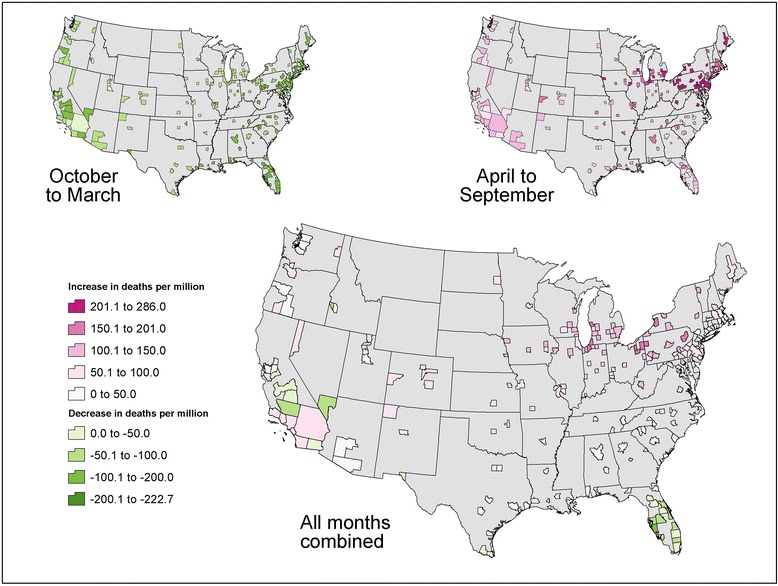
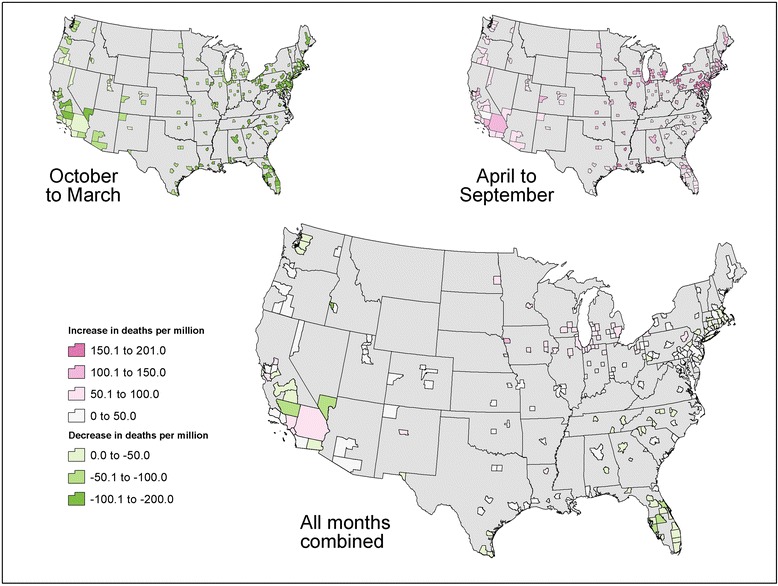
Results: We found temperature-mortality relationships that vary by location and time of year. In general, the largest mortality response during hotter months (April - September) was in July in cities with cooler average conditions. The largest mortality response during colder months (October-March) was at the beginning (October) and end (March) of the period. Using data from two global climate models, we projected a net increase in premature deaths, aggregated across all 209 cities, in all future periods compared to 1990. However, the magnitude and sign of the change varied by cluster and city.

Conclusions: We found increasing future premature deaths across the 209 modeled U.S. cities using two climate model projections, based on constant temperature-mortality relationships from 1997 to 2006 without any future adaptation. However, results varied by location, with some locations showing net reductions in premature temperature-attributable deaths with climate change.


Figures

Fig. 1
Fig. 1
Projected temperature differences by model from 1990 baseline to 2100 in January and July. Legend: This figure shows projected temperature differences between the 1976–2005 model baseline, reported as 1990 and 2086–2100, reported as 2100, for January and July by city for the GFDL-CM3 and MIROC5 climate models
Fig. 2
Fig. 2
County borders for the 209 study cities in the nine cluster groups. Legend: This figure identifies the borders for the 209 cities considered in the study and the assignment of cities to climate-based cluster groups
Fig. 3
Fig. 3
A comparison of the mortality effect for temperatures warmer than the median by month in cluster 1 for the periods 1973–1977 and 2003–2006. Legend: This figure shows a reduced mortality impact of high summer temperatures over time in our study
Fig. 4
Fig. 4
Month and cluster differences in temperature mortality effects. Legend: This figure shows the different premature mortality response to temperature by month and cluster. The kink in the response line for a cluster is at the median temperature for that cluster in that month based on 2003–2006 weather data
Fig. 5
Fig. 5
Title: Projected change in premature deaths across study cities from the GFDL-CM3 and MIROC5 climate models. Legend: This figure presents the projected change in total premature temperature-attributable deaths and the equivalent deaths per million study city residents (left and right sides of the y axis respectively) for future reporting years (x axis) relative to the 1990 baseline. The results for the GFDL-CM3 model are presented in the left panel and the MIROC5 model in the right panel. Changes in premature deaths for the hotter months of April – September (heat) are presented in purple, and changes for the colder months of October – March (cold) are presented in green. The combined effect is shown with the black squares
Fig. 6
Fig. 6
Projected change in premature temperature-attributable deaths by month per million study city residents for future reporting years relative to 1990 baseline for all study cities. Legend: This figure presents the projected change in premature temperature-attributable deaths per million study city residents for the future reporting years relative to the 1990 baseline across all study cities by month for both climate models
Fig. 7
Fig. 7
Combined effect of projected changes in premature temperature-attributable deaths from the hotter and colder months by individual cluster (1–9) and all clusters combined (10) in future reporting years relative to 1990 baseline. Legend: This figure presents the projected change in premature temperature-attributable deaths per million study residents by cluster and season for both climate models for the future reporting years relative to the 1990 baseline. Within a cluster results are presented from left to right for the 2030, 2050 and 2100 reporting years relative to 1990 baseline. Cumulative results across the clusters are presented as the results for cluster 10
Fig. 8
Fig. 8
GFDL-CM3 projected combined change in premature temperature-attributable deaths per million study city residents in 2100 relative to 1990 baseline. Legend: This figure shows results for the change in premature temperature-attributable deaths per million study city residents in each study city in 2100 relative to the 1990 baseline based on GFDL-CM3 projections accounting for the cumulative effect of changes in premature mortality in both the hotter and colder months
Fig. 9
Fig. 9
MIROC5 projected combined change in premature temperature-attributable deaths per million study city residents in 2100 relative to 1990 baseline. Legend: This figure shows results for the change in premature temperature-attributable deaths per million study city residents in each study city in 2100 relative to the 1990 baseline based on MIROC5 projections accounting for the cumulative effect of changes in premature mortality in both the hotter and colder months

References

    1. Hayhoe K, Sheridan S, Kalkstein L, Greene S. Climate change, heat waves, and mortality projections for Chicago. J Great Lakes Res. 2010;36:65–73. doi: 10.1016/j.jglr.2009.12.009. - DOI
    1. Lee M, Nordio F, Zanobetti A, Kinney P, Vautard R, Schwartz J. Acclimatization across space and time in the effects of temperature on mortality: a time-series analysis. Environ Health. 2014;13:89. http://www.ehjournal.net/content/13/1/89. Accessed 4 May 2015. - PMC - PubMed
    1. Gasparrini A, Guo Y, Hashizume M, Lavigne E, Zanobetti A, Schwartz J, et al. Mortality risk attributable to high and low ambient temperature: a multicountry observational study. Lancet. 2015 - PMC - PubMed
    1. Kaiser R, Le Tertre A, Schwartz J, Gotway CA, Daley WR, Rubin CH. The effect of the 1995 heat wave in Chicago on all-cause and cause-specific mortality. Am J Public Health. 2007;97:S158–62. doi: 10.2105/AJPH.2006.100081. - DOI - PMC - PubMed
    1. Knowlton K, Rotkin-Ellman M, King G, Margolis HG, Smith D, Solomon G, et al. The 2006 California heat wave: impacts on hospitalizations and emergency department visits. Environ Health Perspect. 2009;117:61–7. doi: 10.1289/ehp.11594. - DOI - PMC - PubMed

Publication types