. 2016 Jan 1;27(1):64-74.
doi: 10.1091/mbc.E15-07-0454. Epub 2015 Nov 4.

Cell cycle Start is coupled to entry into the yeast metabolic cycle across diverse strains and growth rates

Affiliations

Cell cycle Start is coupled to entry into the yeast metabolic cycle across diverse strains and growth rates

Anthony J Burnetti et al. Mol Biol Cell. .

Abstract

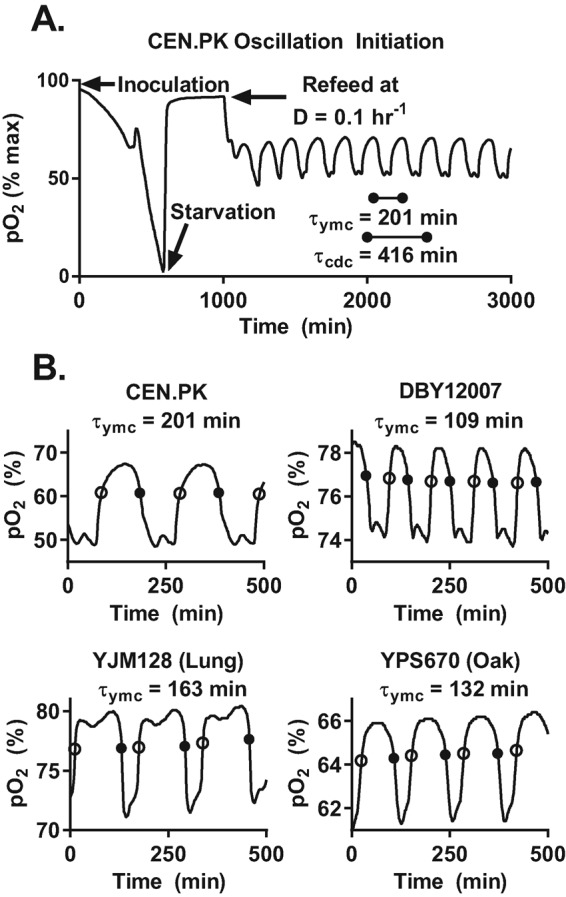
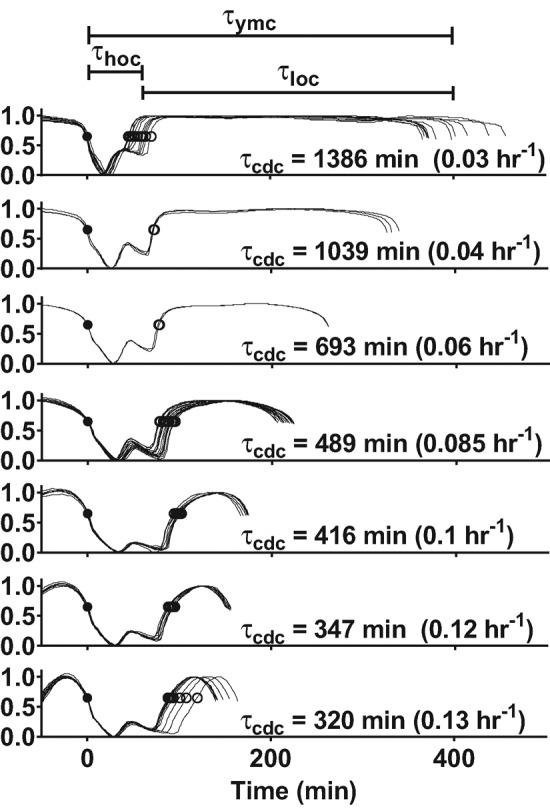
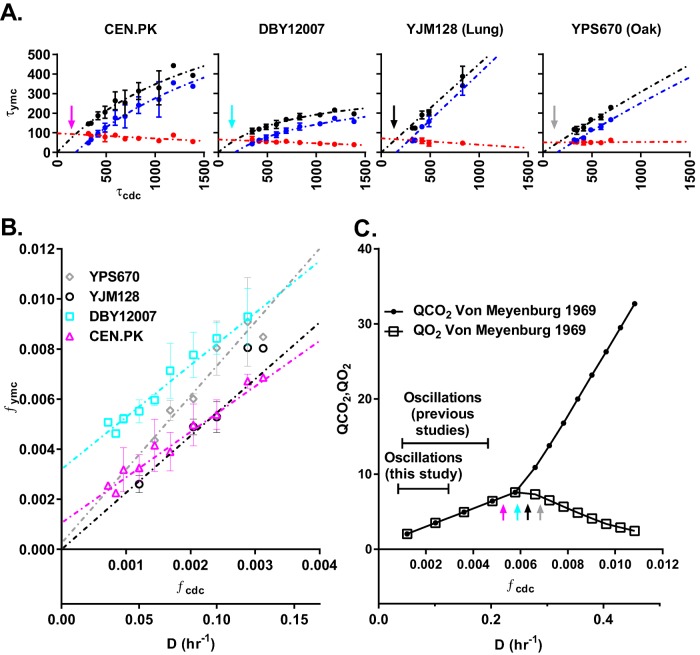
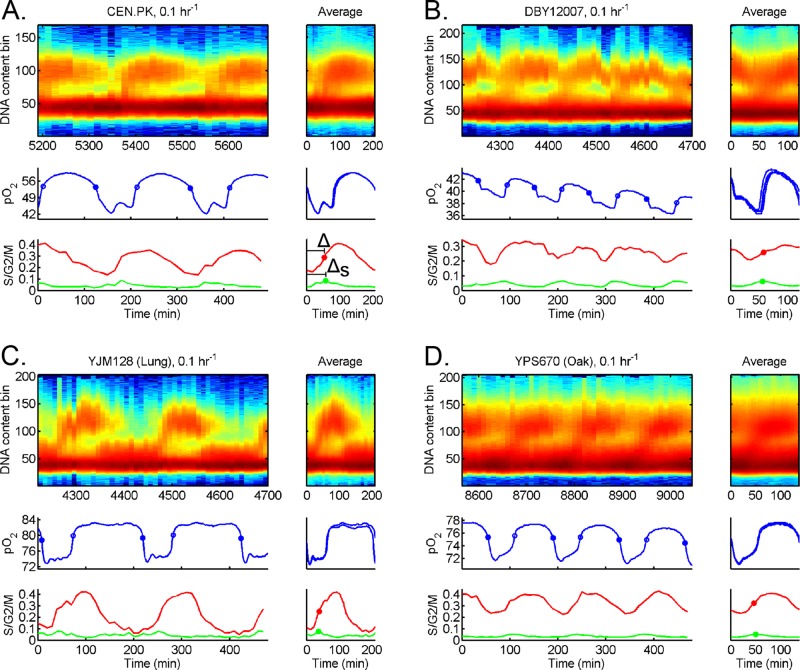
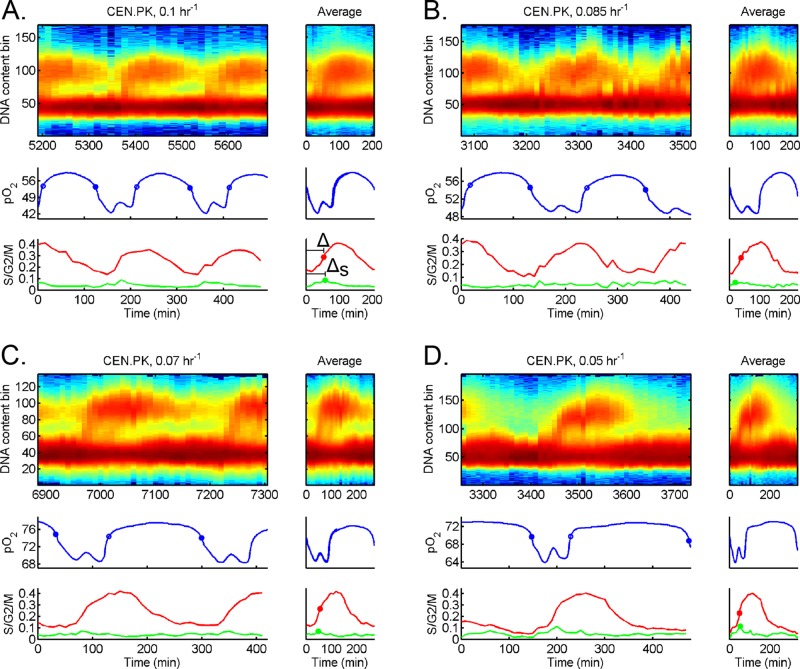
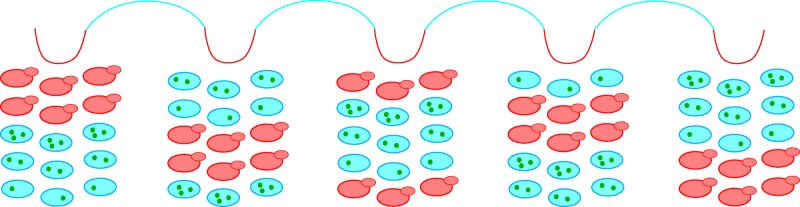
Cells have evolved oscillators with different frequencies to coordinate periodic processes. Here we studied the interaction of two oscillators, the cell division cycle (CDC) and the yeast metabolic cycle (YMC), in budding yeast. Previous work suggested that the CDC and YMC interact to separate high oxygen consumption (HOC) from DNA replication to prevent genetic damage. To test this hypothesis, we grew diverse strains in chemostat and measured DNA replication and oxygen consumption with high temporal resolution at different growth rates. Our data showed that HOC is not strictly separated from DNA replication; rather, cell cycle Start is coupled with the initiation of HOC and catabolism of storage carbohydrates. The logic of this YMC-CDC coupling may be to ensure that DNA replication and cell division occur only when sufficient cellular energy reserves have accumulated. Our results also uncovered a quantitative relationship between CDC period and YMC period across different strains. More generally, our approach shows how studies in genetically diverse strains efficiently identify robust phenotypes and steer the experimentalist away from strain-specific idiosyncrasies.


Figures

FIGURE 1:
FIGURE 1:
Measurement and analysis of the YMC across different strains. (A) Representative dissolved oxygen trace (pO2) after inoculation of chemostat with strain CEN.PK. Log phase yeasts first aerobically fermented the available glucose to produce ethanol; this was followed by a diauxic shift to pure respiration on ethanol. After a period of yeast starvation, we started the flow of fresh medium into the chemostat at a constant dilution rate (D = 0.1 h−1). The population began to exhibit clear oscillations in pO2 after refeeding. The period of the YMC (τymc) is the elapsed time from peak to peak in pO2 signal. At steady state, the average CDC period (τcdc) must be equal to the inverse of the dilution rate, or τcdc = ln (2)/D. (B) Sample pO2 traces of different yeasts at the same dilution rate. We used lab strains CEN.PK and DBY12007 and wild isolates YJM128 (lung) and YPS670 (oak). We developed an automated analysis pipeline to extract the YMC period, timing of entry into HOC (solid circle), and timing of entry into LOC (open circle) across different strains and dilution rates; see Materials and Methods.
FIGURE 2:
FIGURE 2:
Increase in YMC period at slower dilution rates occurs in the LOC. The YMC of strain CEN.PK was analyzed over a range of dilutions rates (D = 0.03–0.13 h−1). All YMC oscillations in pO2 from a single chemostat run were overlaid according to their entry into HOC (solid circle, t = 0 min) and their amplitudes were normalized and arranged vertically by their dilution rates. As τcdc increased, both τymc and τloc increased, whereas τhoc slowly decreased.
FIGURE 3:
FIGURE 3:
Quantitative relationship between the YMC and CDC. (A) Plots of YMC period (τymc; black dots), time spent in HOC (τhoc; red dots), and time spent in LOC (τloc; blue dots) as a function of CDC period (τcdc) for CEN.PK, DBY12007, YJM128 (lung), and YPS670 (oak). For clarity, we plot the mean and SD of time-series averages at identical dilution rates, which were measured during separate chemostat runs. We used nonlinear regression to best fit a mixed model to each data set; see Materials and Methods and Supplemental Figures S2 and S3. (B) Plot of YMC frequency (fymc = 1/τymc) and CDC frequency (fcdc = 1/τcdc) for all strains. (C) Metabolic profile of oxygen consumption (QO2) and carbon dioxide production (QCO2) of yeast strain LBGH1022 at different dilution rates from previous literature (Kaspar von Meyenburg, 1969). There is a transition from oxidative respiration (QCO2 is equal to QO2) to aerobic fermentation (QCO2 is greater than QO2) at a critical dilution rate, Dc ≈ 0.24 h−1, which corresponds to the dilution rates at which our tested strains are extrapolated to spend all their time in HOC phase (colored arrows) and not oscillate.
FIGURE 4:
FIGURE 4:
Timing of DNA replication relative to HOC across strains. Strains (A) CEN.PK, (B) DBY12007, (C) YJM128, and (D) YPS670 were cultured in chemostat at the same dilution rate (D = 0.1 h−1). We extracted samples every 10 min and measured CDC events (DNA content) and YMC events (pO2); see Materials and Methods. For each strain, the raw DNA content, pO2, S/G2/M fraction, and S fraction are plotted over several YMCs (left). The average over each YMC is plotted to the right of each full data set, where t = 0 corresponds to entry into HOC. We plot the 50% midpoint of S/G2/M fraction (solid red circle) and 100% peak of S fraction (solid green circle). The time of DNA replication (50% of S/G2/M fraction) after entry into HOC is defined as Δ, whereas time of DNA replication (100% of S fraction) is ΔS.
FIGURE 5:
FIGURE 5:
Timing of DNA replication relative to HOC in strain CEN.PK across growth rates. Additional cell cycle analysis for strain CEN.PK at different dilution rates: (A) 0.1 h−1, (B) 0.085 h−1, (C) 0.07 h−1, and (D) 0.05 h−1. The raw DNA content, pO2, S/G2/M fraction, and S fraction are plotted over several YMCs (left). The average over each YMC is plotted to the right of each full data set, where t = 0 corresponds to entry into HOC. We plot the 50% midpoint of S/G2/M fraction (solid red circle) and 100% peak of S fraction (solid green circle). The time of DNA replication (50% of S/G2/M fraction) after entry into HOC is defined as Δ, whereas time of DNA replication (100% of S fraction) is ΔS.
FIGURE 6:
FIGURE 6:
Simplified model of YMC–CDC coupling. The dissolved oxygen pO2 trace indicates LOC (blue line) and HOC (red line) over multiple YMCs. At the beginning of each YMC, a fraction of the population (red, budded cells) commits to catabolizing storage carbohydrates, entering HOC, and starting the CDC. These “committed” yeasts secrete metabolites, which trigger other “susceptible” yeasts with sufficient storage carbohydrates to catabolize their storage carbohydrates (Robertson et al., 2008). Such autocatalytic signaling through secreted metabolites causes an avalanche of susceptible yeasts to synchronously enter HOC and commit to the CDC. However, it is clear that not all yeasts commit to CDC each YMC. The rest of the yeast population in LOC (blue cells) is either refractory to metabolic signals, because the cells have not accumulated sufficient energy reserves (green dots) to commit to YMC, and/or has not accumulated sufficient biomass to initiate cell cycle Start upon entry to HOC. Over the coming YMC, these “refractory” yeasts in LOC continue to build up their reserves of storage carbohydrates and biomass, such that a new fraction of yeasts will be ready to spontaneously initiate and trigger other susceptible yeasts to commit to the next YMC. The yeast population in a low-glucose chemostat thus self-organizes into multiple staggered cohorts, such that only one cohort synchronously enters the CDC each YMC (i.e., one-to-some coupling). Cells likely migrate between cohorts over time due to cell-to-cell variability in both the YMC and CDC.

References

    1. Amariei C, Machne R, Stolc V, Soga T, Tomita M, Murray DB. Time resolved DNA occupancy dynamics during the respiratory oscillation uncover a global reset point in the yeast growth program. Microbial Cell. 2014;1:279–288. - PMC - PubMed
    1. Bieler J, Cannavo R, Gustafson K, Gobet C, Gatfield D, Naef F. Robust synchronization of coupled circadian and cell cycle oscillators in single mammalian cells. Mol Syst Biol. 2014;10:739. - PMC - PubMed
    1. Brauer MJ, Saldanha AJ, Dolinski K, Botstein D. Homeostatic adjustment and metabolic remodeling in glucose-limited yeast cultures. Mol Biol Cell. 2005;16:2503–2517. - PMC - PubMed
    1. Breunig JS, Hackett SR, Rabinowitz JD, Kruglyak L. Genetic basis of metabolome variation in yeast. PLoS Genet. 2014;10:e1004142. - PMC - PubMed
    1. Chen Z, Odstrcil EA, Tu BP, McKnight SL. Restriction of DNA replication to the reductive phase of the metabolic cycle protects genome integrity. Science. 2007;316:1916–1919. - PubMed

Publication types

LinkOut - more resources