

Removing endogenous tau does not prevent tau propagation yet reduces its neurotoxicity
- PMID: 26538322
- PMCID: PMC4687785
- DOI: 10.15252/embj.201592748
Removing endogenous tau does not prevent tau propagation yet reduces its neurotoxicity
Abstract
In Alzheimer's disease and tauopathies, tau protein aggregates into neurofibrillary tangles that progressively spread to synaptically connected brain regions. A prion-like mechanism has been suggested: misfolded tau propagating through the brain seeds neurotoxic aggregation of soluble tau in recipient neurons. We use transgenic mice and viral tau expression to test the hypotheses that trans-synaptic tau propagation, aggregation, and toxicity rely on the presence of endogenous soluble tau. Surprisingly, mice expressing human P301Ltau in the entorhinal cortex showed equivalent tau propagation and accumulation in recipient neurons even in the absence of endogenous tau. We then tested whether the lack of endogenous tau protects against misfolded tau aggregation and toxicity, a second prion model paradigm for tau, using P301Ltau-overexpressing mice with severe tangle pathology and neurodegeneration. Crossed onto tau-null background, these mice had similar tangle numbers but were protected against neurotoxicity. Therefore, misfolded tau can propagate across neural systems without requisite templated misfolding, but the absence of endogenous tau markedly blunts toxicity. These results show that tau does not strictly classify as a prion protein.
Keywords: Alzheimer's disease; P301L tau; neurodegeneration; neurofibrillary tangles; prion‐like.
© 2015 The Authors.
Figures

3D brain model, horizontal brain section illustrating transgenic human P301Ltau expression in the entorhinal cortex (green,
EC ) of theEC rTgTau mouse lines, and the propagation of transgenic tau to the dentate gyrus (DG ). Tau composition inEC rTgTau and control mouse lines investigated.Immunostained horizontal sections show the expression of human P301Ltau in
EC neurons in the absence of endogenous mouse tau (EC rTgTau‐Mapt 0/0). Fluorescence in situ hybridization of human taumRNA combined with immunofluorescence labeling (immuno‐FISH ) of human tau protein (huTau) verifies P301Ltau transgene expression in theEC . Scale bars, 50 μm.Propagation of human tau protein to neurons in the
DG (white arrowheads) inEC rTgTau‐Mapt 0/0 mice. Close‐ups showDG neurons from threeEC rTgTau‐Mapt 0/0 mice (DG I‐III ). Immuno‐FISH proofs the absence of human tau expression inDG neurons, which have huTau protein but no human taumRNA . Scale bars, 50 μm.Immunostained horizontal sections of
EC rTgTau mice show the expression of human P301Ltau inEC neurons in the presence of endogenous mouse tau. Immuno‐FISH proofs the absence of human tau expression in theseDG neurons. Scale bars, 50 μm.Human P301Ltau propagation to
DG neurons (white arrowheads) in the presence of endogenous mouse tau inEC rTgTau mice. Close‐ups show DG neurons from three ECrTgTau mice (DG I‐III). Scale bars, 50 μm.Human (huTau, antibody Tau13) and total tau (hu+moTau,
DAKO ) levels in entorhinal cortex (EC ) extracts from 18‐month‐old mice show equal human P301Ltau expression inEC rTgTau andEC rTgTau‐Mapt 0/0 mice (Mean ± SEM, P = 0.201, n = 3 mice/group, one‐wayANOVA with Bonferroni correction).The number of human tau‐positive cell bodies in the
DG (Mean ± SEM, P = 0.58, n = 4 sections and 3 mice/group) and human tau in hippocampal (HPC ) extracts (P = 0.14, n = 3 mice/group) were similar inEC rTgTau‐Mapt 0/0 andEC rTgTau mice (two‐tailed Student's t‐test).

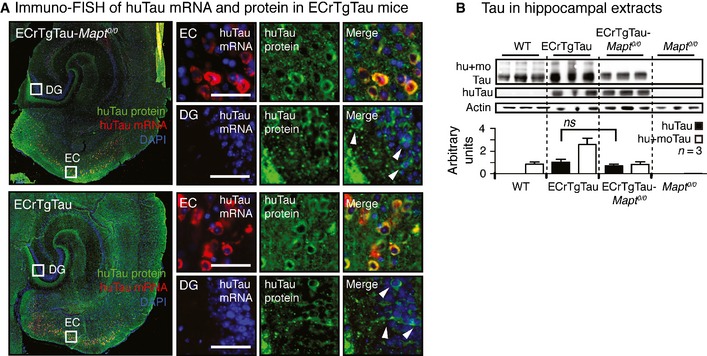
Representative images of the fluorescence in situ hybridization of transgenic human tau
mRNA combined with immunofluorescence labeling of human tau protein (Tau13 antibody) shows human tau protein (green) in neuronal cell bodies in theEC and theDG (white arrowheads), but human taumRNA only inEC neurons both inEC rTgTau‐Mapt 0/0 andEC rTgTau mice. n = 3 sections/mouse and 3 mice/group. Scale bars, 50 μm.Human tau (huTau, Tau13 antibody) and total tau (hu+moTau,
DAKO antibody) levels in hippocampal extracts from 18‐month‐old mice are similar inEC rTgTau andEC rTgTau‐Mapt 0/0 mice. Mean ±SEM , n = 3 mice/group, two‐tailed Student's t‐test. ns, non‐significant.

- A
Horizontal
EC rTgTau‐Mapt 0/0 brain section co‐immunolabeled with Tau13 (mouse antibody recognizing the N‐terminal end of human not mouse tau; epitope: aa20–35; red) andDAKO (polyclonal rabbit antibody recognizing the C‐terminal half of all mouse and human tau; epitope: multiple sites in aa243–441; green). Human tau in cell bodies in bothEC andDG neurons (white arrowheads) was recognized by both antibodies against the N‐terminus and the C‐terminal half, suggesting the trans‐synaptic propagation of full‐length tau. Scale bars, 50 μm. - B, C
Co‐immunostaining of human tau with
GAD 67 and Parvalbumin suggest the propagation of tau to a fewGABA ergic interneurons (white arrowheads) in theDG ofEC rTgTau‐Mapt 0/0 (B) andEC rTgTau (C) mice. Astrocytes (GFAP ) and microglia (Iba1) did not have human tau in either mouse line. n = 4 sections/mouse, 3 mice/group. Scale bars, 50 μm.
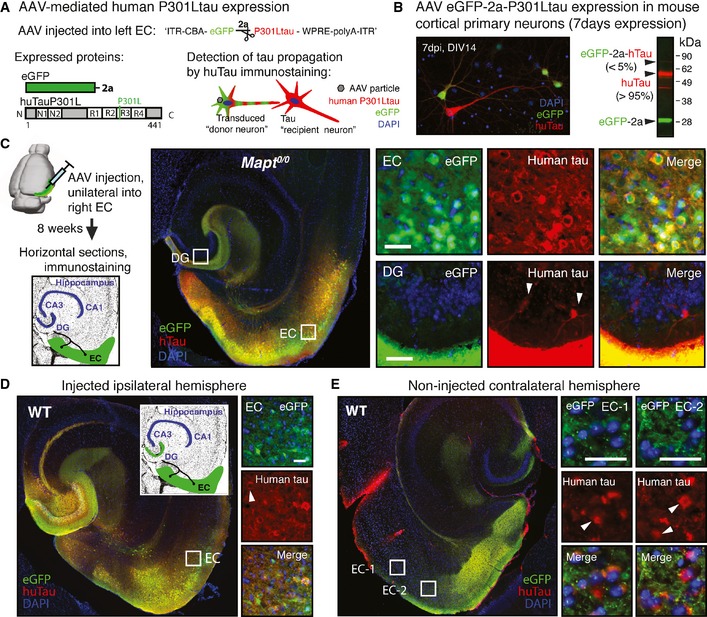
Adeno‐associated virus (
AAV ) construct designed for expression ofeGFP and human P301Ltau as individual proteins, separated by the self‐cleaving 2a peptide, under theCBA promoter (AAV 8CBA ‐eGFP ‐2a‐huTauP301L).AAV ‐transduced “donor neurons” expresseGFP and huTauP301L, and tau “recipient neurons” are identified after immunostaining for human tau as huTau+ butGFP − neurons.Primary cortical neuron cultures that were transduced with
AAV eGFP ‐2a‐P301Ltau at 7DIV , and fixed and immunostained forGFP and human tau (Tau13 antibody) at 14DIV , show tau donor (GFP +, huTau+; ˜10% neurons) and a small number of tau recipient neurons (GFP −, huTau+; ˜1% neurons). Western blot of whole cell lysates verified efficient cleavage (˜95%) ofeGFP and P301Ltau by the 2a peptide (n = 3).Eight weeks after
AAV injection into rightEC of aged Mapt 0/0 mice (n = 3), immunostained brain sections showed that huTauP301L (red) propagated to a fewDG “recipient neurons” (white arrowheads). Scale bar, 50 μm.Unilateral
AAV ‐mediated human P301L tau expression in theEC andDG of age‐matchedWT mice (n = 3). Representative images of brain sections show donor neurons in the injectedEC andDG , and a few tau recipient neurons (white arrowheads) adjacent to theAAV injection site. Scale bar, 50 μm.In the contralateral hemisphere of the same brain section as in (D), some tau recipient neurons (white arrowheads) were also present in the (non‐injected) axonal projection areas in the contralateral
EC (GFP ‐filled terminal ends). Scale bar, 100 μm.

- A
Brain sections from 18‐month‐old
EC rTgTau‐Mapt 0/0 andEC rTgTau mice were co‐immuolabeled for human tau and misfolded tau (Alz50). Misfolded tau was only found inEC andDG neurons (white arrowheads) ofEC rTgTau, but notEC rTgTau‐Mapt 0/0 animals (n = 4 sections/mouse, 3 mice/group). Scale bars, 50 μm. - B, C
Immunofluorescence labeling and stereological counting of microglia in entorhinal cortex (B) and astrocytes in hippocampus (C) indicated early signs of neurodegeneration in
EC rTgTau mice. The significantly increased number of Iba1‐positive microglia in theEC layerII /III ofEC rTgtau mice (compared toWT ) was partially rescued inEC rTgTau‐Mapt 0/0 mice (non‐significant). The number ofGFAP ‐positive astrocytes was similar across all genotypes (non‐significant). Mean ±SEM , n = 4 sections per mouse, 3 mice/group, one‐wayANOVA with Bonferroni correction. Scale bars, 100 μm.
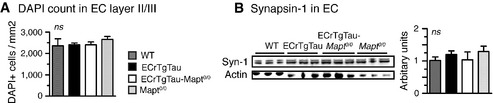
Stereological counting of
DAPI nuclei inEC layerII /III suggested no obvious neuronal loss inEC rTgTau(‐Mapt 0/0) mice at 18 months of age.Western blotting for pre‐synaptic marker synapsin‐1 (Syn‐1) showed similar levels, indicating no major synapse loss in
EC rTgTau(‐Mapt 0/0) mice at 18 months of age.
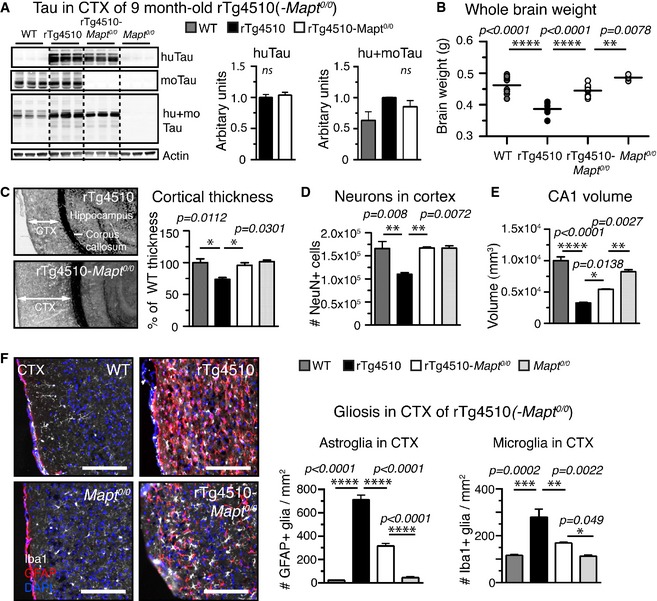
Human, mouse, and total tau protein levels in cortical
TBS ‐extracts ofrT g4510,rT g4510‐Mapt 0/0, and control mice: The amount of human tau (Tau13 antibody) was comparable inrT g4510 andrT g4510‐Mapt 0/0, moTau (Tau/5) was comparable inWT andrT g4510, and total tau levels (hu+moTau,DAKO antibody) were (expected) highest inrT g4510 mice. n = 3 mice/group, non‐significant.Whole brain weights of 9‐month‐old animals revealed pronounced brain matter loss in
rT g4510 compared toWT mice (weight loss > 16%), which was rescued inrT g4510‐Mapt 0/0 mice to > 96%. n = 5 mice/group.Cortical thickness measured adjacent to
HPC , fromCTX surface to corpus callosum, was decreased inrT g4510 mice by ˜25% compared toWT mice.rT g4510‐Mapt 0/0 showed noCTX thinning compared to Mapt 0/0 orWT mice. n = 3 mice/group.The number of neurons (NeuN+ cells) in the cortex of
rT g4510 mice was significantly reduced to ˜67% compared to bothWT andrT g4510‐Mapt 0/0. n = 3 mice/group.The volume of hippocampal region
CA 1, withCT the most affected regions inrT g4510 mice, was significantly reduced inrT g4510 by ˜70% volume;rT g4510‐Mapt 0/0 had significantly largerCA 1 volume left (reduced by only ˜40%). n = 3 mice/group.rT g4510 showed strong signs of neuroinflammation with extremely high numbers of activated astroglia (GFAP +, red) and microglia (Iba1+, white) in theCTX compared toWT mice. Both astro‐ and microgliosis were reduced by ˜50% inrT g4510‐Mapt 0/0 mice., n = 3 sections/mouse and 5 mice per/group. Scale bars, 100 μm.

Whole brain weights of 12‐month‐old animals show severe brain matter loss in
rT g4510 compared toWT mice (weight loss > 23%), which was partially rescued inrT g4510‐Mapt 0/0 mice.Cortical thickness, measured from
CTX surface to corpus callosum, decreased inrT g4510 mice at 12 months by ˜50% compared toWT , andrT g4510‐Mapt 0/0 showedCTX thinning of ˜30% at 12 months.The number of cortical neurons (NeuN+ cells) in 12‐month‐old
rT g4510 mice was significantly reduced (˜63% ofWT ). The number of neurons inrT g4510‐Mapt 0/0 slightly decreased to ˜88% of Mapt 0/0 mice (ns).

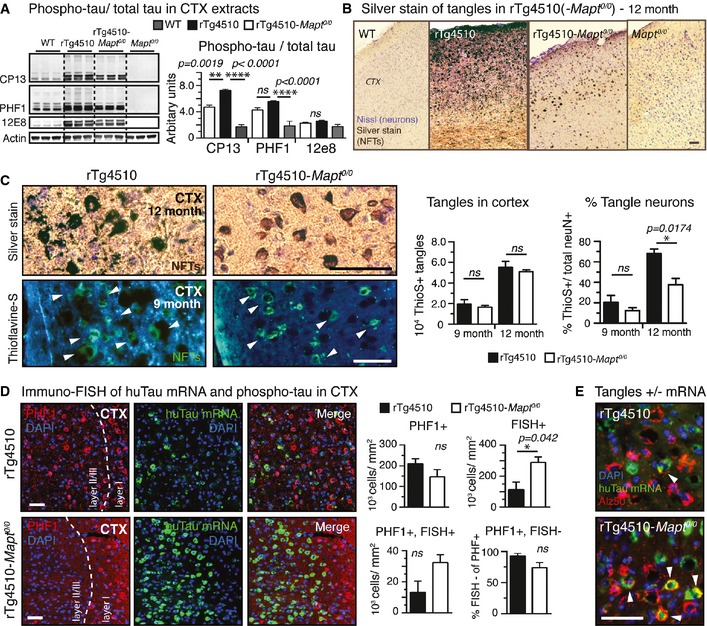
Cortical extracts from
rT g4510‐Mapt 0/0 brains had significantly less phospho‐tau (CP 13,PHF 1, 12E8) thanrT g4510 extracts. Compared toWT mice, both transgenic tau lines had high levels of phospho‐tau. n = 3 mice/group.Representative images of gallyas silver‐stained aggregated tau in cortices from 12‐month‐old mice unravel stunning differences in the degree of tau pathology in
rT g4510 compared torT g4510‐Mapt 0/0 mice. n = 3 mice/group.Higher magnification images of silver (12‐month‐old) and thioflavine‐S (9‐month‐old)‐stained cortices show mature tangles (white arrowheads in Thio‐S stain) in
rT g4510 andrT g4510‐Mapt 0/0 mice; enhanced pathological changes such as neuritic tau accumulation and neuropil vacuolation aroundNFT s are found only inrT g4510 mice. Stereological counting revealed similar numbers of corticalNFT s betweenrT g4510 andrT g4510‐Mapt 0/0 mice at 9 and 12 months of age. Because of the pronounced neuronal death only inrT g4510 mice, the percentage of tangle‐bearing neurons was ˜1.6‐ to 1.8‐fold higher in 9‐ and 12‐month‐oldrT g4510 mice. n = 3 sections/mouse, 3 mice/group.Immuno‐
FISH for huTaumRNA (green) and phospho‐tau (PHF 1, red) shows obvious differences in the distribution of neurons in cortex layerII /III : 9‐month‐oldrT g4510 mice had more neurons filled withNFT ‐like phosphorylated tau (PHF 1+, red), andrT g4510‐Mapt 0/0 mice had significantly more huTaumRNA ‐positive neurons (FISH +).rT g4510‐Mapt 0/0 mice had also more neurons still expressing bothPHF 1 and huTaumRNA (PHF 1+FISH +), suggesting a reduced neurotoxicity of P301Ltau expression inrT g4510‐Mapt 0/0 mice. n = 3 sections per mouse, 3 mice/group.Immuno‐
FISH showingEC neurons having both misfolded somatic tau (Alz50, red) and human taumRNA (green; white arrowheads) inrT g4510‐Mapt 0/0 but rarely inrT g4510 mice. n = 3 sections, 2 mice/group.

- A, B
Average ratios of (A) tangle number:neuron loss (=tangles/([number of neurons in
WT or Mapt 0/0 controls]‐[number neurons inrT g4510 orrT g4510‐Mapt 0/0]) and (B) average rations of tangle number:cortex thinning (=tangles/([CTX thickness ofWT or Mapt 0/0 controls]‐[CTX thickness ofrT g4510 orrT g4510‐Mapt 0/0]) at 9 and 12 months of age highlight the improved neuronal survival at given tangle load inrT g4510‐Mapt 0/0 mice. Comparing the effect ofNFT s on neuronal loss (A) and cortex thinning (B) between 9‐ and 12‐month‐old animals discovers a delayed onset of pathological changes—in the context of tangles—in tau‐null animals. n = 3 mice/group. - C
Representative images of an immuno‐
FISH for human tau protein (TauY9 antibody, pink) and human taumRNA (green) on brain sections of 9‐month‐oldrT g4510(‐Mapt 0/0) mice. Human tau transgene expression appears diminished in the outerCTX layers inrT g4510 but notrT g4510‐MapT 0/0 animals (low magnification images). InrT g4510‐MapT 0/0 animals, moreEC neurons still express human taumRNA while having human tau protein accumulated in the somata (white arrowheads) compared torT g4510 mice; the neurotoxicity caused by P301Ltau expression, missorting into the soma, and aggregation seems to be reduced in the absence of mouse tau. n = 4 sections/mouse, 2 mice/group. Scale bars, 100 μm.
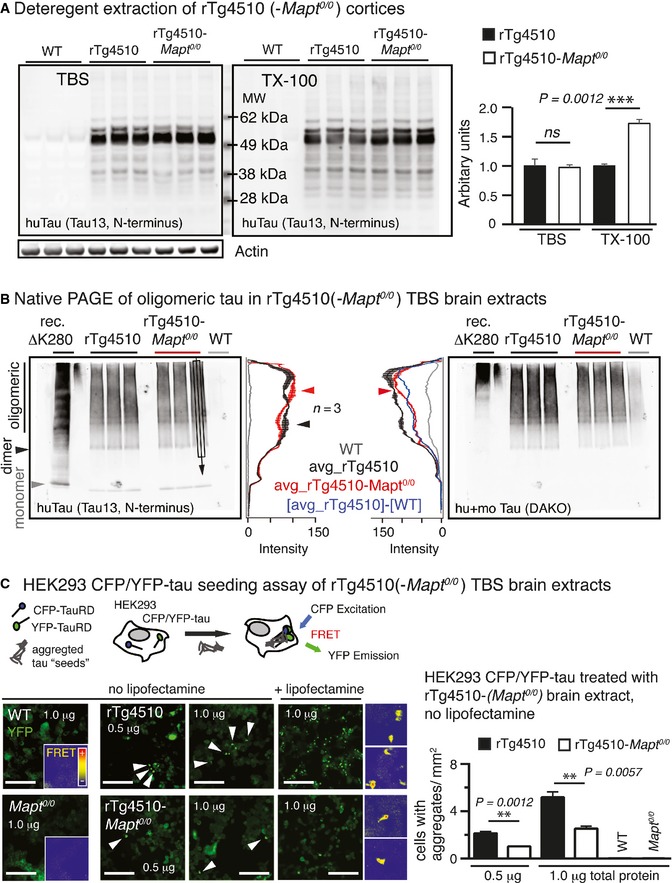
Extraction of cortices revealed similar human tau (Tau13) in
TBS ‐extracts (not significant) but significantly more human tau in Triton X‐100 (TX ‐100) extracts ofrT g4510‐Mapt 0/0 compared torT g4510 mice. Mean ±SEM , n = 3 mice/group, two‐tailed Student's t‐test, ns, non‐significant.Native gel electrophoresis of cortical
TBS ‐extracts showed small differences inHMW (oligomeric) human tau betweenrT g4510 andrT g4510‐Mapt 0/0 brains. Western blot lanes were averaged across ˜2/3 of the width (black rectangular and arrow in Tau13 blot). The mean ±SEM (n = 3 mice/group) of these averages was plotted as longitudinal lane profiles. Differences inHMW tau are indicated by red and black arrowheads.TBS ‐brain extracts were applied to aHEK 293 cell tau aggregation seeding assay (Holmes et al, 2014; Sanders et al, 2014), in which TauRDP 301S‐CFP and TauRDP 301S‐YFP are co‐expressed intracellularly. The formation of intracellular fluorescent TauRDP 301S aggregates leads to Foerster resonance energy transfer (FRET ) activity between co‐aggregatedCFP andYFP ‐tags and correlates with the tau aggregation seeding activity of the applied brain extracts. After 24 h, cells treated with extract (0.5 and 1.0 μg total protein per 96 well) from 9‐month‐oldrT g4510 had significantly more intracellularYFP ‐positive (white arrowheads) aggregates compared torT g4510‐Mapt 0/0 extracts;FRET activity of TauRDP 301S aggregates appeared similar for bothrT g4510 andrT g4510‐Mapt 0/0.WT and Mapt 0/0 extracts never showed seeding activity. Addition of lipofectamine corrected for differences in cellular uptake of tau and led to similar differences in seeding activity betweenrT g4510 andrT g4510‐Mapt 0/0 mice. Two‐tailed Student's t‐test, mean ±SEM , n = 3 replicates. ns, not significant. Insets, 100 μm. Scale bars, 50 μm.
Comment in
-
No full admission for tau to the exclusive prion club yet.EMBO J. 2015 Dec 14;34(24):2990-2. doi: 10.15252/embj.201593311. Epub 2015 Nov 9. EMBO J. 2015. PMID: 26553729 Free PMC article.
References
-
- Augustinack JC, Schneider A, Mandelkow EM, Hyman BT (2002) Specific tau phosphorylation sites correlate with severity of neuronal cytopathology in Alzheimer's disease. Acta Neuropathol 103: 26–35 - PubMed
-
- Braak H, Braak E (1991) Neuropathological stageing of Alzheimer‐related changes. Acta Neuropathol 82: 239–259 - PubMed
-
- Brandner S, Isenmann S, Raeber A, Fischer M, Sailer A, Kobayashi Y, Marino S, Weissmann C, Aguzzi A (1996a) Normal host prion protein necessary for scrapie‐induced neurotoxicity. Nature 379: 339–343 - PubMed
-
- Calafate S, Buist A, Miskiewicz K, Vijayan V, Daneels G, de Strooper B, de Wit J, Verstreken P, Moechars D (2015) Synaptic contacts enhance cell‐to‐cell tau pathology propagation. Cell Rep 11: 1176–1183 - PubMed
Publication types
MeSH terms
Substances
Grants and funding
LinkOut - more resources
Full Text Sources
Other Literature Sources
Medical
Molecular Biology Databases
