. 2015 Nov 4:12:202.
doi: 10.1186/s12974-015-0421-6.

Altered morphological dynamics of activated microglia after induction of status epilepticus

Affiliations

Altered morphological dynamics of activated microglia after induction of status epilepticus

Elena Avignone et al. J Neuroinflammation. .

Abstract

Background: Microglia cells are the resident macrophages of the central nervous system and are considered its first line of defense. In the normal brain, their ramified processes are highly motile, constantly scanning the surrounding brain tissue and rapidly moving towards sites of acute injury or danger signals. These microglial dynamics are thought to be critical for brain homeostasis. Under pathological conditions, microglial cells undergo "activation," which modifies many of their molecular and morphological properties. Investigations of the effects of activation on motility are limited and have given mixed results. In particular, little is known about how microglial motility is altered in epilepsy, which is characterized by a strong inflammatory reaction and microglial activation.

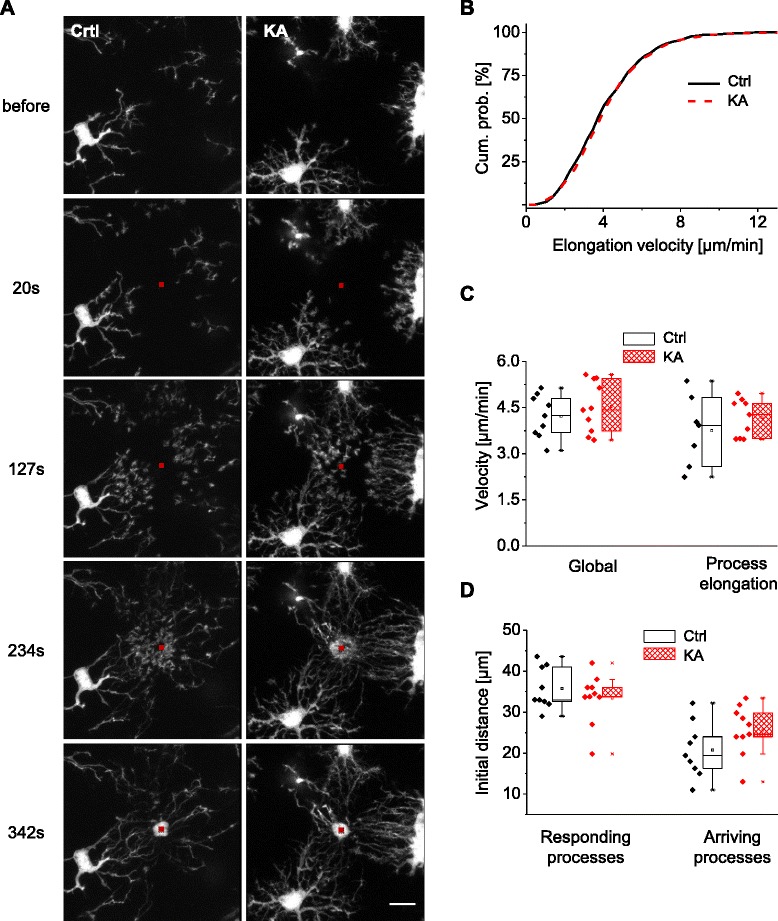
Methods: We used a mouse model of status epilepticus induced by kainate injections and time-lapse two-photon microscopy to image GFP-labeled microglia in acute hippocampal brain slices. We studied how microglial activation affected the motility of microglial processes, including basal motility, and their responses to local triggering stimuli.

Results: Our study reveals that microglial motility was largely preserved in kainate-treated animals, despite clear signs of microglial activation. In addition, whereas the velocities of microglial processes during basal scanning and towards a laser lesion were unaltered 48 h after status epilepticus, we observed an increase in the size of the territory scanned by single microglial processes during basal motility and an elevated directional velocity towards a pipette containing a purinergic agonist.

Conclusions: Microglial activation differentially impacted the dynamic scanning behavior of microglia in response to specific acute noxious stimuli, which may be an important feature of the adaptive behavior of microglia during pathophysiological conditions.


Figures

Fig. 1
Fig. 1
Cell body size correlates with the severity of status epilepticus. a, b Maximal intensity projection (MIP, z = 19 μm) images of microglial cells obtained in control mice (a) and in mice two days after kainate i.p. injection (b). The insets show higher magnification images. The line around cell bodies was drawn in a semi-automatic way to measure cell body size. The line on the process was based on the 3D image stack to avoid projection artifacts. Note the increase in cell body size of microglia and decrease of the longest process after SE. Scale bars 10 and 6 μm in the insets. c Soma size measurements obtained in all experiments classified according to the crisis level of animals, their median, and quartile value. d Cumulative probability of cell body size grouped according to the crisis level of animals, scored according to modified Racine’s scale. Note the progressive shift to the right with the increase of the severity of the induced SE. e Relationship between the median of cell body size for each animal and its crisis level or in control (ctrl, black). f Measurements of longest processes obtained in all experiments classified according to crisis level of animals, their median, and quartile value. g Cumulative probability of data represented in (f) grouped according to crisis level. Note the progressive shift to the left with increasing crisis severity. h Relationship between the median of the longest processes for each animal and its crisis level or in control (ctrl, black)
Fig. 2
Fig. 2
Activated microglia scan larger territory, without changing their velocity. a Maximal intensity projection of time-lapse two-photon images at different time points during spontaneous movements of microglial processes in control (left column) and 48 h after induction of SE (right column). The figure shows retracting (red symbols) and elongating processes (green symbols), with the starting/arriving points marked by circles. Scale bar, 5 μm. b Cumulative probability of all elongation movements by single process tips measured in control (black) and KA-injected (red) animals shows no difference between the two groups (p = 0.99, KS test). c Cumulative probability of territory explored by all single process tips measured in control (black) and KA-injected (red) animals. p = 0.019, KS test. d Relationship between the median of explored territory by microglial processes versus the median of the cell body size in each experiment. The red line represents the linear fit (r = 0.8)
Fig. 3
Fig. 3
Faster process motility of activated microglia towards a pipette containing 2Me-ADP. a Maximal intensity projection of two-photon images at different time points after the insertion (at t = 0) of a pipette containing 2Me-ADP (100 μM) in slice from control (left column) or kainate-treated (right column) animals. At t = 25 min (right column), the processes of activated microglia have reached the pipette (bottom images), whereas those of microglia from control mice reached their target only after 45 min (inset picture). Scale bar, 15 μm. b Cumulative probability of all elongation movements by single process tips measured in control (black) and KA-injected (red) animals (p < 0.001, KS test). c Velocity measured with two different methods in control (black) and KA-injected (red) animals. Global velocity was assessed measuring the fluorescence in concentric rings around the pipette tip. Process elongation velocity was evaluated considering the median of average elongation tip velocity of several processes in the experiment. Both methods revealed a higher velocity in KA-injected animals compared to control (p < 0.01, t test)
Fig. 4
Fig. 4
Microglial activation does not affect process motility towards a laser-induced lesion. a Examples of maximal intensity projection of two-photon images at different time points after the induction of lesion with a laser in a small portion of the slice (red square) in control (left column) and in KA-injected (right column) animal. Scale bar, 10 μm. b Cumulative probability of all elongation movements by single process tip measured in control (black) and KA-injected (red) animals. p = 0.17, KS test. c Global velocity and process elongation velocity measured in control (black) and KA-injected animals (red). None of the two methods shows a statistically significant difference between the two groups (p = 0.38 and 0.40 for global and process elongation, respectively, t test). d Evaluation of the area of influence of the laser lesion in control (black) and KA-injected (red) animals. Each dot represents the most distant process that still reacted to the lesion (responding processes) or actually arrived at the lesion site (arriving processes). None of the two groups showed a statistically significant difference (p = 0.39 and p = 0.16 for responding and arriving, respectively, t test)

References

    1. Kettenmann H, Hanisch U-K, Noda M, Verkhratsky A. Physiology of microglia. Physiol Rev. 2011;91:461–553. doi: 10.1152/physrev.00011.2010. - DOI - PubMed
    1. Kettenmann H, Kirchhoff F, Verkhratsky A. Microglia: new roles for the synaptic stripper. Neuron. 2013;77:10–18. doi: 10.1016/j.neuron.2012.12.023. - DOI - PubMed
    1. Davalos D, Grutzendler J, Yang G, Kim JV, Zuo Y, Jung S, et al. ATP mediates rapid microglial response to local brain injury in vivo. Nat Neurosci. 2005;8:752–758. doi: 10.1038/nn1472. - DOI - PubMed
    1. Nimmerjahn A, Kirchhoff F, Helmchen F. Resting microglial cells are highly dynamic surveillants of brain parenchyma in vivo. Science. 2005;308:1314–1318. doi: 10.1126/science.1110647. - DOI - PubMed
    1. Parkhurst CN, Gan W-B. Microglia dynamics and function in the CNS. Curr Opin Neurobiol. 2010;20:595–600. doi: 10.1016/j.conb.2010.07.002. - DOI - PMC - PubMed

Publication types

LinkOut - more resources