. 2015 Nov 4;35(44):14922-42.
doi: 10.1523/JNEUROSCI.1897-15.2015.

Distinct Cell- and Layer-Specific Expression Patterns and Independent Regulation of Kv2 Channel Subtypes in Cortical Pyramidal Neurons

Affiliations

Distinct Cell- and Layer-Specific Expression Patterns and Independent Regulation of Kv2 Channel Subtypes in Cortical Pyramidal Neurons

Hannah I Bishop et al. J Neurosci. .

Abstract

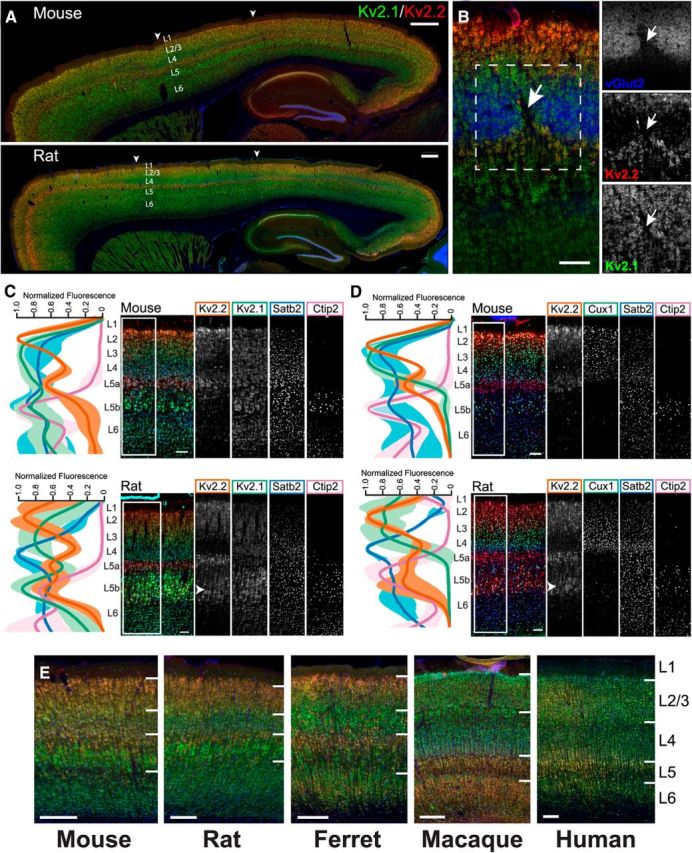
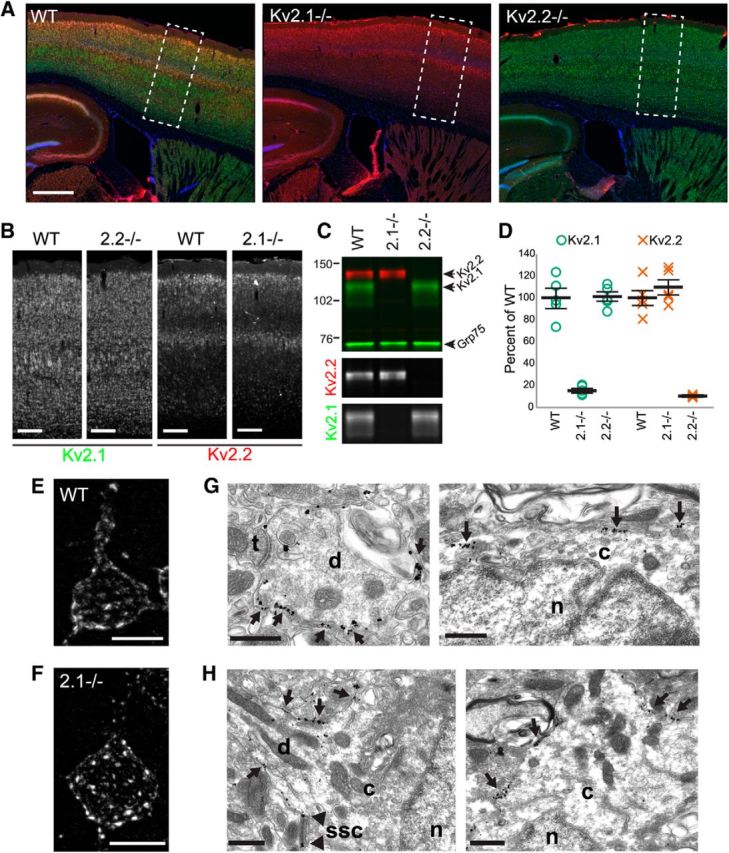
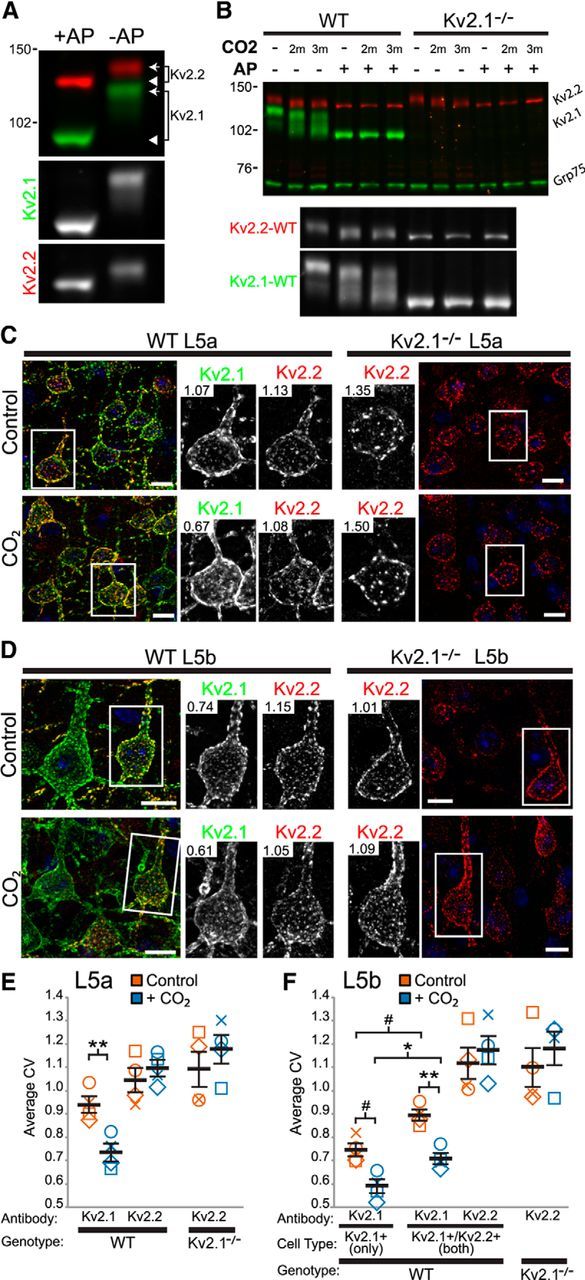
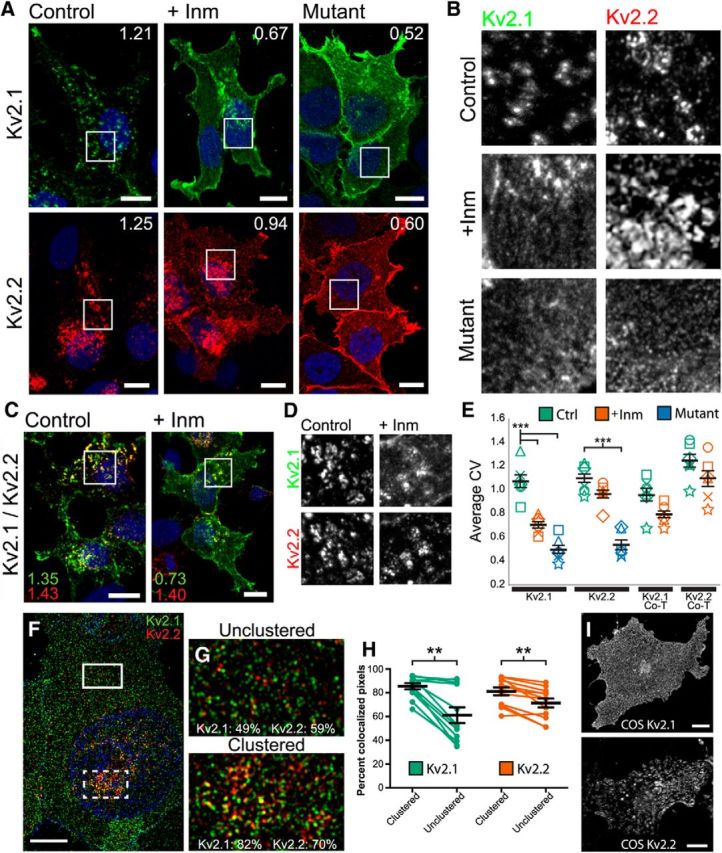
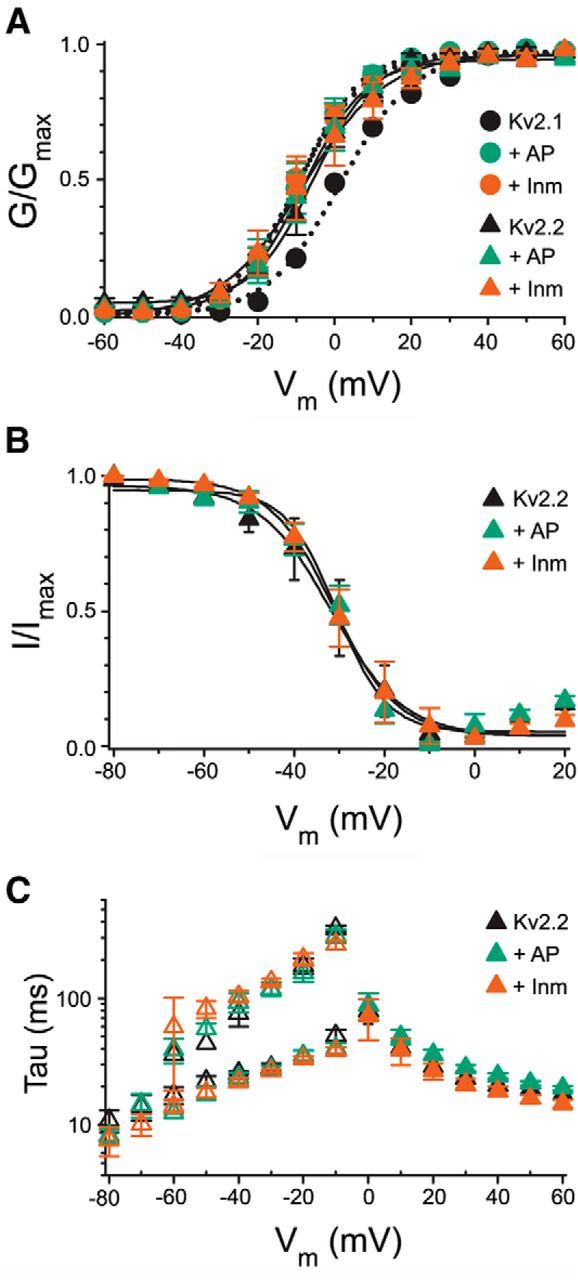
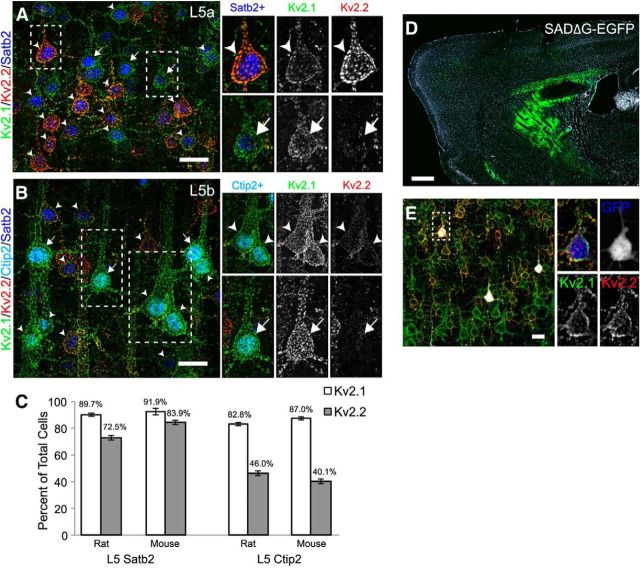
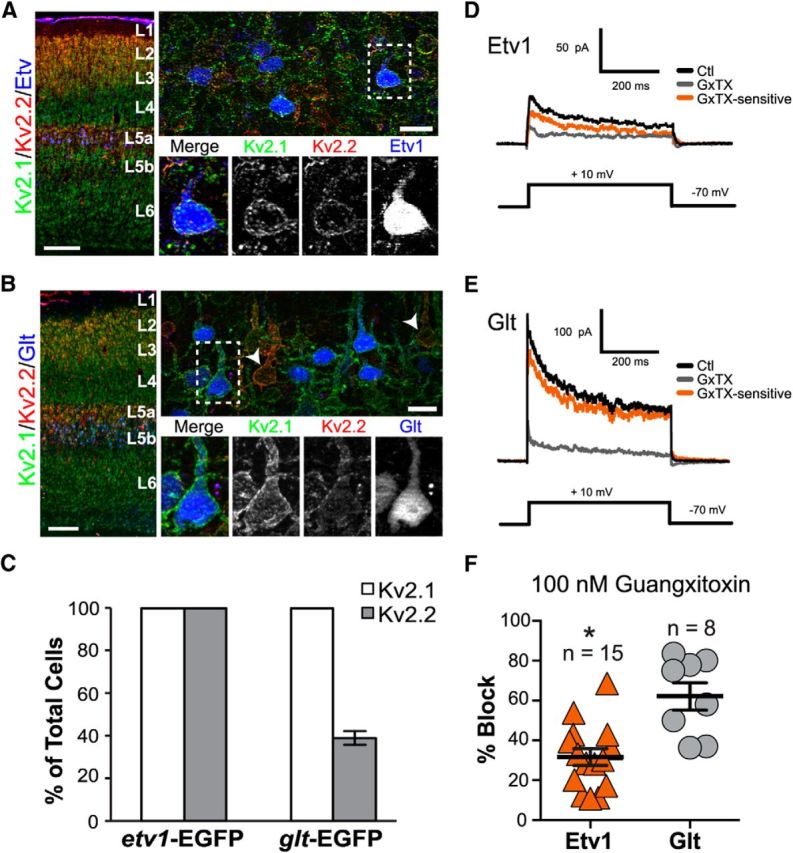
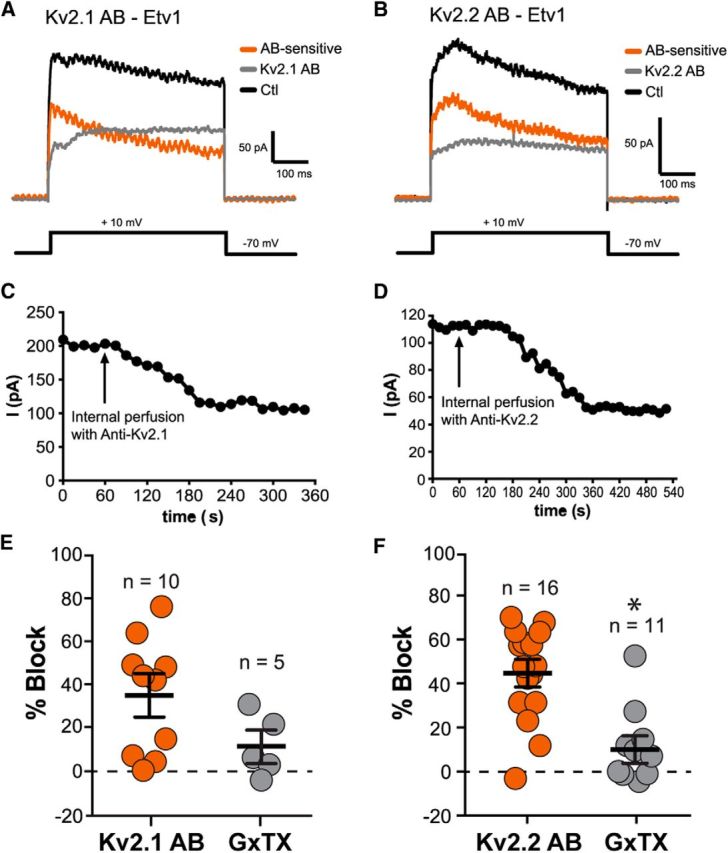
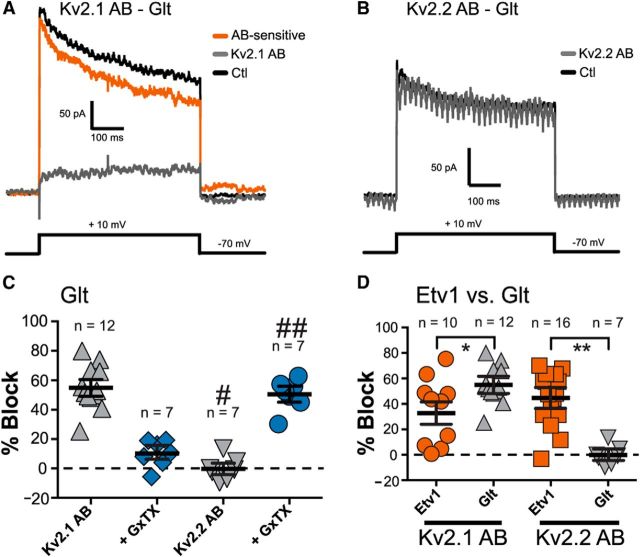
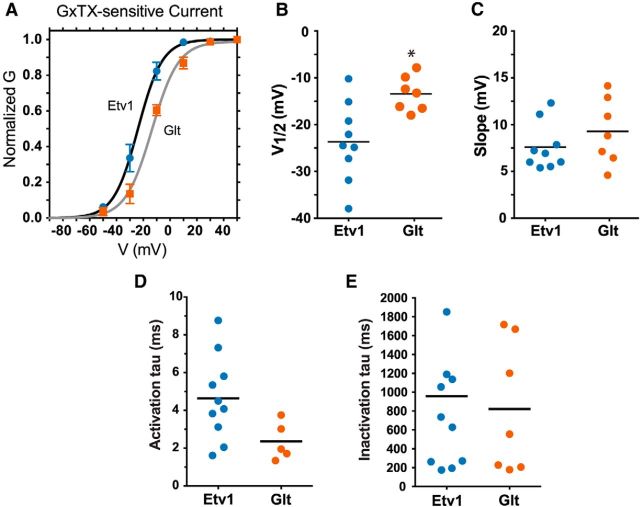
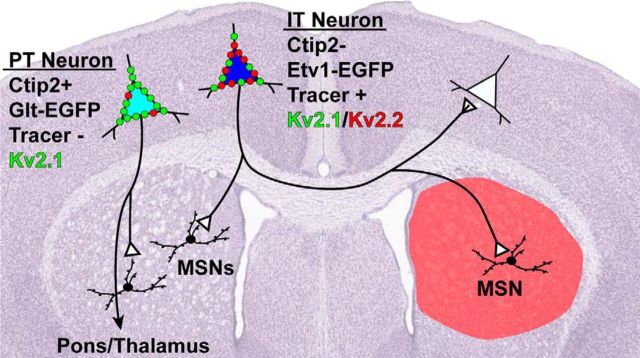
The Kv2 family of voltage-gated potassium channel α subunits, comprising Kv2.1 and Kv2.2, mediate the bulk of the neuronal delayed rectifier K(+) current in many mammalian central neurons. Kv2.1 exhibits robust expression across many neuron types and is unique in its conditional role in modulating intrinsic excitability through changes in its phosphorylation state, which affect Kv2.1 expression, localization, and function. Much less is known of the highly related Kv2.2 subunit, especially in forebrain neurons. Here, through combined use of cortical layer markers and transgenic mouse lines, we show that Kv2.1 and Kv2.2 are localized to functionally distinct cortical cell types. Kv2.1 expression is consistently high throughout all cortical layers, especially in layer (L) 5b pyramidal neurons, whereas Kv2.2 expression is primarily limited to neurons in L2 and L5a. In addition, L4 of primary somatosensory cortex is strikingly devoid of Kv2.2 immunolabeling. The restricted pattern of Kv2.2 expression persists in Kv2.1-KO mice, suggesting distinct cell- and layer-specific functions for these two highly related Kv2 subunits. Analyses of endogenous Kv2.2 in cortical neurons in situ and recombinant Kv2.2 expressed in heterologous cells reveal that Kv2.2 is largely refractory to stimuli that trigger robust, phosphorylation-dependent changes in Kv2.1 clustering and function. Immunocytochemistry and voltage-clamp recordings from outside-out macropatches reveal distinct cellular expression patterns for Kv2.1 and Kv2.2 in intratelencephalic and pyramidal tract neurons of L5, indicating circuit-specific requirements for these Kv2 paralogs. Together, these results support distinct roles for these two Kv2 channel family members in mammalian cortex.

Significance statement: Neurons within the neocortex are arranged in a laminar architecture and contribute to the input, processing, and/or output of sensory and motor signals in a cell- and layer-specific manner. Neurons of different cortical layers express diverse populations of ion channels and possess distinct intrinsic membrane properties. Here, we show that the Kv2 family members Kv2.1 and Kv2.2 are expressed in distinct cortical layers and pyramidal cell types associated with specific corticostriatal pathways. We find that Kv2.1 and Kv2.2 exhibit distinct responses to acute phosphorylation-dependent regulation in brain neurons in situ and in heterologous cells in vitro. These results identify a molecular mechanism that contributes to heterogeneity in cortical neuron ion channel function and regulation.

Keywords: electrophysiology; immunohistochemistry; localization; modulation; neocortex; network.


Figures

Figure 1.
Figure 1.
Kv2.1 and Kv2.2 exhibit specific and unique expression patterns in mammalian cortex. A, Mouse and rat sagittal brain sections immunolabeled for Kv2.1 (green) and Kv2.2 (red), with Hoechst (blue) to label nuclei. Arrowheads denote S1, in which L4 is relatively devoid of Kv2.2 immunoreactivity. Scale bars, 500 μm. B, Mouse coronal section of S1 barrel cortex immunolabeled for Kv2.1 (green), Kv2.2 (red), and vGlut2 (blue). Arrow denotes septum between barrels. Scale bar, 100 μm. C, Mouse and rat sagittal sections from S1 immunolabeled for Kv2.1 (green), Kv2.2 (red/orange), Satb2 (L2-6, blue), and Ctip2 (L5b-6, cyan/pink). Line plots depict depth profile of average fluorescence intensity calculated for the region within the rectangle across three animals. Data were smoothed (rolling average, 25 points) and normalized to maximum intensity for each channel in MATLAB. Light, thick lines represent the SD. Note that, whereas Kv2.1 expression is relatively consistent across all cortical layers, Kv2.2 shows strongest expression in layers 2 and 5a. Arrowhead in rat section denotes additional Kv2.2 expression in cells of lower L5. Scale bars, 100 μm. D, Mouse and rat sagittal sections from S1 immunolabeled for Kv2.2 (red/orange), Cux1 (L2-4, green), Satb2 (L2-6, blue), and Ctip2 (L5b-6, cyan/pink). Line plots are constructed as in C. Arrowhead highlights the portion of rat L5b exhibiting high Kv2.2 expression. Scale bars, 100 μm. E, Sections of striate visual cortex from mouse, rat, ferret, macaque, and human immunolabeled for Kv2.1 (green) and Kv2.2 (red) and with Hoechst (blue) to label nuclei. Lines demarcate layer boundaries, which are labeled to the right. Scale bar, 200 μm.
Figure 2.
Figure 2.
Kv2.2 expression and subcellular localization is maintained in Kv2.1 KO mice. A, WT (left), Kv2.1-KO (Kv2.1−/−, center), and Kv2.2-KO (Kv2.2−/−, right) sagittal sections immunolabeled for Kv2.1 (green) and Kv2.2 (red) and with Hoechst (blue) to label nuclei and imaged at equal exposures. Rectangles outline regions shown in B. Scale bar, 500 μm. B, Grayscale insets from images in A, again at equal exposures (2.2−/− = Kv2.2-KO; 2.1−/− = Kv2.1-KO). Note that Kv2.2 expression is maintained in L2 and L5a in the Kv2.1-KO. Scale bar, 200 μm. C, Example immunoblot of crude neocortical homogenates from WT, Kv2.1-KO (2.1−/−), and Kv2.2-KO (2.2−/−) mice probed for Kv2.1 (top green band), Kv2.2 (red) and Grp75 (bottom green band) as a loading control. Numbers on the left indicate the mobility of molecular weight standards in kilodaltons. Lower grayscale panels show the individual Kv2.2 and Kv2.1 signals extracted from the color immunoblot. D, Summary graph of differences in Kv2.1 and Kv2.2 protein levels in cortex between WT and KO mice. Fluorescence intensity values were background subtracted and normalized to the loading control (Grp75) and then expressed as percentage of total WT signal. Error bars represent the SEM and symbols represent each independent measurement (n = 5 mice per group). Differences in Kv2 expression between WT and KO samples were not statistically significant as evaluated by independent t test (Kv2.1, p = 0.89; Kv2.2, p = 0.35). E, F, High-magnification images of L5a pyramidal neurons from WT (E) and Kv2.1-KO (2.1−/−) mice (F) immunolabeled for Kv2.2. Note that, whereas Kv2.2 clusters in WT mice are plaque like, Kv2.2 clusters in the Kv2.1-KO are more punctate. Scale bars, 10 μm. G, H, Immunogold electron microscopy of Kv2.2 in WT (G) and Kv2.1-KO (H) tissue. Kv2.2 immunogold particles can be seen as discrete clusters (arrows) in the large caliber dendrite (G, left) and the somatic plasma membrane (G, right). The clustered localization of Kv2.2 is not altered in tissue obtained from Kv2.1-KO mice (H). Kv2.2 immunogold particles are seen as clusters (arrows) in the plasma membrane of the proximal dendrite and soma. Immunogold particles can also be seen in close proximity (arrowheads in H, left) to subsurface cisternae (SSC). t, Axon terminal; c, cytoplasm; d, dendrite; n, nucleus; ssc, subsurface cisternae. Scale bars, 500 nm.
Figure 3.
Figure 3.
Kv2.2 exhibits a less robust response to hypoxia than Kv2.1 in situ. A, Example immunoblot of a crude WT mouse brain membrane fraction treated either with (+AP) or without (−AP) AP and probed for Kv2.1 (green) and Kv2.2 (red). Numbers on the left indicate the mobility of molecular weight standards in kilodaltons. The arrows indicate the phosphorylated form (Kv2.1 Mr ∼125 kDa; Kv2.2 Mr ∼140 kDa) and the arrowheads point to the dephosphorylated form (Kv2.1 Mr ∼95 kDa; Kv2.2 Mr ∼130 kDa). Bottom grayscale panels show the individual Kv2.1 and Kv2.2 signals extracted from the color immunoblot. B, Example immunoblot of crude whole brain homogenates prepared from brains of WT and Kv2.1-KO mice either without (control) or with CO2 treatment before killing. Samples were then incubated with AP (+AP), and proteins were analyzed by immunoblotting for Kv2.1 (green, upper band), Kv2.2 (red) and Grp75 (green, bottom band) as a loading control. Bottom grayscale panel depicts enlarged individual Kv2.2 and Kv2.1 signals from WT samples (left six lanes) of the color immunoblot. C, D, Mouse brain sections prepared from control and CO2-treated mice were double immunolabeled for Kv2.1 (green) and Kv2.2 (red) and cells in L5a (C) and L5b (D) imaged at equal exposure. Inset numbers refer to CV measurements for the depicted cell. Scale bar, 10 μm. E, Summary graph of CV measurements of L5a cells from WT and Kv2.1-KO mice that were either nontreated (control, orange symbols) or CO2 treated (blue symbols). Error bars represent the SEM and symbols represent each experiment (n = 4 mice per group). Differences in CV measurements between control and CO2 were evaluated by one-way randomized block ANOVA followed by Tukey's multiple-comparison test. Note that the y-axis origin begins at 0.5. F, Summary graph of CV measurements of L5b cells from WT and Kv2.1-KO mice. Note that L5b cells containing only Kv2.1 have significantly lower CV measurements both without and with CO2 exposure (left most orange and blue symbols). Data are represented same as in E. Note that the y-axis origin begins at 0.5. #p < 0.06; *p < 0.05; **p < 0.01.
Figure 4.
Figure 4.
Acute regulation after Inm treatment of recombinant Kv2.2 in heterologous cells is distinct from that of Kv2.1. A, High-magnification images of HEK293T cells expressing Kv2.1 (green, top) or Kv2.2 (red, bottom) and either treated with vehicle (left) or Inm (middle) for 15 min before fixation. Right panels depict cells expressing the respective clustering mutants Kv2.1-S586A (top right) and Kv2.2-S605A (bottom right). Inset numbers refer to CV measurements of the entire cell marked by the squares. Nuclei (blue) were labeled with Hoechst. Scale bars, 10 μm. B, Grayscale insets of immunolabeling from within the squares in A. C, High-magnification images of HEK293T cells coexpressing Kv2.1 (green) and Kv2.2 (red) either treated with vehicle (control, left) or Inm (+Inm, right). Again, inset numbers refer to CV measurements of the entire cell marked by the squares. Scale bars, 10 μm. D, Grayscale insets of labeling from within the squares in C. E, Summary graph of CV measurements of transfected HEK293T cells that were either nontreated (Ctrl, green symbols) or Inm-treated (+Inm, orange symbols). Blue symbols represent CV measurements of cells expressing Kv2.1 and Kv2.2 clustering mutants. Error bars represent the SEM across all experiments and symbols represent measurements from each experiment (n = 6 replicates, 25–40 cells per group). Note that the y-axis origin begins at 0.2. Differences in CV measurements between treatments were evaluated by one-way randomized block ANOVA followed by Tukey's multiple-comparison test. ***p < 0.0001. F, High-magnification image of an HEK293T cell after Inm treatment captured with a Zeiss Elyra SIM microscope and immunolabeled for Kv2.1 (green) and Kv2.2 (red). Scale bar, 5 μm. G, Insets of unclustered region from the top box in F and clustered region from the bottom box in F. Numbers in inset refer to the MCC calculated for the entire inset, which measures the co-occurrence of two signals independent of signal proportionality. H, Summary graph of MCC values measured for Kv2.1 (green) and Kv2.2 (red) in clustered and unclustered regions of the same cell (n = 12 cells). Error bars denote mean and SEM for each group. Differences in MCC values were determined by randomized block ANOVA followed by Tukey's multiple-comparison test. **p < 0.01. I, High-magnification images of COS-1 cells expressing Kv2.1 (top) and Kv2.2 (bottom). Scale bars, 10 μm.
Figure 5.
Figure 5.
Biophysical properties of Kv2.2 before and after treatment with AP and Inm. A, Voltage dependence of activation of Kv2.2 (triangles) expressed in HEK293 cells in the absence (black) and presence of AP (green) and Inm (orange). The voltage dependence of activation was determined by plotting the normalized tail current amplitude (at −35 mV) as a function of the prepulse potential (ranging from 60 mV to −60 mV in 10 mV steps). For comparison, the voltage dependence of activation of Kv2.1 (circles) expressed in HEK293 cells before (black) and after AP (green) and Inm (orange) are also represented. Solid and dotted lines represent the Boltzmann fits. B, Voltage dependence of Kv2.2 inactivation in the absence (black) and presence of AP (green) and Inm (orange). The voltage dependence of inactivation was determined by plotting the normalized test pulse amplitude (at +60 mV) as a function of the 5 s prepulse potential (ranging from −80 to 20 mV in 10 mV increments). Solid lines represent the Boltzmann fits. C, Activation and deactivation kinetics of Kv2.2 before (black) and after AP (green) and Inm (orange). Activation kinetics (filled symbols) are obtained by a single exponential function fit to the 500 ms current traces ranging from 60 to 0 mV in 10 mV steps. Deactivation kinetics (open symbols) are derived from a double exponential function fit to the 1 s tail currents (ranging from −10 mV to −80 mV in 10 mV steps) obtained after a 250 ms prepulse to 60 mV resulting in a slow (top points) and fast (bottom points) time constant. Note that the biophysical properties of Kv2.2 are not changed upon AP or Inm treatment, whereas these treatments did affect the Kv2.1 voltage dependence of activation significantly, as demonstrated previously.
Figure 6.
Figure 6.
Differences in Kv2 expression correspond to different cell types. A, B, Rat sagittal sections of S1 were immunolabeled for Kv2.1 (green), Kv2.2 (red), Satb2 (blue), and Ctip2 (cyan, B only). Boxed regions refer to higher-magnification images (right) of L5a (A) and L5b (B). Cells expressing Kv2.1 and Kv2.2 (arrowheads) or only Kv2.1 (arrows) are indicated. Scale bar, 20 μm. C, Cell counts of Satb2+ and Ctip2+ cells labeled for Kv2.1 and Kv2.2 in both rat and mouse. Error bars represent SEM for counts across three animals. DE, Immunolabeling for Kv2s in retrogradely labeled striatal projection neurons. SADΔG-EGFP rabies virus was stereotaxically injected into the dorsolateral striatum of WT mice. D, Low-magnification image of a sagittal section counterstained with Hoechst 33258 (white) showing the site of injection (green). Scale bar, 500 μm. E, Low-magnification image of retrogradely labeled L5 cells ipsilateral to the injection site and immunolabeled for Kv2.1 (green) and Kv2.2 (red), with EGFP signal pseudocolored white. For the inset image, EGFP is pseudocolored blue. Scale bar, 20 μm.
Figure 7.
Figure 7.
Immunohistochemistry and slice electrophysiology confirm differences in Kv2 subunit expression in a subset of L5a and L5b pyramidal neurons. A, B, Mouse sagittal sections from transgenic mice expressing EGFP either in a subset of L5a (Etv1, blue, A) or L5b (Glt, blue, B) neurons were immunolabeled for Kv2.1 (green) or Kv2.2 (red). Low-magnification images of S1 cortex (A, B, left) confirm the localization of Etv1- and Glt-expressing cells (pseudocolored in blue) as belonging to L5a and 5b, respectively. Scale bar, 200 μm. Right panels depict higher-magnification images (40×) of each cell type, again with EGFP pseudocolored in blue. Scale bar, 20 μm. Note that L5b cells with high expression of Kv2.2 (arrowheads, B) are negative for Glt. C, Cell counts of Etv1 and Glt cells labeled for Kv2.1 (Etv cells, 259/259 cells, 100%; Glt cells, 395/395 cells, 100%) and Kv2.2 (Etv cells, 259/259 cells, 100%; Glt cells, 153/395 cells, 38.7%). Cell counts were performed on sections made from four mice per genotype. Error bars represent SEM. DF, Kv2-mediated current in Etv1 and Glt pyramidal neurons. Note different scale bars in D and E. D, In Etv1 neurons, the control current (Ctl; black line) in outside-out macropatches averaged 111 ± 22 pA at 200 ms (mean ± SEM; n = 15 patches). The gray trace indicates current after application of 100 nm GxTX and the orange trace is the GxTX-sensitive current obtained by subtraction of current in GxTX from control current. This patch was from an Etv1 neuron from a P15 mouse. The voltage protocol is shown below. E, In Glt neurons, the control current (Ctl; black line) in outside-out macropatches averaged 139 ± 47 pA at 200 ms (mean ± SEM; n = 8 patches). The gray trace indicates current after application of 100 nm GxTX and the orange trace is the GxTX-sensitive current obtained by subtraction of current in GxTX from control current. The voltage protocol is shown below. This patch was from a Glt neuron from a P17 mouse. F, Scatter plots showing percent block by 100 nm GxTX in patches from Etv1 (n = 15) versus Glt (n = 8) cells. Error bars represent SEM. *Significant difference from Glt (p = 0.00047, unpaired t test).
Figure 8.
Figure 8.
Effects of internal pipette perfusion of antibodies against Kv2.1 or Kv2.2 in patches from Etv1 cells. A, Representative traces for an outside-out patch from an Etv1 neuron (P20 mouse). Black, Control (Ctl) trace during initial baseline period; gray, trace after several minutes perfusion of the pipette and patch contents with Kv2.1 Ab (anti-Kv2.1); orange, anti-Kv2.1 sensitive current (obtained by subtraction). B, Different patch from an Etv1 cell before and after perfusion of anti-Kv2.2 (P13 mouse). The color of the traces are the same as in A. C, Plot of current (I) versus time for patch shown in A, including before and after perfusion with the Kv2.1 Ab. D, Plot of current (I) versus time for patch shown in B before and after perfusion with the Kv2.2 Ab. E, Percentage block by anti-Kv2.1 and additional block by subsequent application of 100 nm GxTX. Error bars indicate SEM. F, Percentage block by anti-Kv2.2 and additional block by subsequent application of 100 nm GxTX. Bars represent mean and ± SEM. *p = 0.0001 for the difference between Kv2.2 AB and GxTX.
Figure 9.
Figure 9.
Effects of internal pipette perfusion of antibodies against Kv2.1 or Kv2.2 in patches from Glt cells. A, Representative traces for an outside-out patch from a Glt neuron (P24 mouse). Black, Control (Ctl) trace during initial baseline period; gray, trace after several minutes perfusion of the pipette and patch contents with Kv2.1 Ab (anti-Kv2.1); orange, anti-Kv2.1 sensitive current (obtained by subtraction). The Kv2.1 Ab blocks nearly all of the current. B, Different patch from a Glt cell before and after perfusion with anti-Kv2.2 (P18 mouse). There was no block by anti-Kv2.2 in this patch. C, Scatter plots showing population data for percentage block by anti-Kv2.1 and additional block by subsequent application of 100 nm GxTX. Also shown is population data for block by anti-Kv2.2 (and subsequent GxTX application). Error bars represent SEM. #Significant difference between percentage block by anti-Kv2.1 and anti-Kv2.2 (and their associated application of GxTX). #p = 0.0000001; ##p = 0.00001. D, Scatter plots of population data for percent block by anti-Kv2.1 and anti-Kv2.2 in patches from Etv1 and Glt cells. Anti-Kv2.1 blocked a significantly higher percentage of current in patches from Glt cells versus Etv1 cells. Anti-Kv2.2 blocked significantly more current in patches from Etv1 cells versus Glt cells. Error bars indicate SEM. *p = 0.035; **p = 0.00002 for the difference between Etv1 and Glt cells for the data indicated by brackets.
Figure 10.
Figure 10.
Biophysical properties of GxTX-sensitive current from Etv1 and Glt cells of L5. A, Average normalized steady-state activation curves for somatic outside-out macropatch recordings of GxTX-sensitive current from Etv1 (n = 9) and Glt cells (n = 7). For Etv1, the V1/2 was significantly more negative (−23.7 ± 2.7 mV) than for Glt cells (−13.4 ± 1.3 mV) by unpaired t test. B, Scatter plot of V1/2 for the individual cells contributing to activation curves in A. Horizontal line represents the mean. *Significant difference from Etv1 (p < 0.01). C, Scatter plot for Boltzmann slope for individual cells contributing to activation curves in A. The horizontal line represents the mean. The mean slope did not differ significantly between Etv1 and Glt cells by unpaired t test. D, Scatter plot of activation tau at 0 mV for Etv1 and Glt cells. The activation time constant was marginally significantly different (p < 0.051) between Etv1 cells (4.6 ± 0.7 ms; n = 10) and Glt cells (2.4 ± 0.4 ms; n = 5) by unpaired t test. E, Scatter plot of inactivation tau for Etv1 and Glt cells. Our 500 ms steps were not long enough for precise estimate of the slow inactivation time constants for the GxTX-sensitive current, but the estimated inactivation tau at 0 mV did not differ between Etv1 cells (957 ± 261 ms; n = 11 cells) and Glt cells (822 ± 262 ms; n = 7 cells).
Figure 11.
Figure 11.
Model for cellular specificity of Kv2 paralog expression in L5 pyramidal neurons of cerebral cortex. L5a IT pyramidal projection neurons are negative for Ctip2 but positive for Etv1-EGFP and a contralaterally placed tracer in striatum and express high levels of both Kv2.1 and Kv2.2. In contrast, L5b PT pyramidal projection neurons are positive for Ctip2 and Glt-EGFP but negative for a contralaterally placed tracer in striatum and express high levels of Kv2.1 but low levels of, to no, Kv2.2. MSN, Striatal medium spiny neuron. Levels of Kv2.1 and Kv2.2 in the different pyramidal cell classes are a simplified representation meant to convey the overall differences in Kv2.1 and Kv2.2 expression levels across the population of IT and PT neurons studied here and do not account for variations within the population of IT and PT cells.

References

    1. Alcamo EA, Chirivella L, Dautzenberg M, Dobreva G, Fariñas I, Grosschedl R, McConnell SK. Satb2 regulates callosal projection neuron identity in the developing cerebral cortex. Neuron. 2008;57:364–377. doi: 10.1016/j.neuron.2007.12.012. - DOI - PubMed
    1. Antonucci DE, Lim ST, Vassanelli S, Trimmer JS. Dynamic localization and clustering of dendritic Kv2.1 voltage-dependent potassium channels in developing hippocampal neurons. Neuroscience. 2001;108:69–81. doi: 10.1016/S0306-4522(01)00476-6. - DOI - PubMed
    1. Arlotta P, Molyneaux BJ, Chen J, Inoue J, Kominami R, Macklis JD. Neuronal subtype-specific genes that control corticospinal motor neuron development in vivo. Neuron. 2005;45:207–221. doi: 10.1016/j.neuron.2004.12.036. - DOI - PubMed
    1. Bocksteins E, Raes AL, Van de Vijver G, Bruyns T, Van Bogaert PP, Snyders DJ. Kv2.1 and silent Kv subunits underlie the delayed rectifier K+ current in cultured small mouse DRG neurons. Am J Physiol Cell Physiol. 2009;296:C1271–C1278. doi: 10.1152/ajpcell.00088.2009. - DOI - PMC - PubMed
    1. Brown SP, Hestrin S. Cell-type identity: a key to unlocking the function of neocortical circuits. Curr Opin Neurobiol. 2009;19:415–421. doi: 10.1016/j.conb.2009.07.011. - DOI - PMC - PubMed

Substances