. 2015 Nov 3;16(11):26291-302.
doi: 10.3390/ijms161125948.

Notch Cooperates with Survivin to Maintain Stemness and to Stimulate Proliferation in Human Keratinocytes during Ageing

Affiliations

Notch Cooperates with Survivin to Maintain Stemness and to Stimulate Proliferation in Human Keratinocytes during Ageing

Elisabetta Palazzo et al. Int J Mol Sci. .

Abstract

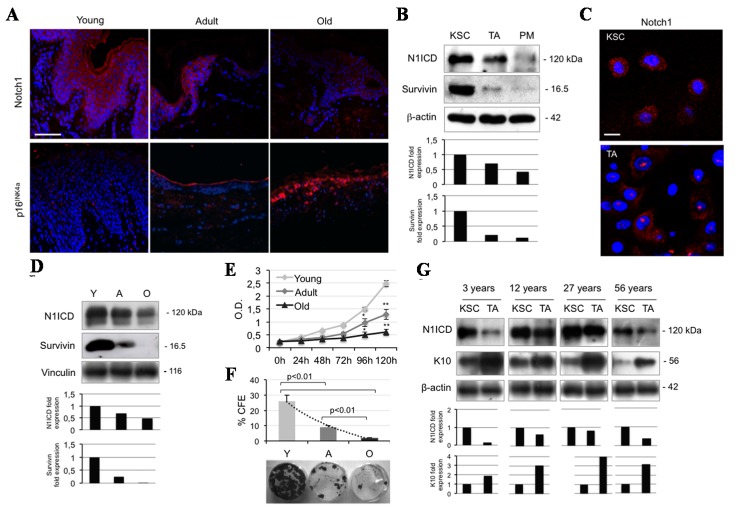
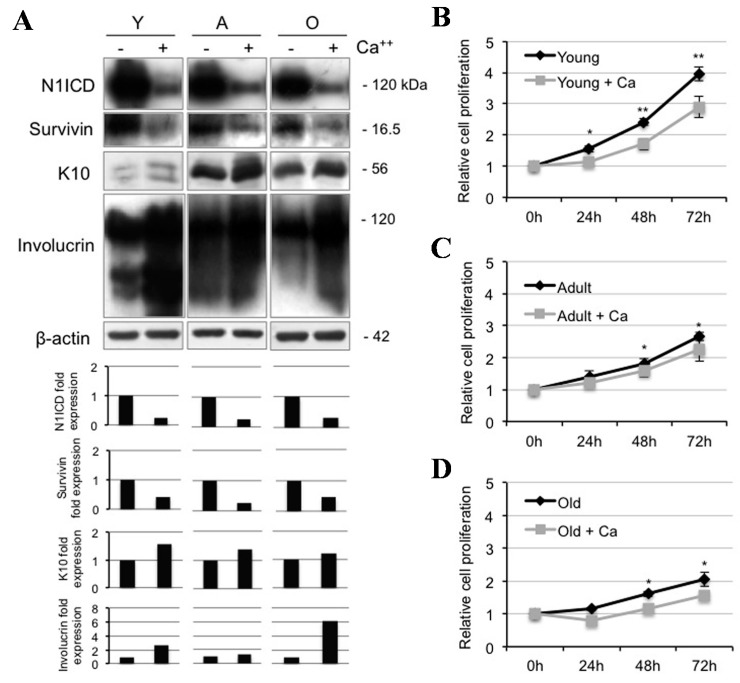
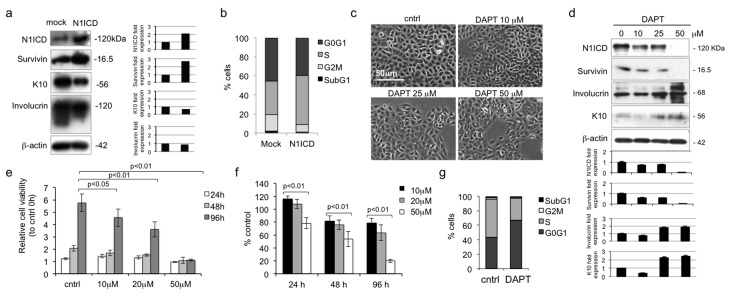
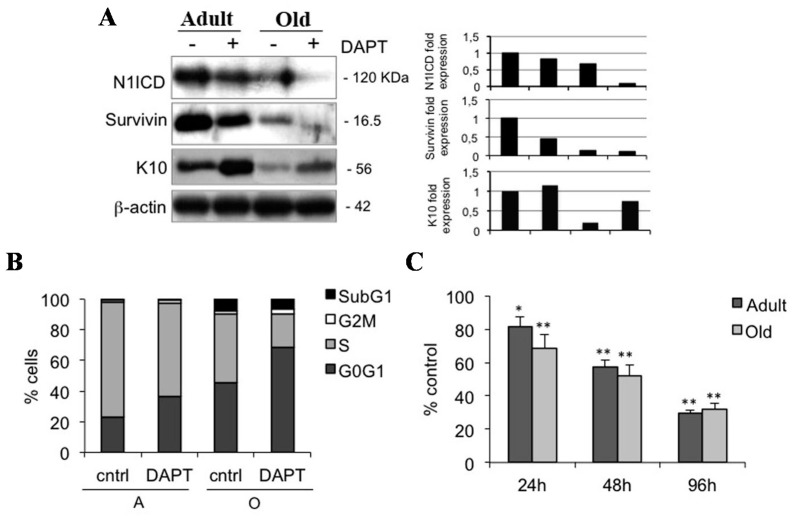
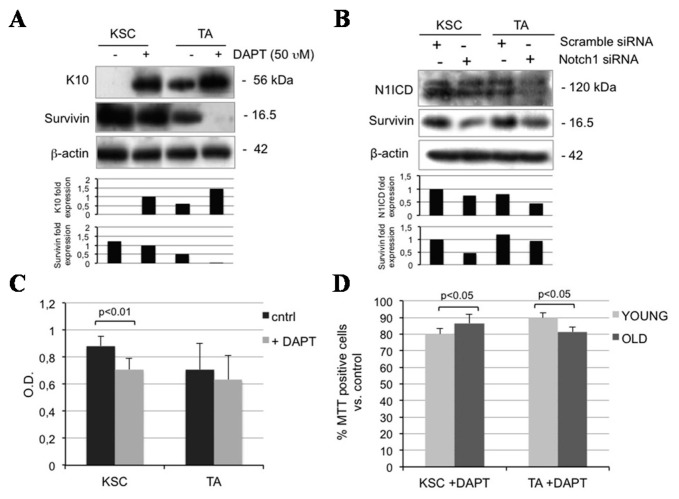
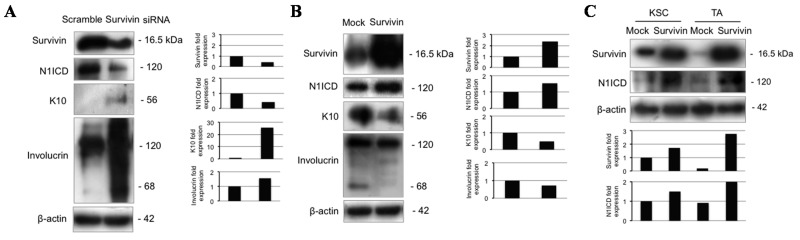
The Notch signaling pathway orchestrates cell fate by either inducing cell differentiation or maintaining cells in an undifferentiated state. This study aims to evaluate Notch expression and function in normal human keratinocytes. Notch1 is expressed in all epidermal layers, though to a different degree of intensity, with a dramatic decrease during ageing. Notch1 intracellular domain (N1ICD) levels are decreased during transit from keratinocyte stem cells (KSC) to transit amplifying (TA) cells, mimicking survivin expression in samples from donors of all ages. Calcium markedly reduces N1ICD levels in keratinocytes. N1ICD overexpression induces the up-regulation of survivin and the down-regulation of keratin 10 and involucrin, while increasing the S phase of the cell cycle. On the other hand, Notch1 inhibition (DAPT) dose-dependently decreases survivin, stimulates differentiation, and reduces keratinocyte proliferation in samples from donors of all ages. Silencing Notch downgrades survivin and increases keratin 10. In addition, Notch1 inhibition decreases survivin levels and proliferation both in KSC and TA cells. Finally, while survivin overexpression decreases keratinocyte differentiation and increases N1ICD expression both in KSC and TA cells, silencing survivin results in N1ICD down-regulation and an increase in differentiation markers. These results suggest that the Notch1/survivin crosstalk contributes to the maintenance of stemness in human keratinocytes.

Keywords: Notch1; keratinocytes; stem cells; survivin.


Figures

Figure 1
Figure 1
Notch1 levels decrease both during ageing and cell differentiation in human keratinocytes. (A) Immunofluorescence staining for Notch1 and p16INK4a (red) in young, adult, and old skin biopsies. Cell nuclei were counterstained with DAPI (blue) (Bar = 200 µm); (B) Cells were analyzed immediately after separation, and levels of Notch1 activation (N1ICD) and survivin were determined by Western blot (WB) analysis. β-actin was used as loading control. Bar graphs show the average densitometry values normalized to β-actin; (C) Immunofluorescence staining was performed in situ on KSC (keratinocyte stem cells) and TA (transit amplifying) cell culture for survivin expression (red) and cell nuclei were counterstained with DAPI (blue) (Bar = 20 µm); (D) Survivin levels were analyzed immediately after isolation in young (Y), adult (A), and old (O) keratinocytes, and determined by WB analysis. Vinculin was used as loading control. Bar graphs show the average densitometry values normalized to vinculin; (E) The ability to proliferate in vitro of young, adult, and old keratinocytes was evaluated by MTT assay (* 0.01 < p < 0.05; ** p < 0.01); (F) Clonal growth assessment of young, adult, and old keratinocyte by CFE assay. At the bottom, representative pictures of CFE obtained by growing cells at clonal density and stained with CV are shown; (G) KSC and TA cells were analyzed immediately after separation, and levels of N1ICD and K10 (keratin 10) were determined by WB analysis. β-actin was used as loading control. Bar graphs show the average densitometry values normalized to β-actin.
Figure 2
Figure 2
Calcium-induced differentiation decreases Notch1 activation during ageing. (A) Young (Y), adult (A), and old (O) keratinocytes were analyzed 24 h after 1.8 mM calcium treatment, and levels of Notch1 activation, survivin, K10, and involucrin were determined by Western Blotting analysis. β-actin was used as loading control. Bar graphs show the average densitometry values normalized to β-actin; (B) Relative cell proliferation of young keratinocytes with or without 1.8 mM calcium treatment by MTT assay; (C) Relative cell proliferation of adult keratinocytes with or without 1.8 mM calcium treatment by MTT assay; and (D) Relative cell proliferation of old keratinocytes with or without 1.8 mM calcium treatment by MTT assay. * 0.01 < p < 0.05; ** p < 0.01.
Figure 3
Figure 3
Notch1 inhibition reduces proliferation and increases differentiation in young keratinocytes. (a) Young keratinocytes were analyzed 48 h after pBABEpuro or pBABEpuroN1ICD infection, and levels of N1ICD, survivin, K10 and involucrin were determined by Western blotting analysis. β-actin was used as loading control. Bar graphs show the average densitometry values normalized to β-actin; (b) Cell cycle was evaluated in young keratinocytes 48 h after pBABEpuro or pBABEpuroN1ICD infection by flow cytometry; (c) Keratinocyte cultures of young donors were photographed at 24 h after 0, 10, 25, 50 µM DAPT treatment; (d) Cells were analyzed 24 h after DAPT treatment, and levels of N1ICD, survivin, involucrin, and K10 were determined by Western blotting analysis. β-actin was used as loading control. Bar graphs show the average densitometry values normalized to β-actin; (e) Relative ratio of young cell proliferation by MTT assay. Normalization was calculated as fold change compared to control at 0 h; (f) Relative percentile quantification of young cell proliferation by MTT assay. Normalization was calculated compared to 0 µM DAPT; (g) Cell cycle was evaluated in young keratinocytes 24 h after 50 µM DAPT treatment by flow cytometry.
Figure 4
Figure 4
Notch1 inhibition decreases proliferation in adult and old keratinocytes. (A) Adult and old cells were analyzed 24 h after 0 and 50 µM DAPT treatment, and levels of N1ICD, survivin, and K10 were determined by Western blotting analysis. β-actin was used as loading control. Bar graphs show the average densitometry values normalized to β-actin; (B) Cell cycle was evaluated in adult and old keratinocytes 24 h after 0 and 50 µM DAPT treatment by flow cytometry; (C) Relative percentile quantification of adult and old cell proliferation after 50 µM DAPT treatment by MTT assay. Normalization was calculated as compared to control. * 0.01 < p < 0.05; ** p < 0.01.
Figure 5
Figure 5
Notch1 inhibition affects both KSC and TA cells. (A) KSC and TA cells were analyzed 24 h after 0 and 50 µM DAPT treatment, and levels of survivin and K10 were determined by Western blotting. β-actin was used as loading control. Bar graphs show the average densitometry values normalized to β-actin; (B) KSC and TA cells were analyzed 48 h after Notch1 silencing, and levels of N1ICD and survivin were determined by Western blotting. β-actin was used as loading control. Bar graphs show the average densitometry values normalized to β-actin; (C) The ability to proliferate in vitro of KSC and TA cells after 0 and 50 µM DAPT treatment was evaluated by MTT assay; (D) Relative percentile quantification of both young and old KSC and TA cell proliferation after 50 µM DAPT treatment by MTT assay. Normalization was calculated compared to control.
Figure 6
Figure 6
Survivin modulates Notch1 and keratinocyte differentiation. (A) Keratinocytes were analyzed 48 h after survivin silencing, and levels of survivin, N1ICD, K10 and involucrin were determined by Western blotting. β-actin was used as loading control. Bar graphs show the average densitometry values normalized to β-actin; (B) Keratinocytes were analyzed 48 h after pcz-CFG5.1-EGFP or pcz-CFG5.1-Survivin-EGFP infection, and levels of survivin, N1ICD, K10, and involucrin were determined by Western blotting analysis. β-actin was used as loading control. Bar graphs show the average densitometry values normalized to β-actin; (C) KSC and TA cells were analyzed 48 h after pcz-CFG5.1-EGFP or pcz-CFG5.1-Survivin-EGFP infection, and levels of survivin and N1ICD were determined by Western blotting analysis. β-actin was used as loading control. Bar graphs show the average densitometry values normalized to β-actin.

References

    1. Livshits G., Kobielak A., Fuchs E. Governing epidermal homeostasis by coupling cell-cell adhesion to integrin and growth factor signaling, proliferation, and apoptosis. Proc. Natl. Acad. Sci. USA. 2012;109:4886–4891. doi: 10.1073/pnas.1202120109. - DOI - PMC - PubMed
    1. Pincelli C., Marconi A. Keratinocyte stem cells: Friends and foes. J. Cell Physiol. 2010;225:310–315. doi: 10.1002/jcp.22275. - DOI - PubMed
    1. Dallaglio K., Marconi A., Truzzi F., Lotti R., Palazzo E., Petrachi T., Saltari A., Coppini M., Pincelli C. E-FABP induces differentiation in normal human keratinocytes and modulates the differentiation process in psoriatic keratinocytes in vitro. Exp. Dermatol. 2013;22:255–261. doi: 10.1111/exd.12111. - DOI - PubMed
    1. Radoja N., Gazel A., Banno T., Yano S., Blumenberg M. Transcriptional profiling of epidermal differentiation. Physiol. Genom. 2006;27:65–78. doi: 10.1152/physiolgenomics.00031.2006. - DOI - PubMed
    1. Truzzi F., Saltari A., Palazzo E., Lotti R., Petrachi T., Dallaglio K., Gemelli C., Grisendi G., Dominici M., Pincelli C., et al. CD271 mediates stem cells to early progeny transition in human epidermis. J. Investig. Dermatol. 2015;135:786–795. doi: 10.1038/jid.2014.454. - DOI - PubMed

Publication types

MeSH terms