Observational Study
. 2015 Nov 3;7(11):9079-95.
doi: 10.3390/nu7115452.

Synergistic Effects of Human Milk Nutrients in the Support of Infant Recognition Memory: An Observational Study

Affiliations
Observational Study

Synergistic Effects of Human Milk Nutrients in the Support of Infant Recognition Memory: An Observational Study

Carol L Cheatham et al. Nutrients. .

Abstract

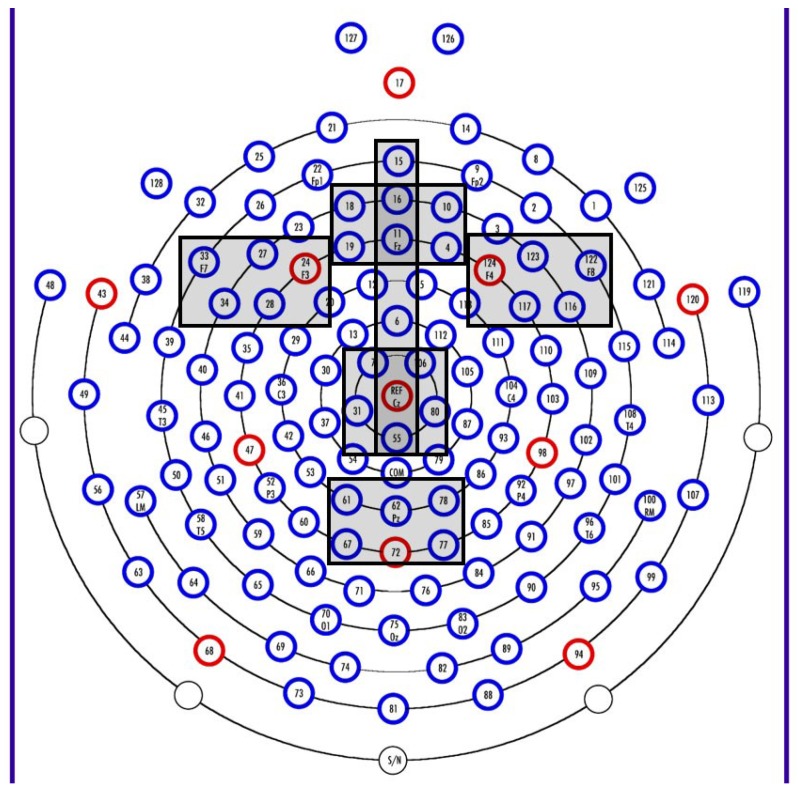
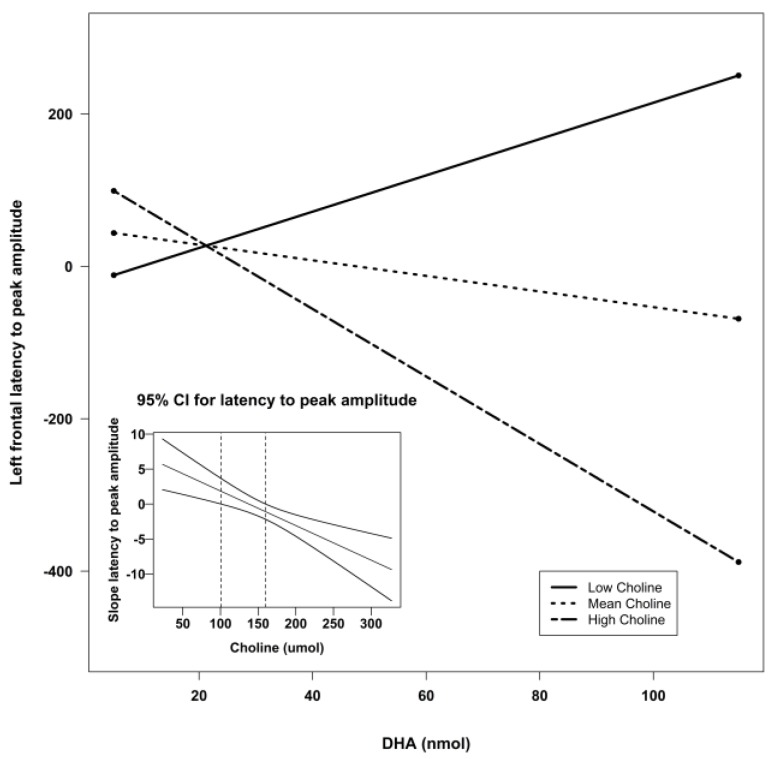
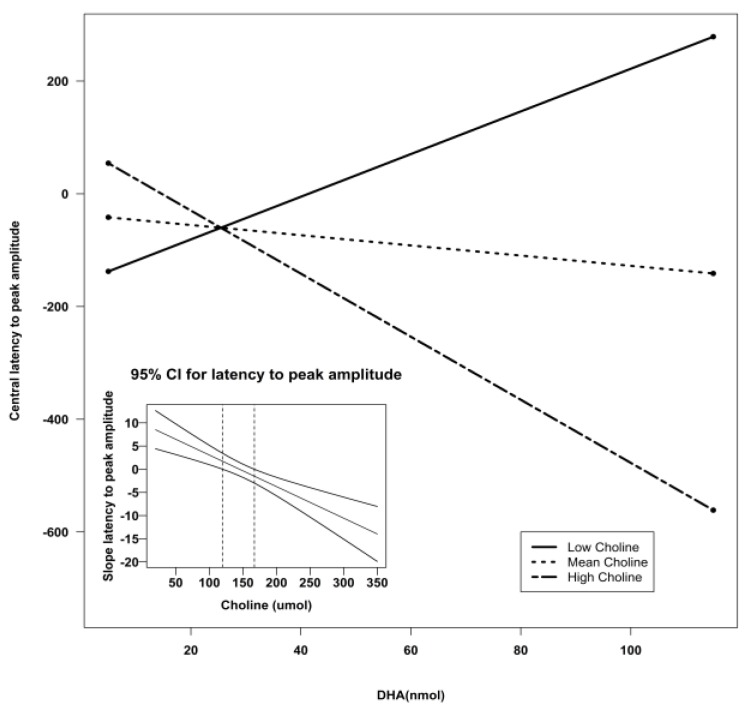
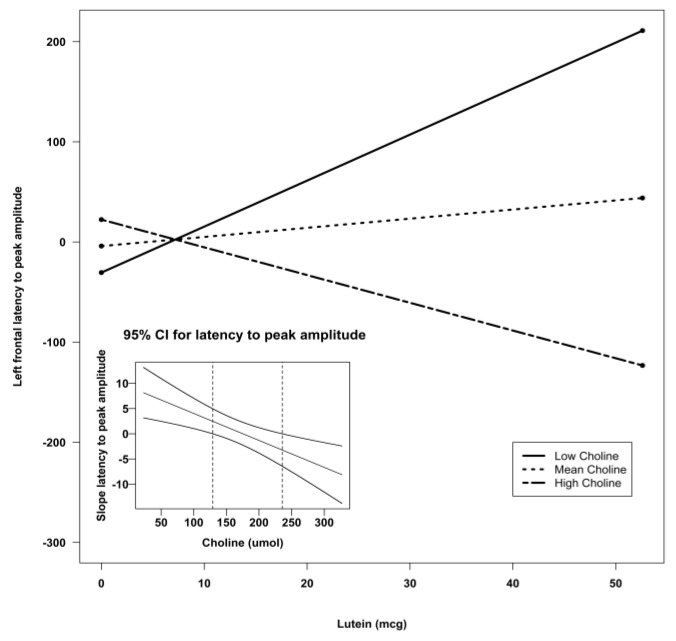
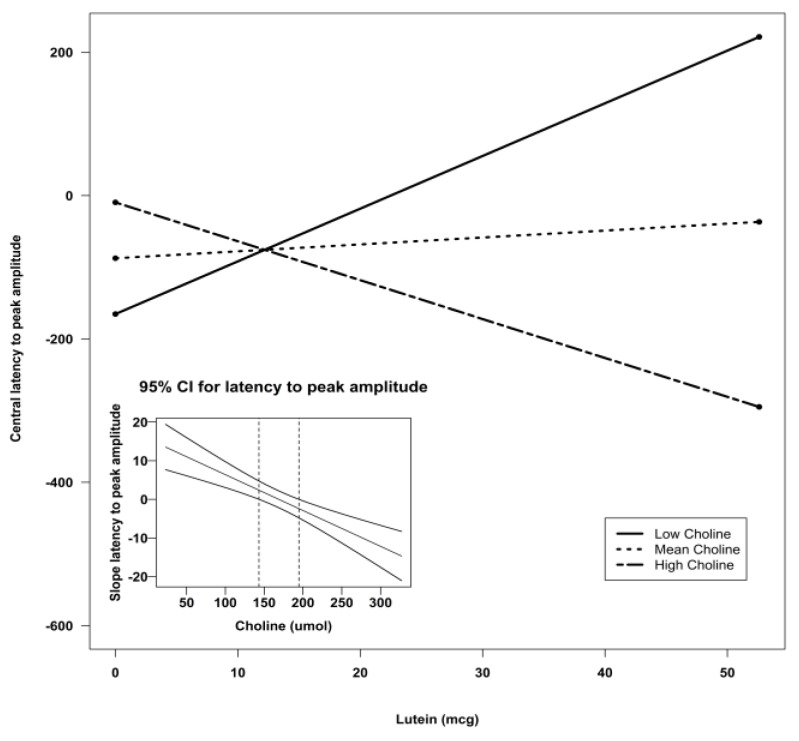
The aim was to explore the relation of human milk lutein; choline; and docosahexaenoic acid (DHA) with recognition memory abilities of six-month-olds. Milk samples obtained three to four months postpartum were analyzed for fatty acids, lutein, and choline. At six months, participants were invited to an electrophysiology session. Recognition memory was tested with a 70-30 oddball paradigm in a high-density 128-lead event-related potential (ERP) paradigm. Complete data were available for 55 participants. Data were averaged at six groupings (Frontal Right; Frontal Central; Frontal Left; Central; Midline; and Parietal) for latency to peak, peak amplitude, and mean amplitude. Difference scores were calculated as familiar minus novel. Final regression models revealed the lutein X free choline interaction was significant for the difference in latency scores at frontal and central areas (p < 0.05 and p < 0.001; respectively). Higher choline levels with higher lutein levels were related to better recognition memory. The DHA X free choline interaction was also significant for the difference in latency scores at frontal, central, and midline areas (p < 0.01; p < 0.001; p < 0.05 respectively). Higher choline with higher DHA was related to better recognition memory. Interactions between human milk nutrients appear important in predicting infant cognition, and there may be a benefit to specific nutrient combinations.

Keywords: DHA; breastmilk; choline; electrophysiology; infant cognition; lutein; nutrition; recognition memory; synergy.


Figures

Figure 1
Figure 1
Sensor map showing the clusters used in analyses: FrontalZ (4, 10, 11, 16, 18, 19), FrontalL (24, 27, 28, 34, 33), FrontalR (116, 117, 122, 123, 124), CentralZ (7, 31, 55, 80, 106, REF), ParietalZ (61, 62, 67, 72, 77, 78), and Midline (6, 11, 15, 16, 55, REF).
Figure 2
Figure 2
Simple slopes model of DHA by choline interaction for latency to peak amplitude at the left frontal sensors. Negative numbers are indicative of better recognition. The figure depicts the effect of DHA at high, mean, and low levels of choline. Low choline was defined as 1 SD below the mean, and high choline was defined as 1 SD above the mean. Sample sizes for each group were as follows: low choline, n = 9; mean choline, n = 41; and high choline, n = 10. The embedded graph shows the 95% CIs for the slope of the latency to peak amplitude at left frontal sensors. The slope outside the dotted lines is significant. CI: confidence interval; DHA: docosahexaenoic acid; SD: standard deviation.
Figure 3
Figure 3
Simple slopes model of DHA by choline interaction for latency to peak amplitude at the central sensors. Negative numbers are indicative of better recognition. The figure depicts the effect of DHA at high, mean, and low levels of choline. Low choline was defined as 1 SD below the mean, and high choline was defined as 1 SD above the mean. Sample sizes for each group were as follows: low choline, n = 9; mean choline, n = 41; and high choline, n = 10. The embedded graph shows the 95% CIs for the slope of the latency to peak amplitude at central sensors. The slope outside the dotted lines is significant CI: confidence interval; DHA: docosahexaenoic acid; SD: standard deviation.
Figure 4
Figure 4
Simple slopes model of DHA by choline interaction for latency to peak amplitude at the midline sensors. Negative numbers are indicative of better recognition. The figure depicts the effect of DHA at high, mean, and low levels of choline. Low choline was defined as 1 SD below the mean, and high choline was defined as 1 SD above the mean. Sample sizes for each group were as follows: low choline, n = 9; mean choline, n = 41; and high choline, n = 10. The embedded graph shows the 95% CIs for the slope of the latency to peak amplitude at midline sensors. The slope to the right of the dotted lines is significant. CI: confidence interval; DHA: docosahexaenoic acid; SD: standard deviation.
Figure 5
Figure 5
Simple slopes model of lutein by choline interaction for latency to peak amplitude at the left frontal sensors. Negative numbers are indicative of better recognition. The figure depicts the effect of lutein at high, mean, and low levels of choline. Low choline was defined as 1 SD below the mean, and high choline was defined as 1 SD above the mean. Sample sizes for each group were as follows: low choline, n = 9; mean choline, n = 41; and high choline, n = 10. The embedded graph shows the 95% CIs for the slope of the latency to peak amplitude at left frontal sensors. The slope outside the dotted lines is significant. CI: confidence interval; SD: standard deviation.
Figure 6
Figure 6
Simple slopes model of lutein by choline interaction for latency to peak amplitude at the central sensors. Negative numbers are indicative of better recognition. The figure depicts the effect of lutein at high, mean, and low levels of choline. Low choline was defined as 1 SD below the mean, and high choline was defined as 1 SD above the mean. Sample sizes for each group were as follows: low choline, n = 9; mean choline, n = 41; and high choline, n = 10. The embedded graph shows the 95% CIs for the slope of the latency to peak amplitude at central sensors. The slope outside the dotted lines is significant. CI: confidence interval; SD: standard deviation.

References

    1. Cheng R.K., Scott A.C., Penney T.B., Williams C.L., Meck W.H. Prenatal-choline supplementation differentially modulates timing of auditory and visual stimuli in aged rats. Brain Res. 2008;1237:167–175. - PubMed
    1. Cheatham C.L., Goldman B.D., Fischer L.M., da Costa K.A., Reznick J.S., Zeisel S.H. Phosphatidylcholine supplementation in pregnant women consuming moderate-choline diets does not enhance infant cognitive function: A randomized, double-blind, placebo-controlled trial. Am. J. Clin. Nutr. 2012;96:1465–1472. - PMC - PubMed
    1. Strain J.J., McSorley E.M., van Wijngaarden E., Kobrosly R.W., Bonham M.P., Mulhern M.S., McAfee A.J., Davidson P.W., Shamlaye C.F., Henderson J., et al. Choline status and neurodevelopmental outcomes at 5 years of age in the seychelles child development nutrition study. Br. J. Nutr. 2013;110:330–336. - PMC - PubMed
    1. Wu B.T., Dyer R.A., King D.J., Richardson K.J., Innis S.M. Early second trimester maternal plasma choline and betaine are related to measures of early cognitive development in term infants. PLoS ONE. 2012;7:e43448. - PMC - PubMed
    1. Villamor E., Rifas-Shiman S.L., Gillman M.W., Oken E. Maternal intake of methyl-donor nutrients and child cognition at 3 years of age. Paediatr. Perinat. Epidemiol. 2012;26:328–335. - PMC - PubMed

Publication types