. 2015 Nov 5;10(11):e0141854.
doi: 10.1371/journal.pone.0141854. eCollection 2015.

A Multi-Level Bayesian Analysis of Racial Bias in Police Shootings at the County-Level in the United States, 2011-2014

Affiliations

A Multi-Level Bayesian Analysis of Racial Bias in Police Shootings at the County-Level in the United States, 2011-2014

Cody T Ross. PLoS One. .

Abstract

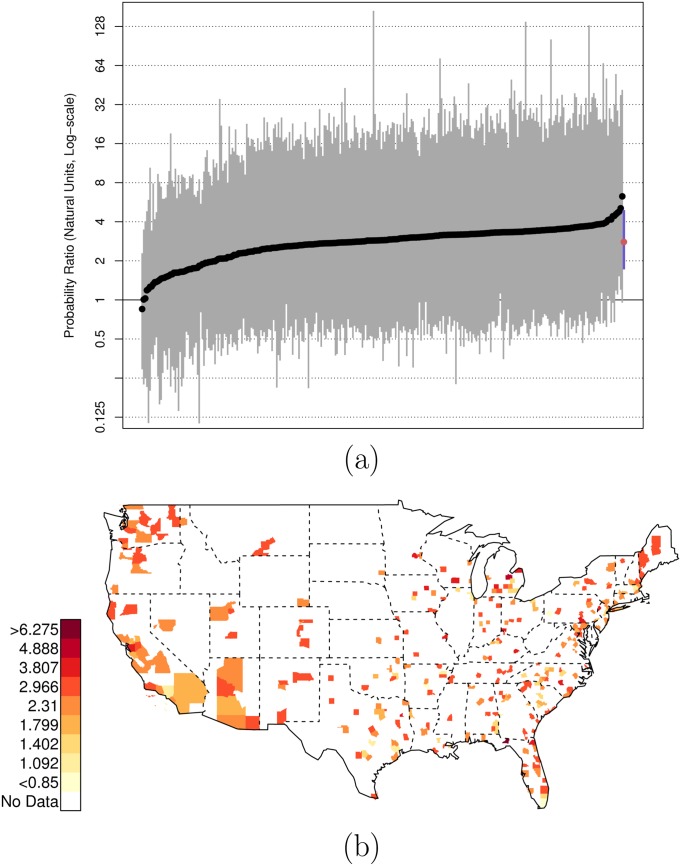
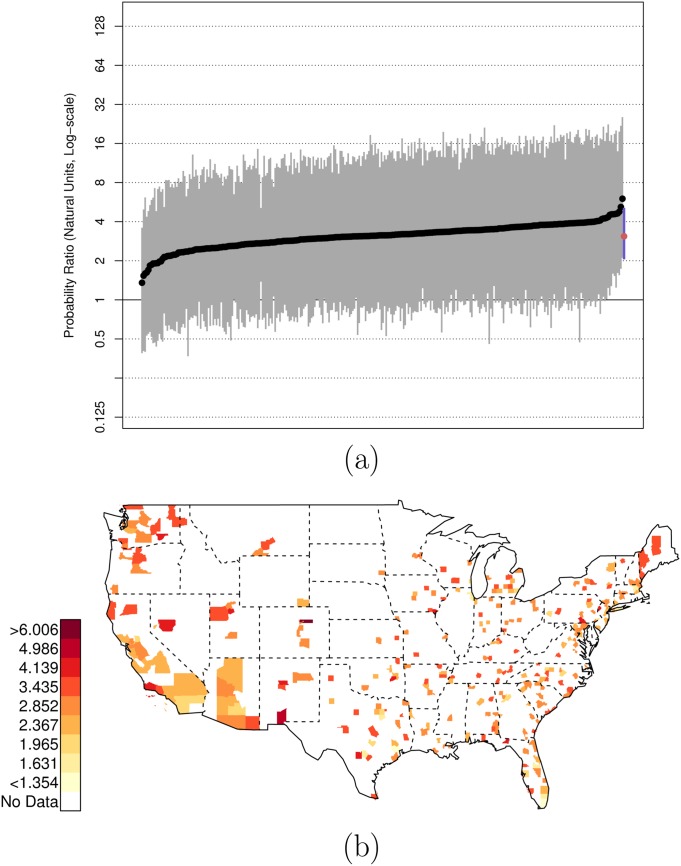
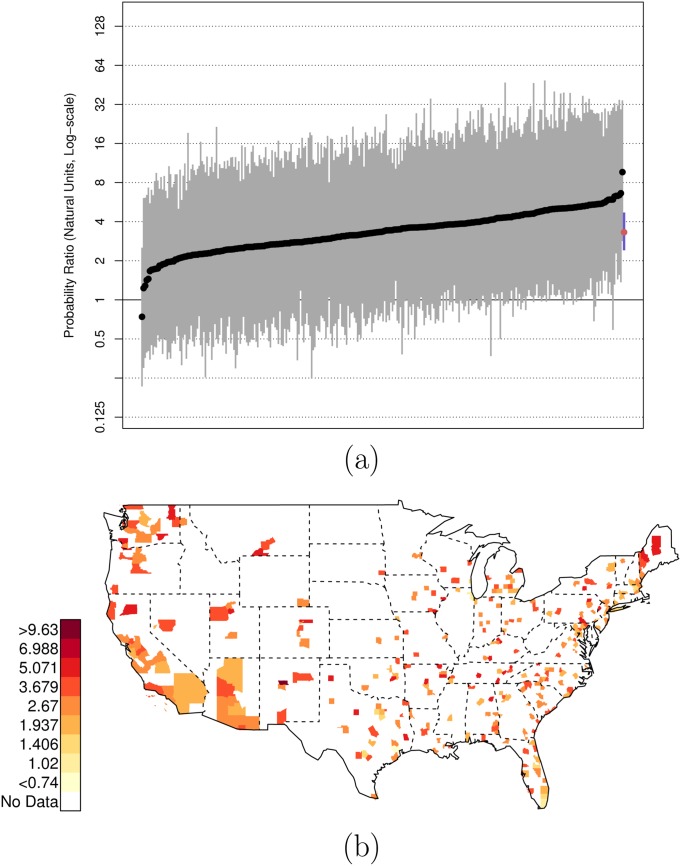
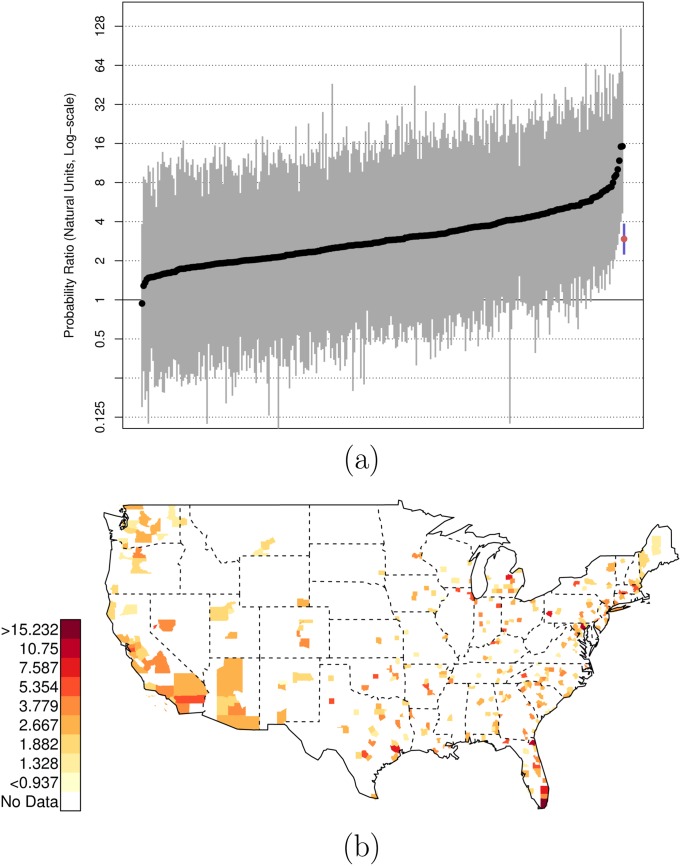
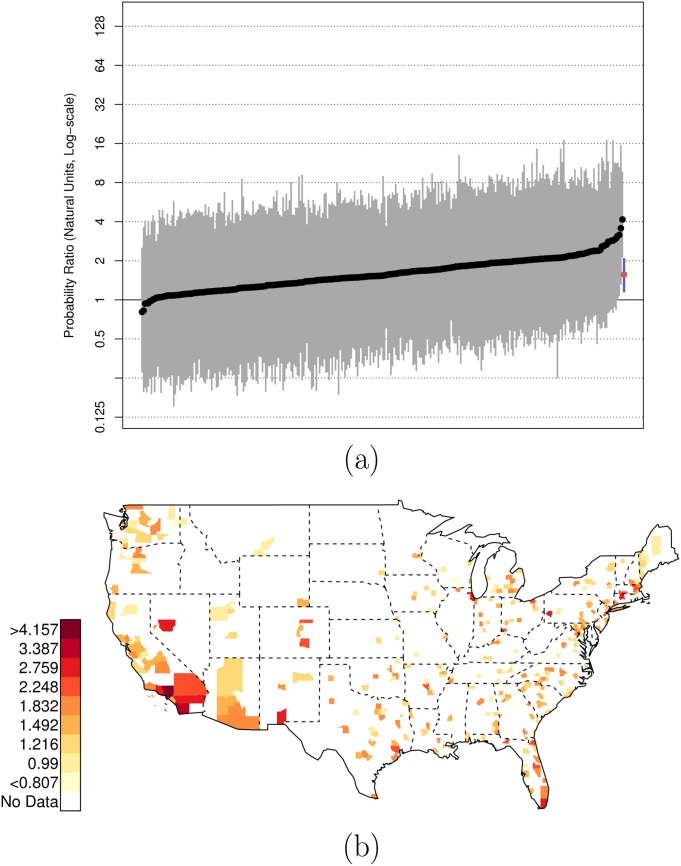
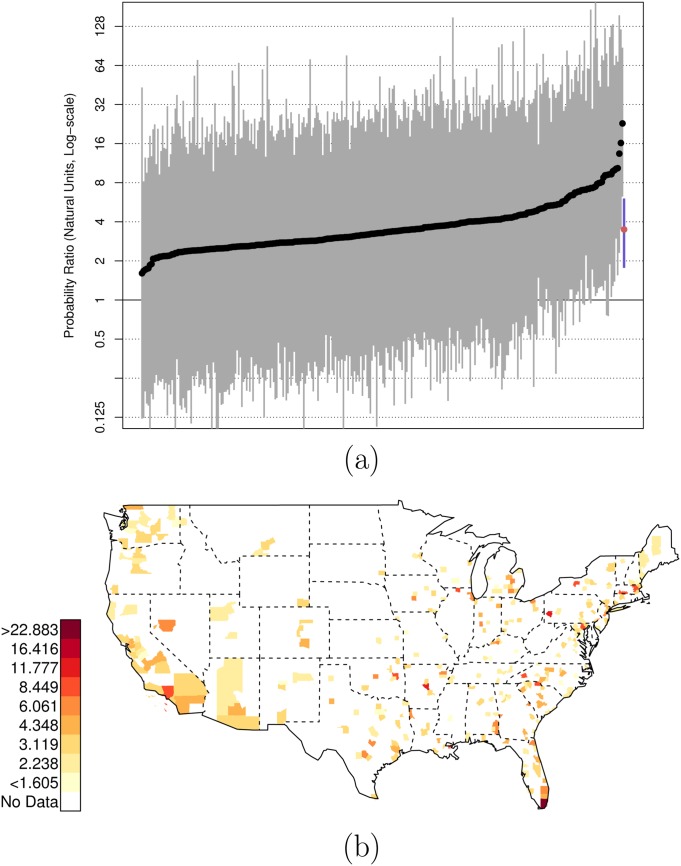
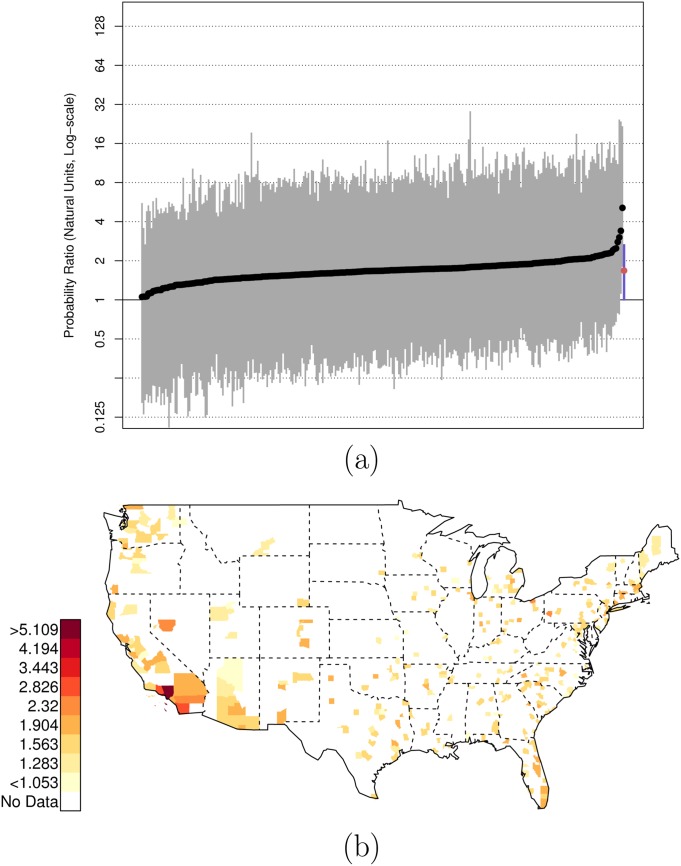
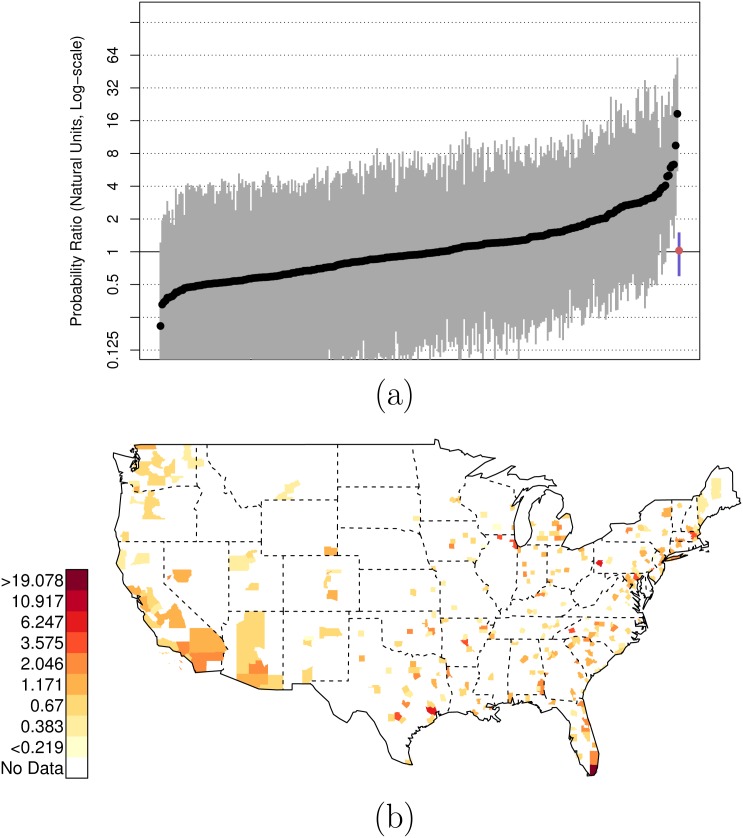
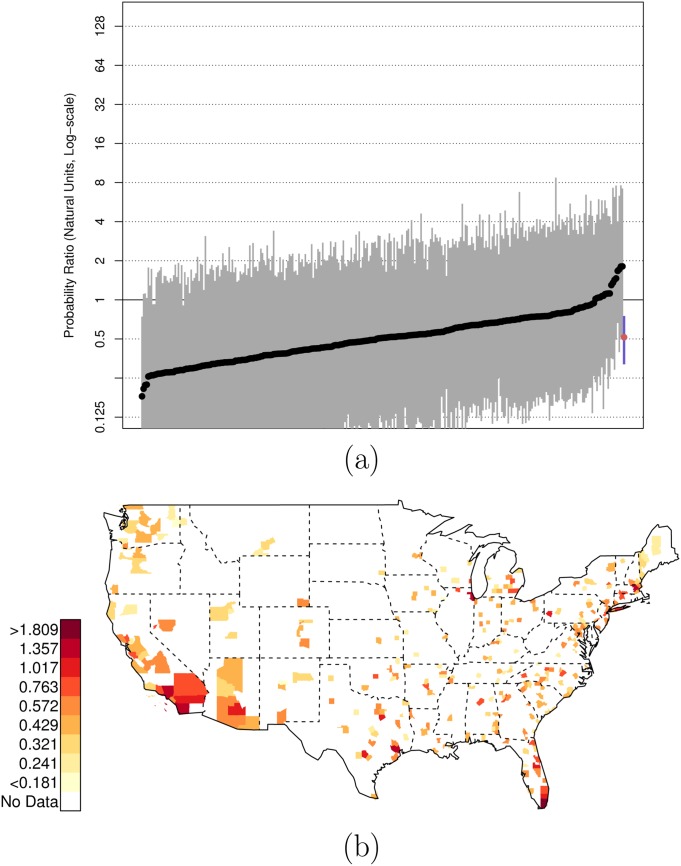
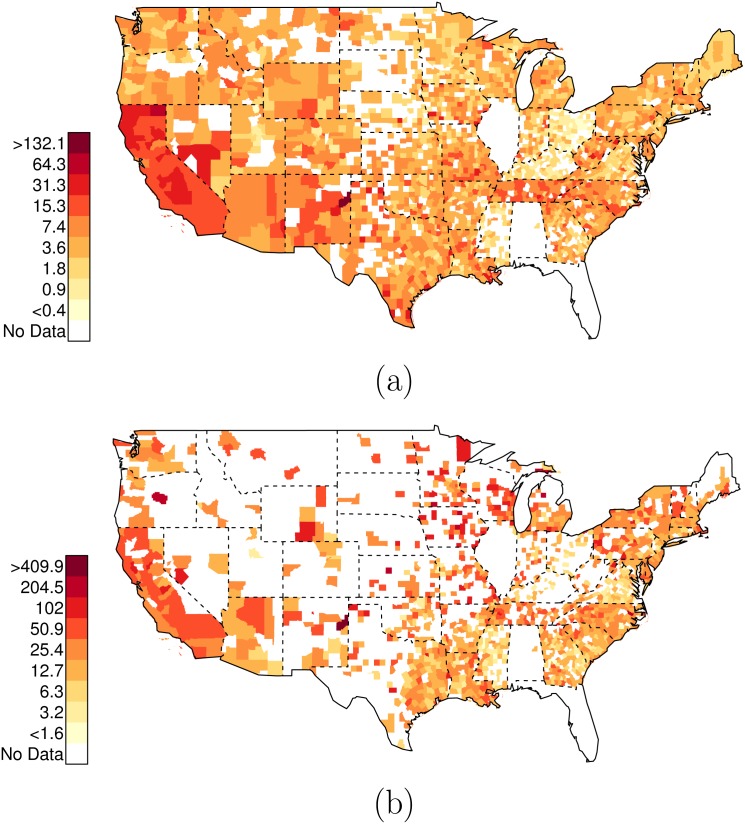
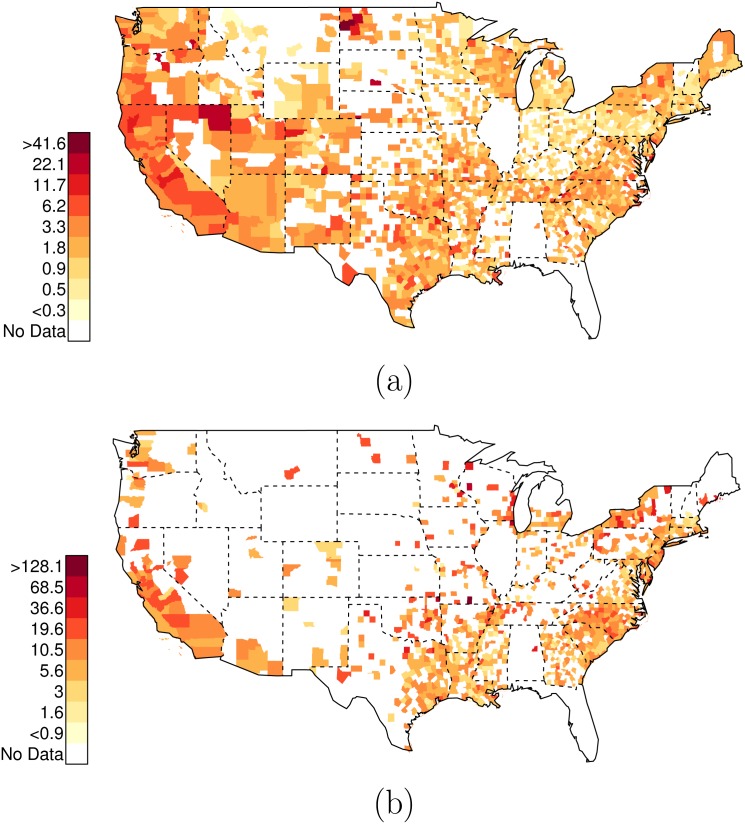
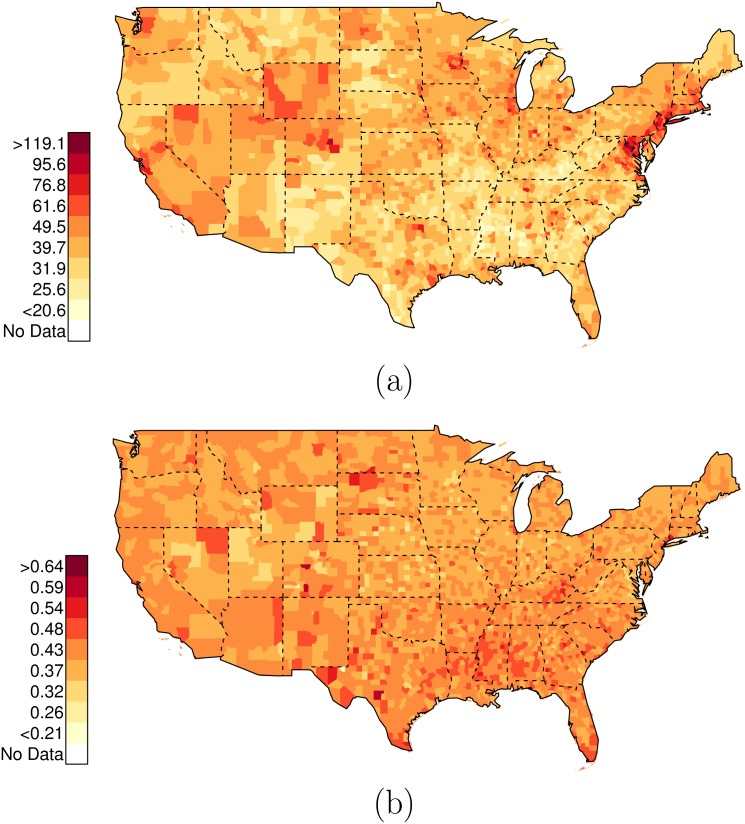
A geographically-resolved, multi-level Bayesian model is used to analyze the data presented in the U.S. Police-Shooting Database (USPSD) in order to investigate the extent of racial bias in the shooting of American civilians by police officers in recent years. In contrast to previous work that relied on the FBI's Supplemental Homicide Reports that were constructed from self-reported cases of police-involved homicide, this data set is less likely to be biased by police reporting practices. County-specific relative risk outcomes of being shot by police are estimated as a function of the interaction of: 1) whether suspects/civilians were armed or unarmed, and 2) the race/ethnicity of the suspects/civilians. The results provide evidence of a significant bias in the killing of unarmed black Americans relative to unarmed white Americans, in that the probability of being {black, unarmed, and shot by police} is about 3.49 times the probability of being {white, unarmed, and shot by police} on average. Furthermore, the results of multi-level modeling show that there exists significant heterogeneity across counties in the extent of racial bias in police shootings, with some counties showing relative risk ratios of 20 to 1 or more. Finally, analysis of police shooting data as a function of county-level predictors suggests that racial bias in police shootings is most likely to emerge in police departments in larger metropolitan counties with low median incomes and a sizable portion of black residents, especially when there is high financial inequality in that county. There is no relationship between county-level racial bias in police shootings and crime rates (even race-specific crime rates), meaning that the racial bias observed in police shootings in this data set is not explainable as a response to local-level crime rates.


Conflict of interest statement

Competing Interests: The author has declared that no competing interests exist.

Figures

Fig 1
Fig 1. Posterior Random Effects Estimates: Risk Ratio Black, Armed-to-Unarmed.
(a) County-by-county posterior estimates of the risk ratio of being {black, armed, and shot by police} to being {black, unarmed, and shot by police}. Grey bars are county-specific 95% PCI estimates. The blue bar is the nation-wide pooled 95% PCI estimate. The points on the error bars are posterior medians. Data are plotted on the log scale, but are labeled on the natural scale. (b) Map of county-specific posterior median estimates of the risk ratio of being {black, armed, and shot by police} to being {black, unarmed, and shot by police}.
Fig 2
Fig 2. Posterior Random Effects Estimates: Risk Ratio Hispanic, Armed-to-Unarmed.
(a) County-by-county posterior estimates of the risk ratio of being {hispanic, armed, and shot by police} to being {hispanic, unarmed, and shot by police}. Grey bars are county-specific 95% PCI estimates. The blue bar is the nation-wide pooled 95% PCI estimate. The points on the error bars are posterior medians. Data are plotted on the log scale, but are labeled on the natural scale. (b) Map of county-specific posterior median estimates of the risk ratio of being {hispanic, armed, and shot by police} to being {hispanic, unarmed, and shot by police}.
Fig 3
Fig 3. Posterior Random Effects Estimates: Risk Ratio White, Armed-to-Unarmed.
(a) County-by-county posterior estimates of the risk ratio of being {white, armed, and shot by police} to being {white, unarmed, and shot by police}. Grey bars are county-specific 95% PCI estimates. The blue bar is the nation-wide pooled 95% PCI estimate. The points on the error bars are posterior medians. Data are plotted on the log scale, but are labeled on the natural scale. (b) Map of county-specific posterior median estimates of the risk ratio of being {white, armed, and shot by police} to being {white, unarmed, and shot by police}.
Fig 4
Fig 4. Posterior Random Effects Estimates: Risk Ratio Black-and-Armed to White-and-Armed.
(a) County-by-county posterior estimates of the risk ratio of being {black, armed, and shot by police} to being {white, armed, and shot by police}. Grey bars are county-specific 95% PCI estimates. The blue bar is the nation-wide pooled 95% PCI estimate. The points on the error bars are posterior medians. Data are plotted on the log scale, but are labeled on the natural scale. (b) Map of county-specific posterior median estimates of the risk ratio of being {black, armed, and shot by police} to being {white, armed, and shot by police}.
Fig 5
Fig 5. Posterior Random Effects Estimates: Risk Ratio Hispanic-and-Armed to White-and-Armed.
(a) County-by-county posterior estimates of the risk ratio of being {hispanic, armed, and shot by police} to being {white, armed, and shot by police}. Grey bars are county-specific estimates. Grey bars are county-specific 95% PCI estimates. The blue bar is the nation-wide pooled 95% PCI estimate. Data are plotted on the log scale, but are labeled on the natural scale. (b) Map of county-specific posterior median estimates of the risk ratio of being {hispanic, armed, and shot by police} to being {white, armed, and shot by police}.
Fig 6
Fig 6. Posterior Random Effects Estimates: Risk Ratio Black-and-Unarmed to White-and-Unarmed.
(a) County-by-county posterior estimates of the risk ratio of being {black, unarmed, and shot by police} to being {white, unarmed, and shot by police}. Grey bars are county-specific 95% PCI estimates. The blue bar is the nation-wide pooled 95% PCI estimate. The points on the error bars are posterior medians. Data are plotted on the log scale, but are labeled on the natural scale. (b) Map of county-specific posterior median estimates of the risk ratio of being {black, unarmed, and shot by police} to being {white, unarmed, and shot by police}.
Fig 7
Fig 7. Posterior Random Effects Estimates: Risk Ratio Hispanic-and-Unarmed to White-and-Unarmed.
(a) County-by-county posterior estimates of the risk ratio of being {hispanic, unarmed, and shot by police} to being {white, unarmed, and shot by police}. Grey bars are county-specific 95% PCI estimates. The blue bar is the nation-wide pooled 95% PCI estimate. The points on the error bars are posterior medians. Data are plotted on the log scale, but are labeled on the natural scale. (b) Map of county-specific posterior median estimates of the risk ratio of being {hispanic, unarmed, and shot by police} to being {white, unarmed, and shot by police}.
Fig 8
Fig 8. Posterior Random Effects Estimates: Risk Ratio Black-and-Unarmed to White-and-Armed.
(a) County-by-county posterior estimates of the risk ratio of being {black, unarmed, and shot by police} to being {white, armed, and shot by police}. Grey bars are county-specific 95% PCI estimates. The blue bar is the nation-wide pooled 95% PCI estimate. The points on the error bars are posterior medians. Data are plotted on the log scale, but are labeled on the natural scale. (b) Map of county-specific posterior median estimates of the risk ratio of being {black, unarmed, and shot by police} to being {white, armed, and shot by police}.
Fig 9
Fig 9. Posterior Random Effects Estimates: Risk Ratio Hispanic-and-Unarmed to White-and-Armed.
(a) County-by-county posterior estimates of the risk ratio of being {hispanic, unarmed, and shot by police} to being {white, armed, and shot by police}. Grey bars are county-specific 95% PCI estimates. The blue bar is the nation-wide pooled 95% PCI estimate. The points on the error bars are posterior medians. Data are plotted on the log scale, but are labeled on the natural scale. (b) Map of county-specific posterior median estimates of the risk ratio of being {hispanic, armed, and shot by police} to being {white, unarmed, and shot by police}.
Fig 10
Fig 10. Data on Race-Specific Assault-Related Arrest Rates.
In these figures, only counties with greater than one arrest are plotted. (a) County-specific Department of Justice data on assault-related arrests (White), per 10,000 residents (2012). (b) County-specific Department of Justice data on assault-related arrests (Black), per 10,000 residents (2012).
Fig 11
Fig 11. Data on Race-Specific Weapons-Related Arrest Rates.
In these figures, only counties with greater than one arrest are plotted. (a) County-specific Department of Justice data on weapons-related arrests (White), per 10,000 residents (2012). (b) County-specific Department of Justice data on weapons-related arrests (Black), per 10,000 residents (2012).
Fig 12
Fig 12. AIDSVu Data on Income and Inequality.
(a) County-specific data on median income, in $1,000s. (b) County-specific data on inequality (Gini).
Fig 13
Fig 13. Population Data.
(a) County-specific data on total population size, in 10,000s of residents. (b) County-specific data on the black-to-white population ratio.
Fig 14
Fig 14. Data on Proxy Measure of Local Norms Concerning Racism.
(a) Designated Market Area-specific Google Search Racism Scores, 2004–2007.

References

    1. Kyle Wagner. U.S. Police Shootings Database, http://goo.gl/Su60Cm; 2014.
    1. Klinger DA. On the Problems and Promise of Research on Lethal Police Violence: A Research Note. Homicide Studies. 2012;16(1):78 10.1177/1088767911430861 - DOI
    1. U S Department of Justice, Federal Bureau of Investigation. Supplementary Homicide Report (OMB Form No. 1110–0002); 2014.
    1. Centers for Disease Control and Prevention. National Vital Statistics System; 2014. - PubMed
    1. Gabrielson R, Grochowski Jones R, Sagara E. Deadly Force, in Black and White: A Pro Publica analysis of killings by police shows outsize risk for young black males. Pro Publica; 2014;.