

Genomic DNA Copy Number Aberrations, Histological Diagnosis, Oral Subsite and Aneuploidy in OPMDs/OSCCs
- PMID: 26540282
- PMCID: PMC4634987
- DOI: 10.1371/journal.pone.0142294
Genomic DNA Copy Number Aberrations, Histological Diagnosis, Oral Subsite and Aneuploidy in OPMDs/OSCCs
Abstract
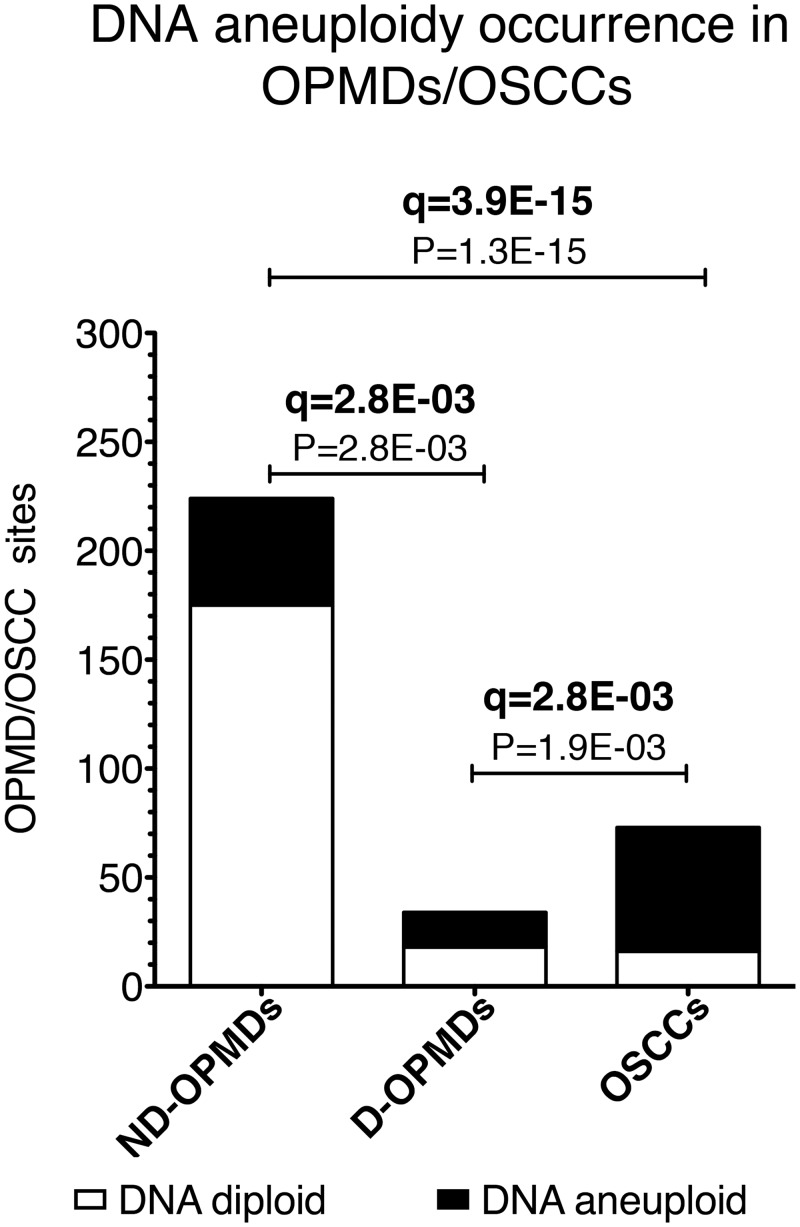
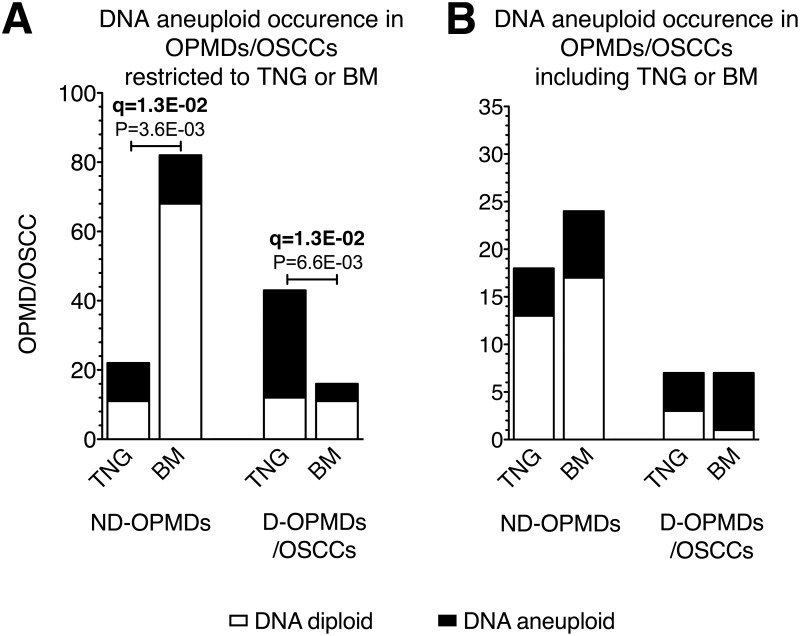
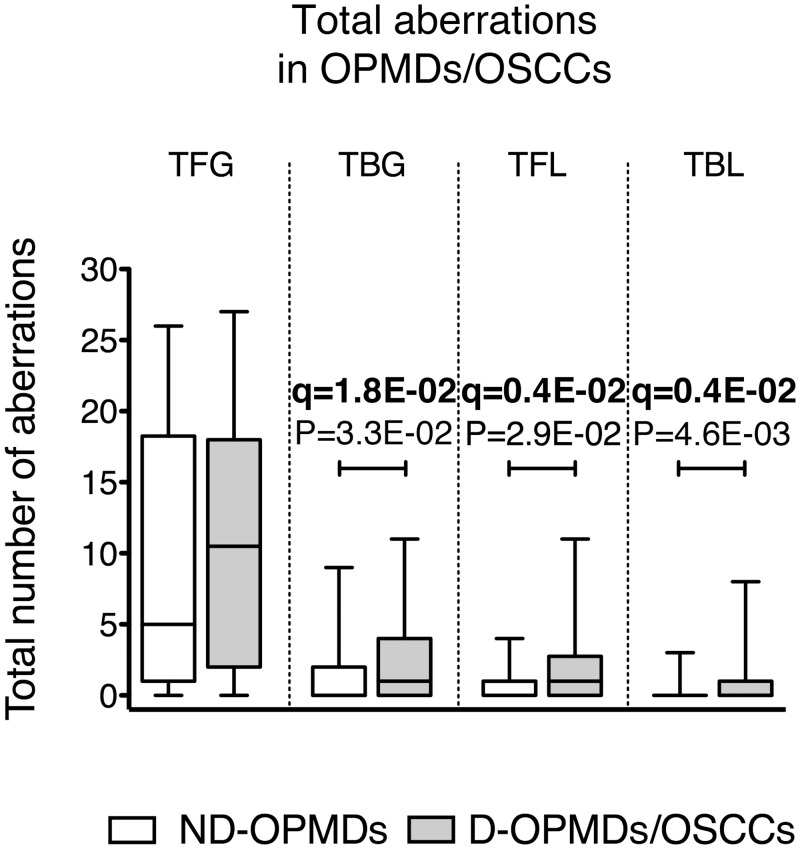
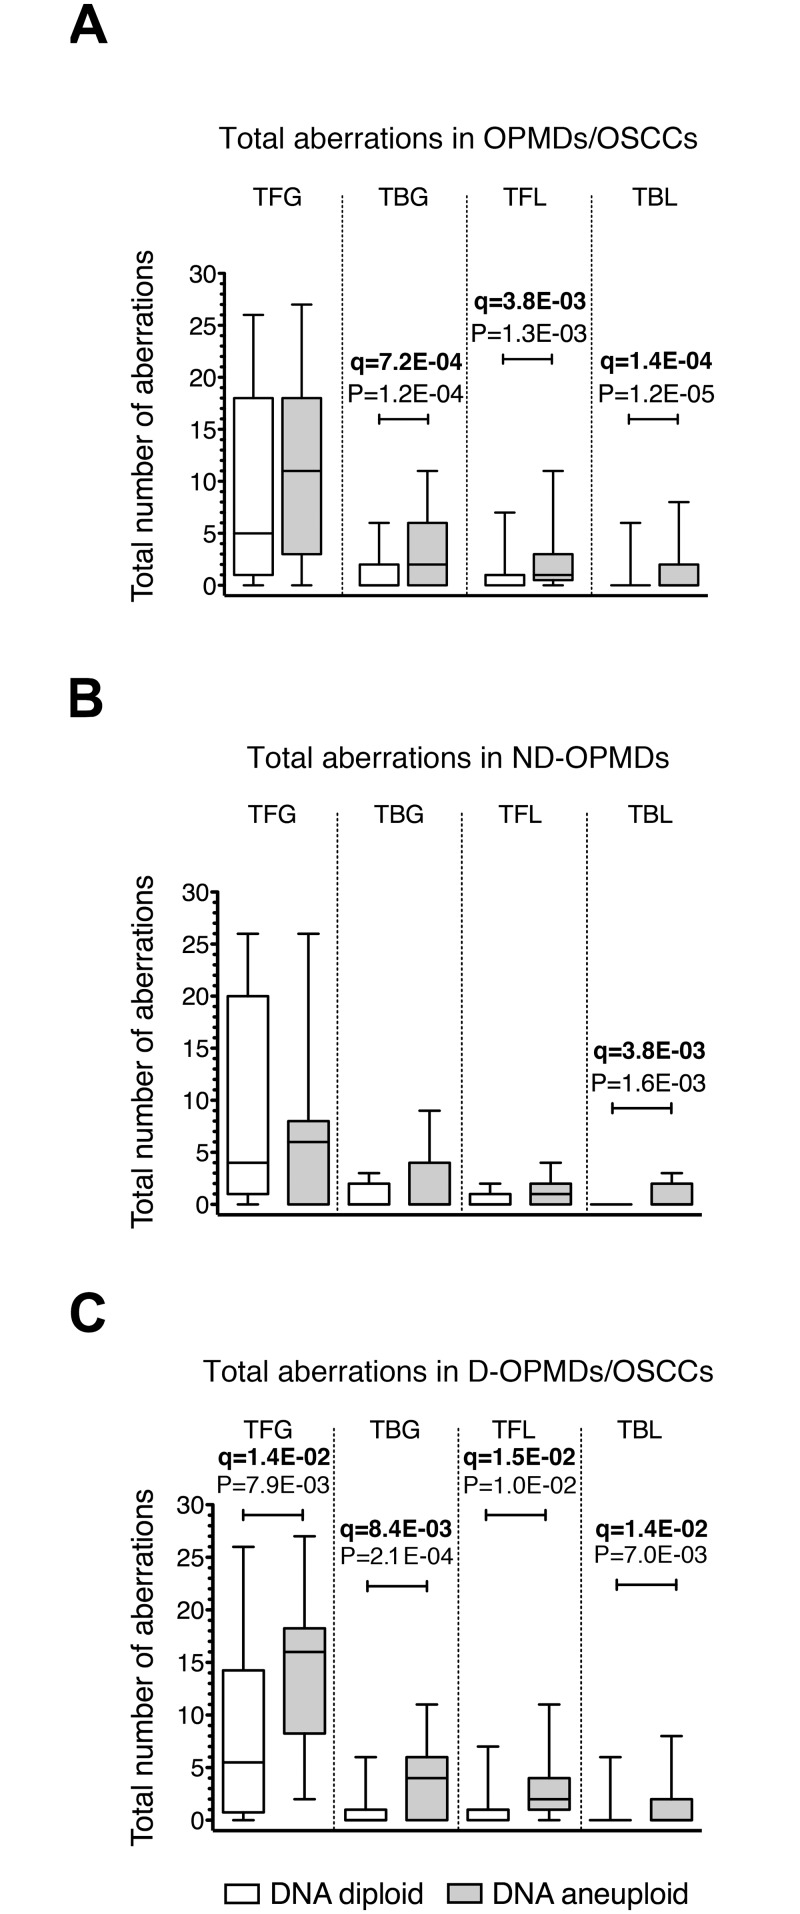
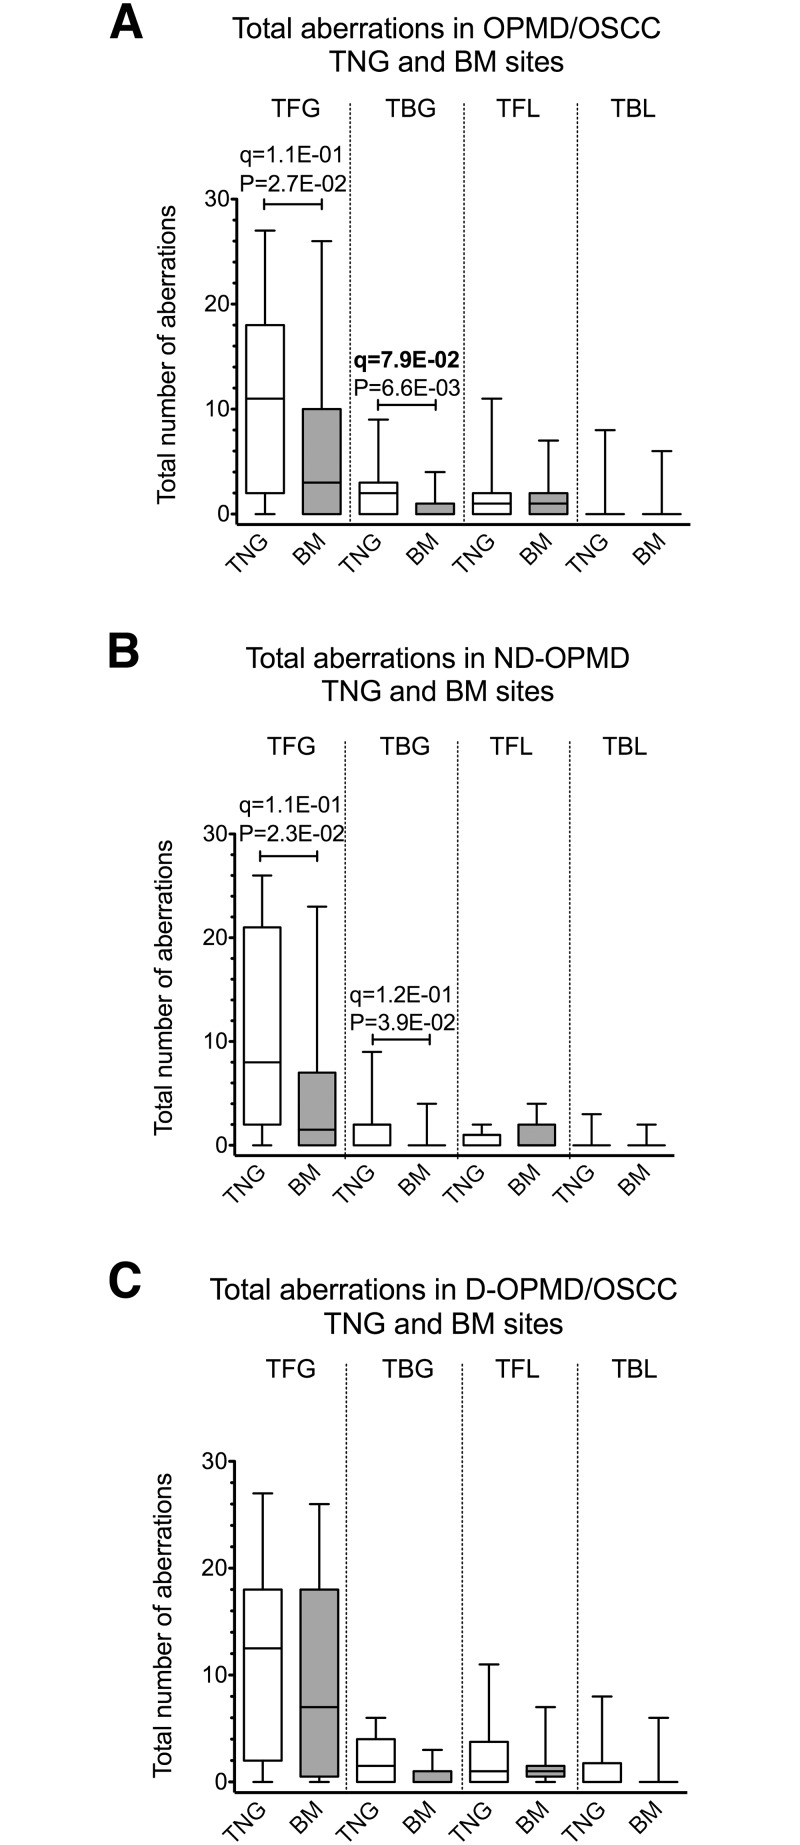
Oral potentially malignant disorders (OPMDs) characterized by the presence of dysplasia and DNA copy number aberrations (CNAs), may reflect chromosomal instability (CIN) and predispose to oral squamous cell carcinoma (OSCC). Early detection of OPMDs with such characteristics may play a crucial role in OSCC prevention. The aim of this study was to explore the relationship between CNAs, histological diagnosis, oral subsite and aneuploidy in OPMDs/OSCCs. Samples from OPMDs and OSCCs were processed by high-resolution DNA flow cytometry (hr DNA-FCM) to determine the relative nuclear DNA content. Additionally, CNAs were obtained for a subset of these samples by genome-wide array comparative genomic hybridization (aCGH) using DNA extracted from either diploid or aneuploid nuclei suspension sorted by FCM. Our study shows that: i) aneuploidy, global genomic imbalance (measured as the total number of CNAs) and specific focal CNAs occur early in the development of oral cancer and become more frequent at later stages; ii) OPMDs limited to tongue (TNG) mucosa display a higher frequency of aneuploidy compared to OPMDs confined to buccal mucosa (BM) as measured by DNA-FCM; iii) TNG OPMDs/OSCCs show peculiar features of CIN compared to BM OPMDs/OSCCs given the preferential association with total broad and specific focal CNA gains. Follow-up studies are warranted to establish whether the presence of DNA aneuploidy and specific focal or broad CNAs may predict cancer development in non-dysplastic OPMDs.
Conflict of interest statement
Figures
Similar articles
-
DNA aneuploidy relationship with patient age and tobacco smoke in OPMDs/OSCCs.PLoS One. 2017 Sep 6;12(9):e0184425. doi: 10.1371/journal.pone.0184425. eCollection 2017. PLoS One. 2017. PMID: 28877236 Free PMC article.
-
Genomic aberrations in normal appearing mucosa fields distal from oral potentially malignant lesions.Cell Oncol (Dordr). 2012 Feb;35(1):43-52. doi: 10.1007/s13402-011-0064-2. Epub 2011 Dec 6. Cell Oncol (Dordr). 2012. PMID: 22144094 Free PMC article.
-
Chromosomal instability, DNA index, dysplasia, and subsite in oral premalignancy as intermediate endpoints of risk of cancer.Cancer Epidemiol Biomarkers Prev. 2013 Jun;22(6):1133-41. doi: 10.1158/1055-9965.EPI-13-0147. Epub 2013 Apr 29. Cancer Epidemiol Biomarkers Prev. 2013. PMID: 23629518
-
Chromosomal instability, aneuploidy and routine high-resolution DNA content analysis in oral cancer risk evaluation.Future Oncol. 2012 Oct;8(10):1257-71. doi: 10.2217/fon.12.116. Future Oncol. 2012. PMID: 23130927 Review.
-
Genomic DNA copy number alterations from precursor oral lesions to oral squamous cell carcinoma.Oral Oncol. 2014 May;50(5):404-12. doi: 10.1016/j.oraloncology.2014.02.005. Epub 2014 Mar 7. Oral Oncol. 2014. PMID: 24613650 Review.
Cited by
-
Detecting Chromosome Instability in Cancer: Approaches to Resolve Cell-to-Cell Heterogeneity.Cancers (Basel). 2019 Feb 15;11(2):226. doi: 10.3390/cancers11020226. Cancers (Basel). 2019. PMID: 30781398 Free PMC article. Review.
-
DNA aneuploidy with image cytometry for detecting dysplasia and carcinoma in oral potentially malignant disorders: A prospective diagnostic study.Cancer Med. 2020 Sep;9(17):6411-6420. doi: 10.1002/cam4.3293. Epub 2020 Jul 7. Cancer Med. 2020. PMID: 32638539 Free PMC article.
-
Development and validation of a risk model for noninvasive detection of cancer in oral potentially malignant disorders using DNA image cytometry.Cancer Biol Med. 2021 May 20;18(3):763-71. doi: 10.20892/j.issn.2095-3941.2020.0531. Cancer Biol Med. 2021. PMID: 34018388 Free PMC article.
-
Copy Number Aberrations of Multiple Genes Identified as Prognostic Markers for Extrahepatic Metastasis-free Survival of Patients with Hepatocellular Carcinoma.Curr Med Sci. 2019 Oct;39(5):759-765. doi: 10.1007/s11596-019-2103-6. Epub 2019 Oct 14. Curr Med Sci. 2019. PMID: 31612394
-
DNA aneuploidy relationship with patient age and tobacco smoke in OPMDs/OSCCs.PLoS One. 2017 Sep 6;12(9):e0184425. doi: 10.1371/journal.pone.0184425. eCollection 2017. PLoS One. 2017. PMID: 28877236 Free PMC article.
References
-
- Bloebaum M, Poort L, Bockmann R, Kessler P. Survival after curative surgical treatment for primary oral squamous cell carcinoma. Journal of cranio-maxillo-facial surgery: official publication of the European Association for Cranio-Maxillo-Facial Surgery. 2014;42(8):1572–6. 10.1016/j.jcms.2014.01.046 . - DOI - PubMed
Publication types
MeSH terms
Substances
LinkOut - more resources
Full Text Sources
Other Literature Sources
Medical
Molecular Biology Databases
