

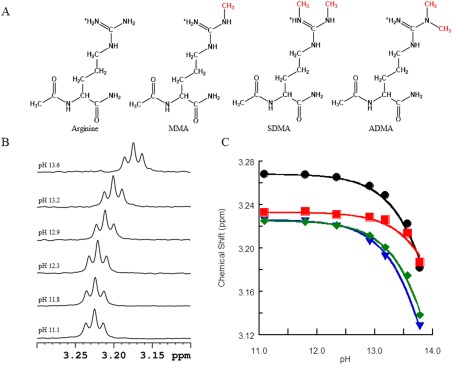
Effect of methylation on the side-chain pKa value of arginine
- PMID: 26540340
- PMCID: PMC4815340
- DOI: 10.1002/pro.2838
Effect of methylation on the side-chain pKa value of arginine
Abstract
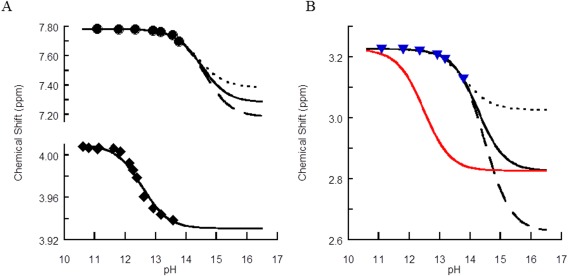
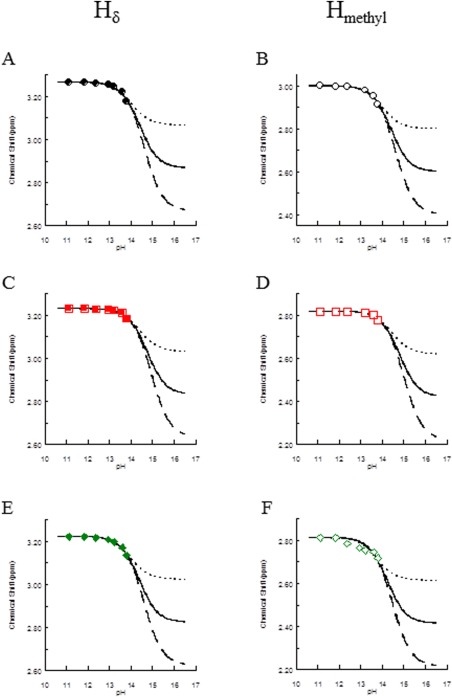
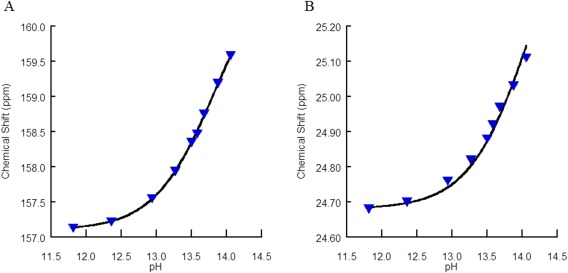
Arginine methylation is important in biological systems. Recent studies link the deregulation of protein arginine methyltransferases with certain cancers. To assess the impact of methylation on interaction with other biomolecules, the pKa values of methylated arginine variants were determined using NMR data. The pKa values of monomethylated, symmetrically dimethylated, and asymmetrically dimethylated arginine are similar to the unmodified arginine (14.2 ± 0.4). Although the pKa value has not been significantly affected by methylation, consequences of methylation include changes in charge distribution and steric effects, suggesting alternative mechanisms for recognition.
Keywords: NMR spectroscopy; arginine; methylation; methyltransferase; pH titration; pKa determination.
© 2015 The Protein Society.
Figures
References
-
- Bartlett GJ, Porter CT, Borkakoti N, Thornton JM (2002) Analysis of catalytic residues in enzyme active sites. J Mol Biol 324:105–121. - PubMed
-
- Kim J, Mao J, Gunner MR (2005) Are acidic and basic groups in buried proteins predicted to be ionized? J Mol Biol 348:1283–1298. - PubMed
-
- Bogan AA, Thorn KS (1998) Anatomy of hot spots in protein interfaces. J Mol Biol 280:1–9. - PubMed
Publication types
MeSH terms
Substances
Grants and funding
LinkOut - more resources
Full Text Sources
Other Literature Sources
