. 2015 Nov 5;10(11):e0141482.
doi: 10.1371/journal.pone.0141482. eCollection 2015.

Spatio-Temporal Gene Expression Profiling during In Vivo Early Ovarian Folliculogenesis: Integrated Transcriptomic Study and Molecular Signature of Early Follicular Growth

Affiliations

Spatio-Temporal Gene Expression Profiling during In Vivo Early Ovarian Folliculogenesis: Integrated Transcriptomic Study and Molecular Signature of Early Follicular Growth

Agnes Bonnet et al. PLoS One. .

Abstract

Background: The successful achievement of early ovarian folliculogenesis is important for fertility and reproductive life span. This complex biological process requires the appropriate expression of numerous genes at each developmental stage, in each follicular compartment. Relatively little is known at present about the molecular mechanisms that drive this process, and most gene expression studies have been performed in rodents and without considering the different follicular compartments.

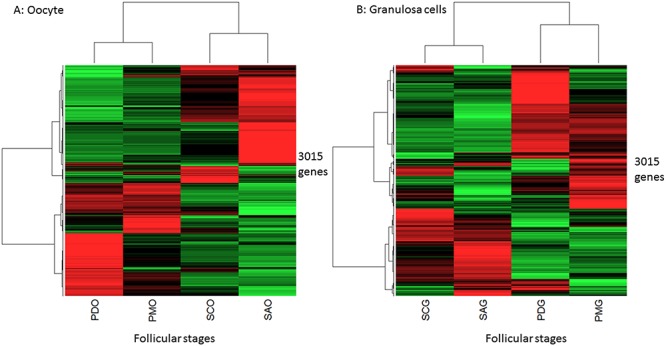
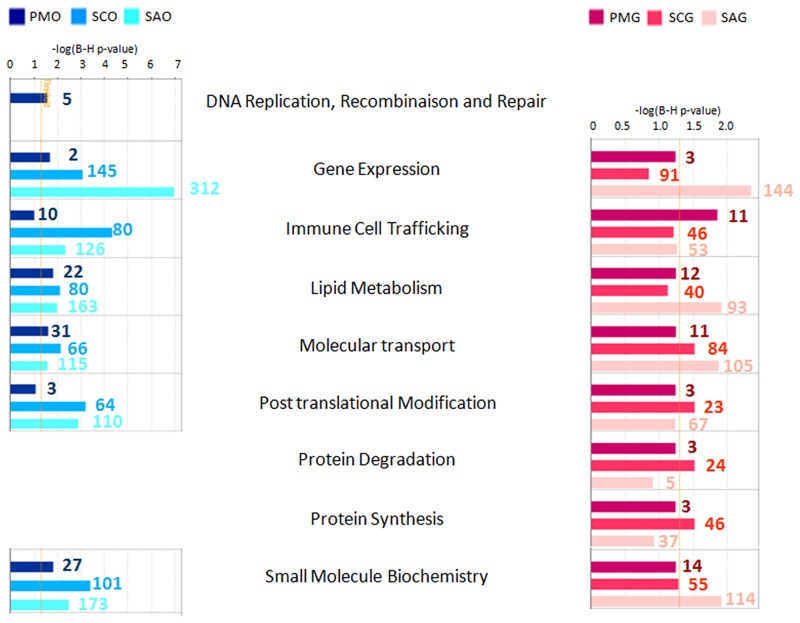
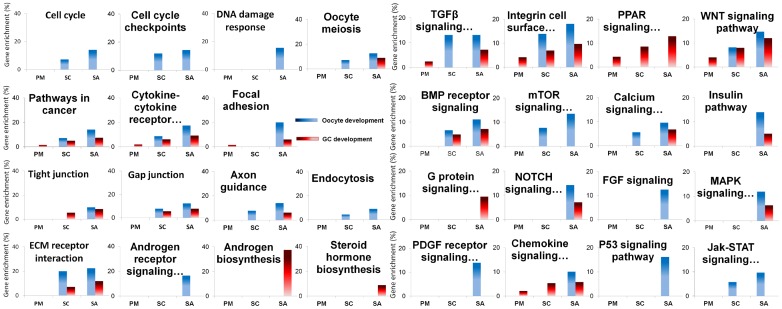
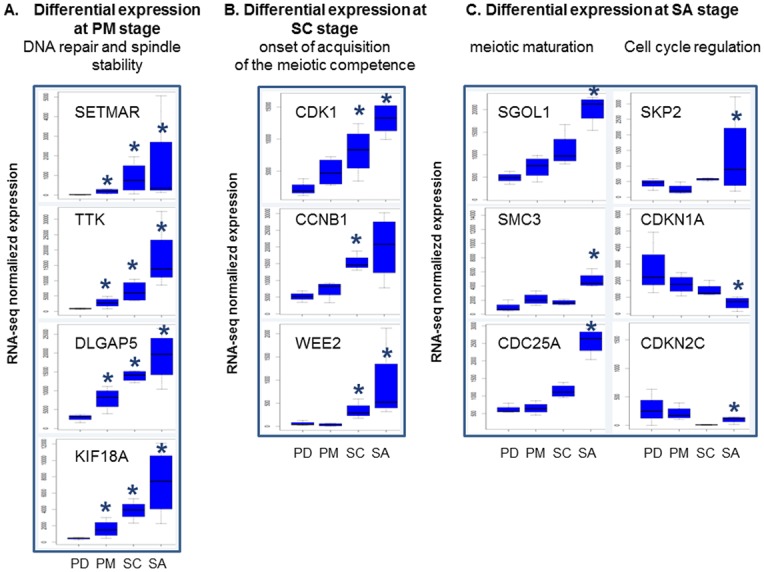
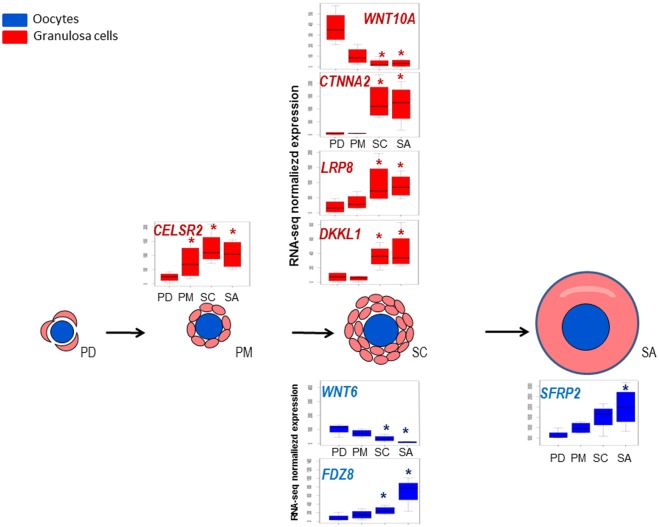
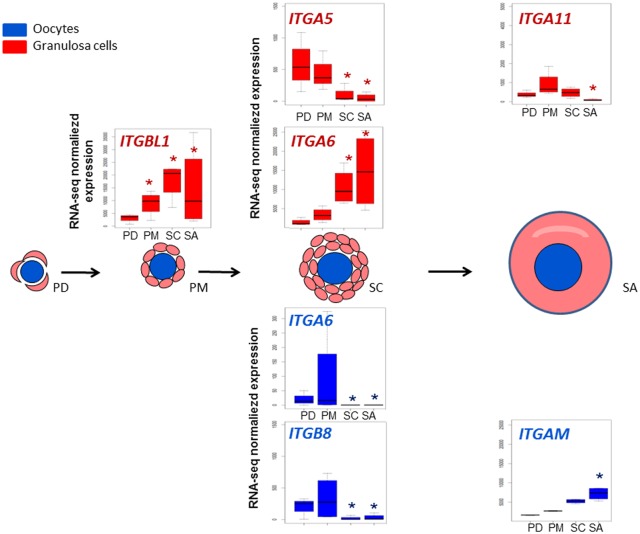
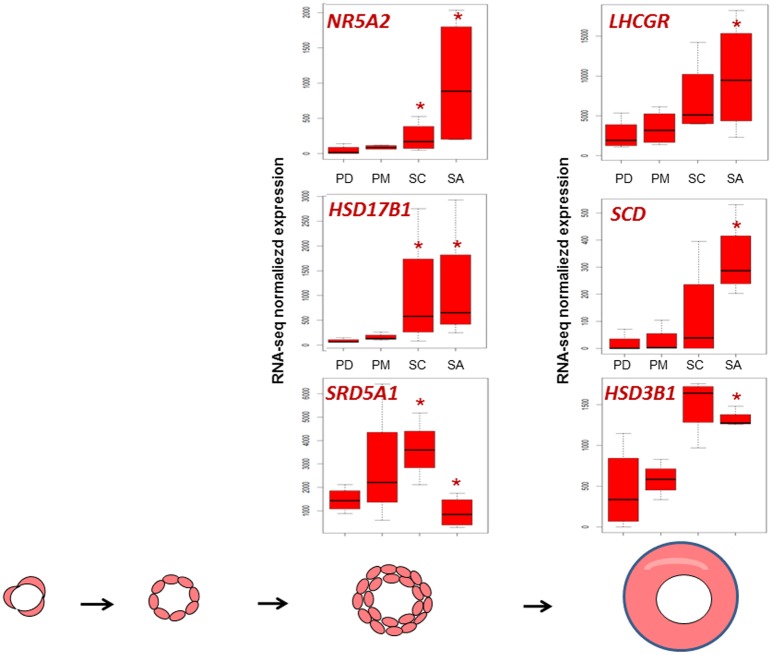
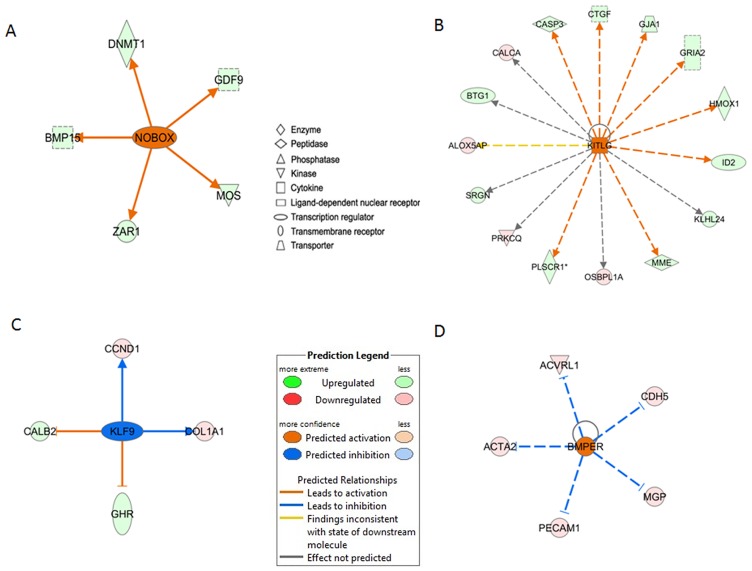
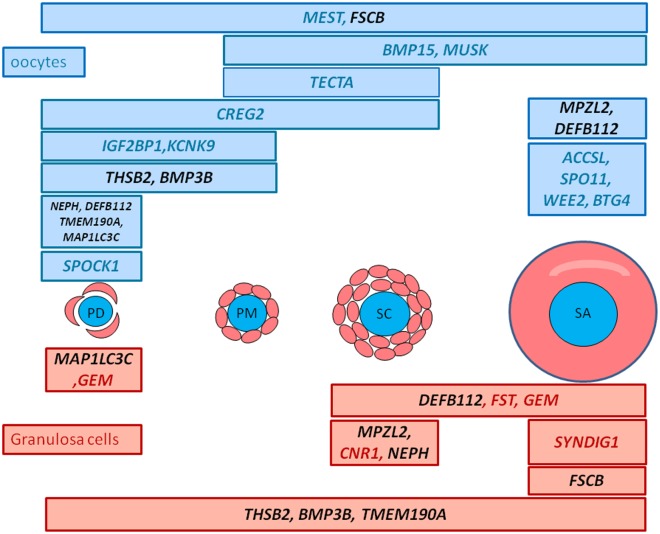
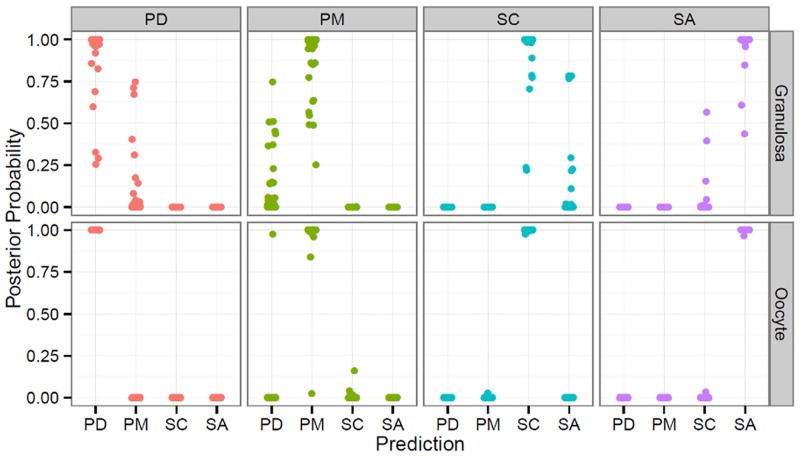
Results: We used RNA-seq technology to explore the sheep transcriptome during early ovarian follicular development in the two main compartments: oocytes and granulosa cells. We documented the differential expression of 3,015 genes during this phase and described the gene expression dynamic specific to these compartments. We showed that important steps occurred during primary/secondary transition in sheep. We also described the in vivo molecular course of a number of pathways. In oocytes, these pathways documented the chronology of the acquisition of meiotic competence, migration and cellular organization, while in granulosa cells they concerned adhesion, the formation of cytoplasmic projections and steroid synthesis. This study proposes the involvement in this process of several members of the integrin and BMP families. The expression of genes such as Kruppel-like factor 9 (KLF9) and BMP binding endothelial regulator (BMPER) was highlighted for the first time during early follicular development, and their proteins were also predicted to be involved in gene regulation. Finally, we selected a data set of 24 biomarkers that enabled the discrimination of early follicular stages and thus offer a molecular signature of early follicular growth. This set of biomarkers includes known genes such as SPO11 meiotic protein covalently bound to DSB (SPO11), bone morphogenetic protein 15 (BMP15) and WEE1 homolog 2 (S. pombe)(WEE2) which play critical roles in follicular development but other biomarkers are also likely to play significant roles in this process.

Conclusions: To our knowledge, this is the first in vivo spatio-temporal exploration of transcriptomes derived from early follicles in sheep.


Conflict of interest statement

Competing Interests: The authors have declared that no competing interests exist.

Figures

Fig 1
Fig 1. Heatmap display of unsupervised hierarchical clustering of all differential genes during early folliculogenesis.
This Figure shows two unsupervised hierarchical clusterings from oocyte (A) and granulosa cells (B) differential gene expressions. The first level of the dendrogram classified the primordial/primary follicles and the secondary/small antrum follicles as two distinct clusters. The other levels revealed a lower dissimilarity between primordial/primary than small antrum/secondary stages. The genes are shown in lines and the relative expression means by follicle stages are shown in columns. Red, black and green represent the levels of expression: up, mean, and down, respectively. PDO: oocyte from primordial follicles, PMO: oocyte from primary follicles, SCO: oocyte from secondary follicles, SAO: oocyte from small antrum follicles, PDG: granulosa cells from primordial follicles, PMG: granulosa cells from primary follicles, SCG: granulosa cells from secondary follicles, SAG: granulosa cells from small antrum follicles.
Fig 2
Fig 2. Cellular function enrichment.
Functional enrichment analysis for sets of differentially expressed genes during early follicular development was performed in silico for each compartment using Ingenuity Pathway Analysis (IPA) software. Statistical significance was determined by a P value calculated using Fisher’s exact test corrected for multiple testing correction (Benjamini-Hochberg test, FDR <0.05). This analysis identified nine main cellular function categories as being significantly enriched in differentially expressed genes. Bar colors correspond to enriched functions at primary stage (compared to primordial stage), secondary stage (compared to primary and primordial stages), and small antrum stage (compared to secondary, primary and primordial stages). The X axis corresponds to the level of significance of the function: -log(B-H p value). Granulosa cell functions are colored in red and oocyte functions are colored in blue. Numbers correspond to the number of focus genes contributing to the functions. Follicular stage abbreviations are described in Fig 1.
Fig 3
Fig 3. Significantly enriched pathways highlighted in early folliculogenesis.
Pathway enrichment analysis for sets of differentially expressed genes during early follicular development was performed using Webgestalt software. Statistical significance was determined by multiple testing correction of p-values using Benjamini-Hochberg test (FDR <0.05). Thirty one enriched pathways are presented. Each graph corresponds to the percentage of gene enrichment in the pathway (%) according to different stages of follicles (PM (primary), SC (secondary) and SA (small antrum)). Granulosa canonical pathways are colored in red and oocyte canonical pathways are colored in blue.
Fig 4
Fig 4. Meiotic maturation gene expression as a function of oocyte developmental stage.
(A) Differential gene expression at primary stage, (B) differential gene expression at secondary stage, (C) differential gene expression at small antrum stage. The Y axis corresponds to normalized counts from RNA-seq data. *: FDR <0.05, pairwise comparison pval <0.01.
Fig 5
Fig 5. Gene expression profiles of members of WNT signaling pathway during early folliculogenesis.
Significant differences in relative gene expression during early folliculogenesis of members of Wnt signaling pathway (S2 Table). The Y axis corresponds to normalized counts from RNA-seq data. Granulosa cells data are colored in red and oocyte data are colored in blue. *: FDR <0.05, pairwise comparison pval <0.01.
Fig 6
Fig 6. Dynamic representation of integrin family gene expression.
Significant differences in relative gene expression during early folliculogenesis of members of integrin family (S2 Table). Granulosa cells data are colored in red and oocyte data are colored in blue. The Y axis corresponds to normalized counts from RNA-seq data. *: FDR <0.05, pairwise comparison pval <0.01.
Fig 7
Fig 7. Dynamic representation of gene expression involved in steroid biosynthesis process.
Significant differences in relative gene expression during early folliculogenesis of genes involved in steroid synthesis (S2 Table). *: FDR <0.05, pairwise comparison pval <0.01.
Fig 8
Fig 8. Upstream regulators involved during early folliculogenesis.
This Figure focuses on four upstream regulators of interest predicted to be activated or inhibited at key transitions during follicular development. Genes in our dataset are highlighted based on up- (green) or down- (red) expression and increasing intensity in line with the degree of fold change. The predicted action of the central gene is indicated as activated (orange) or inhibited (blue) with the degree of confidence increasing in line with color intensity. Arrowheads at the ends of the interactions indicate activation, whereas bars indicate inhibitory effects. Unbroken arrows and dashed arrows represent direct and indirect interactions between genes and upstream regulators, respectively. Predicted activation of (A) NOBOX in oocytes at small antrum stage, (B) KITL in granulosa cells at small antrum stage, (C) KLF9 in oocytes at small antrum stage, (D) BMPER in oocytes at secondary stage.
Fig 9
Fig 9. Distribution of the expression of the 24 biomarkers during early follicular development.
These biomarkers correspond to the most strongly expressed genes in a specific cell type and stage (PDO, PMO, SCO, SAO, PDG, PMG, SCG, SAG). They were selected using pairwise comparisons (nbinom Test) comparing each stage to the others including multi-tissue samples (FDR<5% and a fold change >3 for granulosa samples and a fold change >-10 for oocyte samples). Their differential expression was confirmed by qRT-PCR. Gene names marked in red are genes expressed in granulosa cells and gene names marked in blue are genes expressed in oocytes. Gene names marked in black are genes expressed both in oocytes and granulosa cells.
Fig 10
Fig 10. Predictive power of the combination of logistic regression and the linear regression model.
Predictive power of biomarkers using linear mixed model equations incorporating both the presence/absence of expression and its quantitative level. The scatter-plot shows the posterior probability that an expression vector arises from each of the possible stages, when the simulated vector is made up of observations from the PD, PM, SC or SA stages (from left to right), for granulosa cells (top) and oocytes (bottom).

References

    1. Choi Y, Rajkovic A. Genetics of early mammalian folliculogenesis. Cell Mol Life Sci. 2006;63(5):579–90. . - PMC - PubMed
    1. Fair T, Hyttel P, Greve T. Bovine oocyte diameter in relation to maturational competence and transcriptional activity. Mol Reprod Dev. 1995;42(4):437–42. 10.1002/mrd.1080420410 . - DOI - PubMed
    1. Gilchrist RB, Ritter LJ, Armstrong DT. Oocyte-somatic cell interactions during follicle development in mammals. Anim Reprod Sci. 2004;82–83: 431–46. . - PubMed
    1. Matzuk MM, Burns KH, Viveiros MM, Eppig JJ. Intercellular communication in the mammalian ovary: oocytes carry the conversation. Science. 2002;296(5576):2178–80. 10.1126/science.1071965 . - DOI - PubMed
    1. Kezele PR, Ague JM, Nilsson E, Skinner MK. Alterations in the ovarian transcriptome during primordial follicle assembly and development. Biol Reprod. 2005;72(1):241–55. . - PubMed

Publication types

LinkOut - more resources