. 2016 Feb;25(2):530-9.
doi: 10.1002/pro.2840. Epub 2015 Dec 8.

High-throughput identification of protein mutant stability computed from a double mutant fitness landscape

Affiliations

High-throughput identification of protein mutant stability computed from a double mutant fitness landscape

Nicholas C Wu et al. Protein Sci. 2016 Feb.

Abstract

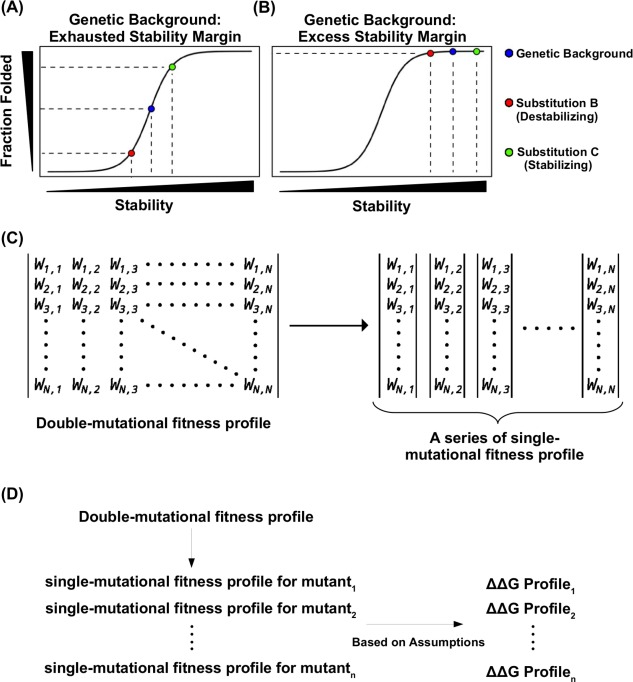
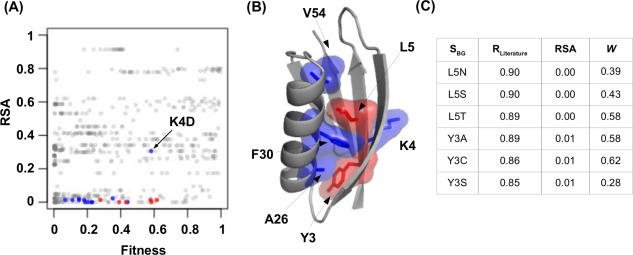
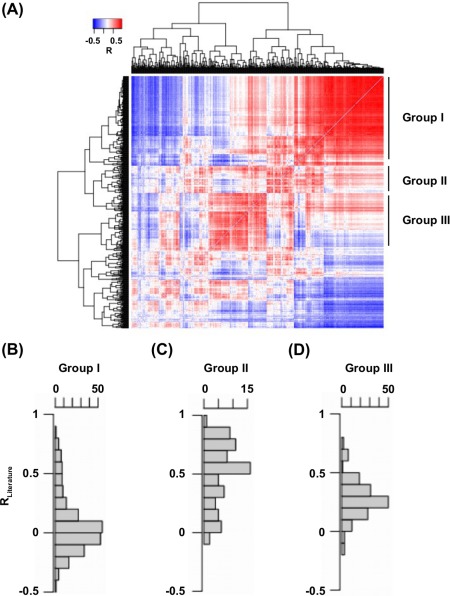
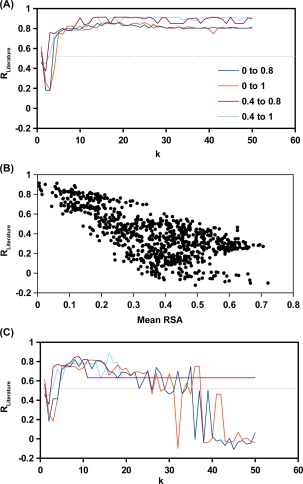
The effect of a mutation on protein stability is traditionally measured by genetic construction, expression, purification, and physical analysis using low-throughput methods. This process is tedious and limits the number of mutants able to be examined in a single study. In contrast, functional fitness effects can be measured in a high-throughput manner by various deep mutational scanning tools. Using protein GB 1, we have recently demonstrated the feasibility of estimating the mutational stability effect ( ΔΔG) of single-substitution based on the functional fitness profile of all double-substitutions. The principle is to identify genetic backgrounds that have an exhausted stability margin. The functional effect of an additional substitution on these genetic backgrounds can then be used to compute the mutational ΔΔG based on the biophysical relationship between functional fitness and thermodynamic stability. However, to identify such genetic backgrounds, the approach described in our previous study required a benchmark dataset, which is a set of known mutational ΔΔG. In this study, a benchmark-independent approach is developed. The genetic backgrounds of interest are identified using k-means clustering with the integration of structural information. We further demonstrated that a reasonable approximation of ΔΔG can also be obtained without taking structural information into account. In summary, this study describes a novel method for computing ΔΔG from double-substitution functional fitness profiles alone, without relying on any known mutational ΔΔG as a benchmark.

Keywords: fitness profiling; mutagenesis; mutant stability prediction; protein stability.


Figures

Figure 1
Figure 1
Conceptual basis for studying protein stability from functional measurement. (A, B) A schematic representation of the nonlinear relationship between mutant stability and protein folding under genetic backgrounds with different stabilities is shown for (A) a destabilizing genetic background, in which the protein is partially unfolded, and (B) a stable genetic background, in which the protein is fully folded (native state). Blue represents the genetic background, red represents a destabilizing substitution on the genetic background, green represents a stabilizing substitution on the genetic background. (C) A double‐substitution functional profile can be partitioned into individual single‐substitution functional profile for different genetic backgrounds. The double‐substitution functional profile is shown as a symmetric matrix. The fitness value of each mutant was indicated by Wi,j, where i and j indicates the substitution. When i equals j, it represents a single substitution. (D) A diagram shows the logical flow of computing ΔΔ G from a double‐substitution functional profile. ΔΔ G for individual single substitution can be computed from the functional profile of a given genetic background. Nonetheless, several assumptions are involved in the computing of ΔΔ G from functional profile. As a result, only those genetic backgrounds that satisfy the assumptions would allow accurate calculation of ΔΔ G from the functional profile.
Figure 2
Figure 2
Property of S BG with a higher R Literature. (A, B) S BG with a R Literature of >0.85 are colored in red and S BG with a R Literature of >0.75 are colored in blue. (A) A two dimension scatter plot is shown with each S BG represented by a data point. The y‐axis represents the RSA and the x‐axis represents the fitness (W). The only nonburied S BG with high correlation is K4D which is labeled. (B) The spatial locations for those S BG with a R Literature of >0.75 are shown on the protein G structure (PDB: 1PGA).12 (C) The R Literature, RSA, and W are shown for those S BG with a R Literature of >0.85.
Figure 3
Figure 3
Hierarchical clustering of genetic backgrounds based on the similarity of ΔΔ G profile. (A) Hierarchical clustering of individual S BG based on their pairwise correlation of ΔΔ G profile. The pairwise correlation between ΔΔ G profiles is color coded as indicated. (B–D) Distribution of R Literature for individual S BG within (B) group I, (C) group II, and (D) group III was shown.
Figure 4
Figure 4
Results from k‐means clustering. k‐means clustering was performed to group S BG by the similarity of ΔΔ G profile. For a given k selection, 100 independently runs of k‐means clustering were performed. Consequently, 100 × k groups of S BG would be obtained. This analysis was performed for S BG with a fitness within the indicated range. There were 678 S BG within a fitness range of 0–1 (orange), 249 S BG within a fitness range of 0.4–1 (cyan), 153 S BG within a fitness range of 0.4–0.8 (brown), 582 S BG within a fitness range of 0–0.8 (blue). (A) The R Literature was computed for the S BG group with the lowest mean RSA. (B) The relationship between mean RSA and R Literature for the S BG groups produced from 100 runs of k‐means clustering with k = 18 and an S BG fitness range between 0.4 and 0.8. (C) The R Literature was computed for the S BG group with the lowest mean hydrophobic score of the WT amino acids of S BG. The gray‐dotted line represents the R Literature from ΔΔ G prediction using Rosetta software.13 Parameters were taken from row 16 of Table I in Kellogg et al.14

References

    1. Magliery TJ, Lavinder JJ, Sullivan BJ (2011) Protein stability by number: high‐throughput and statistical approaches to one of protein science's most difficult problems. Curr Opin Chem Biol 15:443–451. - PMC - PubMed
    1. Giver L, Gershenson A, Freskgard PO, Arnold FH (1998) Directed evolution of a thermostable esterase. Proc Natl Acad Sci U S A 95:12809–12813. - PMC - PubMed
    1. Foit L, Morgan GJ, Kern MJ, Steimer LR, von Hacht AA, Titchmarsh J, Warriner SL, Radford SE, Bardwell JC. (2009) Optimizing protein stability in vivo. Mol Cell 36:861–871. - PMC - PubMed
    1. Fowler DM, Fields S (2014) Deep mutational scanning: a new style of protein science. Nat Methods 11:801–807. - PMC - PubMed
    1. Bloom JD, Silberg JJ, Wilke CO, Drummond DA, Adami C, Arnold FH. (2005) Thermodynamic prediction of protein neutrality. Proc Natl Acad Sci USA 102:606–611. - PMC - PubMed

Publication types

Substances

Associated data

LinkOut - more resources