Meta-Analysis
. 2015 Dec 8;6(39):41837-55.
doi: 10.18632/oncotarget.5995.

Insulin-like growth factor-independent insulin-like growth factor binding protein 3 promotes cell migration and lymph node metastasis of oral squamous cell carcinoma cells by requirement of integrin β1

Affiliations
Meta-Analysis

Insulin-like growth factor-independent insulin-like growth factor binding protein 3 promotes cell migration and lymph node metastasis of oral squamous cell carcinoma cells by requirement of integrin β1

Yi-Chen Yen et al. Oncotarget. .

Erratum in

Abstract

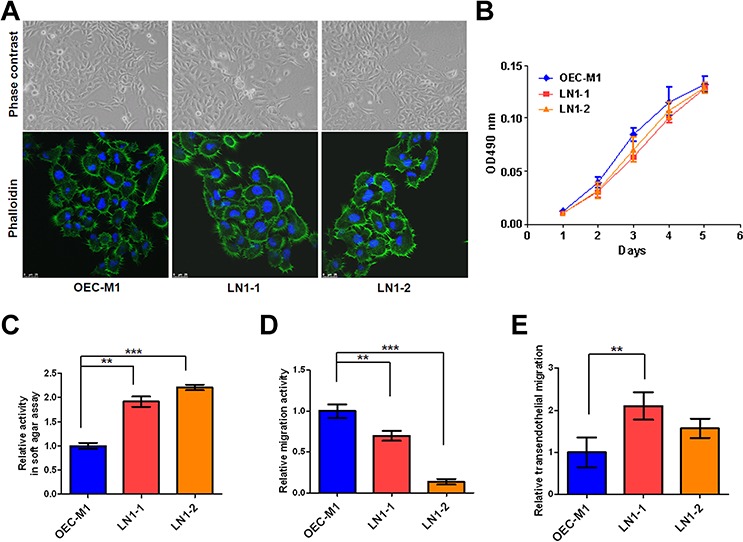
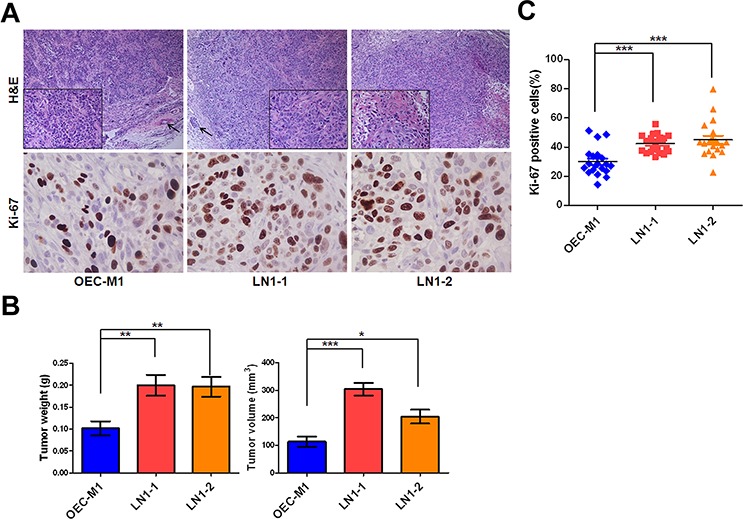
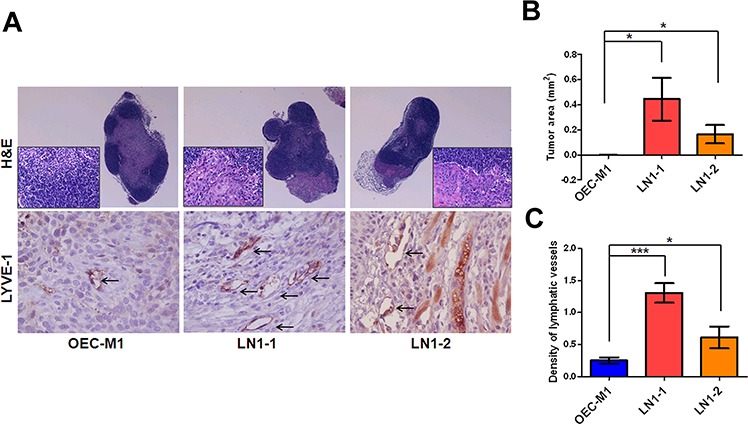
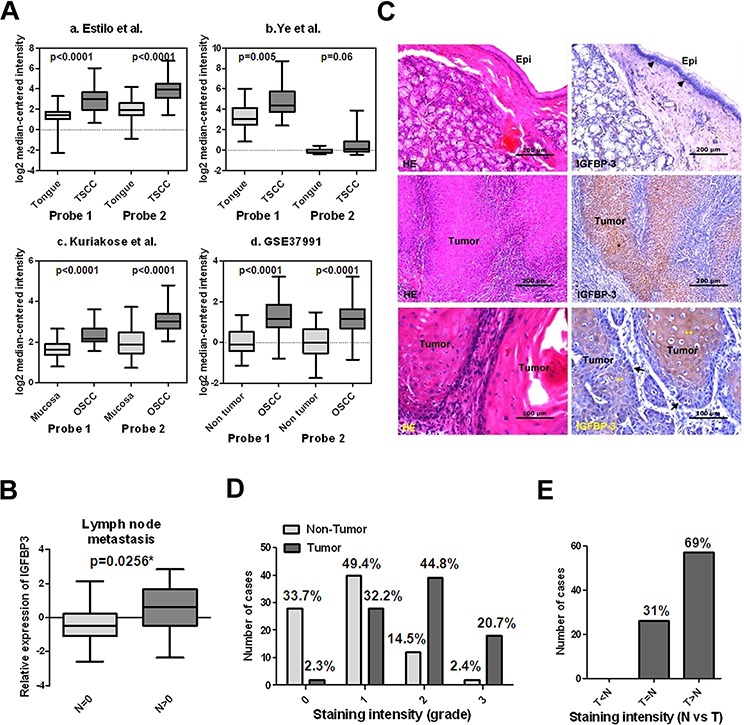
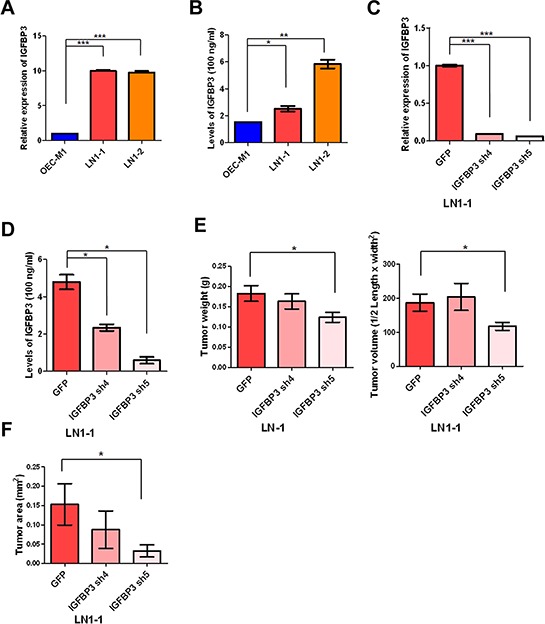
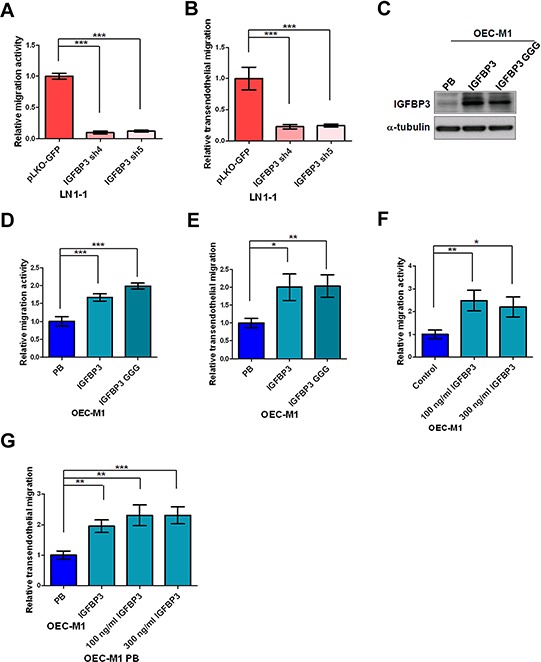
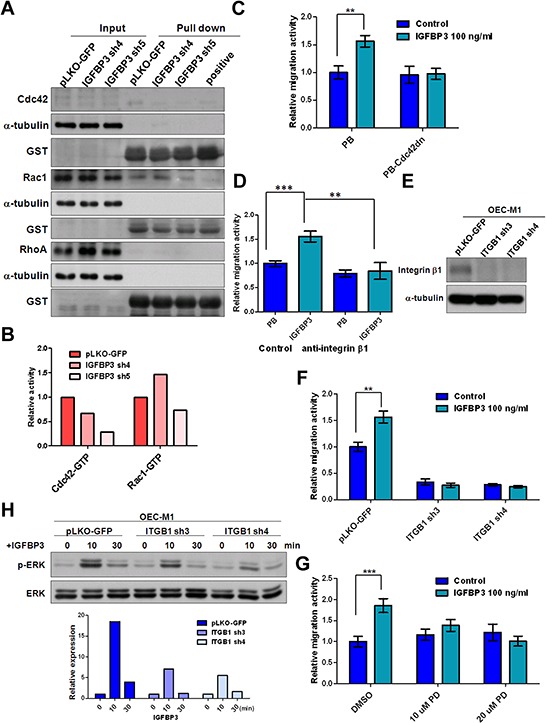
Frequent metastasis to the cervical lymph nodes leads to poor survival of patients with oral squamous cell carcinoma (OSCC). To understand the underlying mechanisms of lymph node metastasis, two sublines were successfully isolated from cervical lymph nodes of nude mice through in vivo selection, and identified as originating from poorly metastatic parental cells. These two sublines specifically metastasized to cervical lymph nodes in 83% of mice, whereas OEC-M1 cells did not metastasize after injection into the oral cavity. After gene expression analysis, we identified insulin-like growth factor binding protein 3 (IGFBP3) as one of the significantly up-regulated genes in the sublines in comparison with their parental cells. Consistently, meta-analysis of the public microarray datasets and IGFBP3 immunohistochemical analysis revealed increased both levels of IGFBP3 mRNA and protein in human OSCC tissues when compared to normal oral or adjacent nontumorous tissues. Interestingly, the up-regulated IGFBP3 mRNA expression was significantly associated with OSCC patients with lymph node metastasis. IGFBP3 knockdown in the sublines impaired and ectopic IGFBP3 expression in the parental cells promoted migration, transendothelial migration and lymph node metastasis of orthotopic transplantation. Additionally, ectopic expression of IGFBP3 with an IGF-binding defect sustained the IGFBP3-enhanced biological functions. Results indicated that IGFBP3 regulates metastasis-related functions of OSCC cells through an IGF-independent mechanism. Furthermore, exogenous IGFBP3 was sufficient to induce cell motility and extracellular signal-regulated kinase (ERK) activation. The silencing of integrin β1 was able to impair exogenous IGFBP3-mediated migration and ERK phosphorylation, suggesting a critical role of integrin β1 in IGFBP3-enchanced functions.

Keywords: insulin-like growth factor binding protein 3; integrin β1; lymph node metastasis; migration; oral squamous cell carcinoma.


Conflict of interest statement

CONFLICTS OF INTEREST

The authors declare that they have no conflict of interest.

Figures

Figure 1
Figure 1. The LN1–1 and LN1–2 sublines demonstrate higher transendothelial migration activity
A. Cell morphology and cytoskeleton F-actin of OEC-M1 (left panel), LN1–1 (middle panel) and LN1–2 (right panel) cells were observed under a phase contrast microscope at 200 × magnification (upper panel) and viewed under fluorescent microscope at 630 × magnification by staining with Alex Fluro 488 phalloidin (lower panel), respectively. B. Representative data shows cell growth in OEC-M1, LN1–1 and LN1–2 cells by MTS assay. C. Representative data shows anchorage-independent growth activity for OEC-M1 cells and sublines. The relative activity was determined by normalizing the mean of colonies/per plate in sublines to that in OEC-M1 cells. D. Representative data shows the relative migration and E. transmigration activities of OEC-M1, LN1–1 and LN1–2 cells. The relative migration/transendothelial migration activity was defined by normalizing the mean of migrated cell/per field in sublines to that in OEC-M1 cells. Bar, SE; **p < 0.01; ***p < 0.001.
Figure 2
Figure 2. LN1–1 and LN1–2 sublines show increased in vivo tumor growth
A. The representative fields of histology and Ki-67 expression in OEC-M1 (left panel), LN1–1 (middle panel) and LN1–2 (right panel) tumors by Hematoxylin and Eosin (H&E) staining and immunohistochemistry (IHC) were observed under light field microscope with 100 and 400 × magnifications, respectively. The histological examination from OEC-M1 and LN1–1 tumors shows poorly differentiated cells (lower box with 400 × magnification) and lymphovascular invasion (shown in arrow). The histological examination from LN1–2 tumors shows moderated differentiated squamous cell carcinoma with focal keratinization (lower box). B. Quantification of tumor weight (left panel) and volume (right panel) is shown for mice (n = 6–7) orthotopically injected with OEC-M1, LN1–1 and LN1–2 cells. C. The percentage of positive Ki-67 signals was determined in OEC-M1, LN1–1 and LN1–2 tumors. Bar, SE; *p < 0.05; **p < 0.01; ***p < 0.001.
Figure 3
Figure 3. Higher lymphangiogenesis in orthotopic tumors generated from the OSCC sublines
A. H&E staining of lymph nodes from mice with orthotopic tumors generated from OEC-M1 (left panel), LN1–1 (middle panel) and LN1–2 (right panel) cells, was observed under microscope at 40 and 400 × magnification. The intratumoral lymphatic vessels in orthotopic OEC-M1 (left panel), LN1–1 (middle panel) and LN1–2 (right panel) tumors were stained using anti-LYVE-1 and observed with 400 × magnification (lower panel). The arrow indicates lymphatic vessels. B. Quantification of tumor area in lymph nodes of mice with orthotopic growth of OEC-M1, LN1–1 and LN1–2 cells. The data were expressed as mean tumor area of lymph nodes in mice (n = 4–6) bearing orthotopic tumors. C. Quantification of tumor lymphatic vessels by IHC with anti-LYVE1. The data were expressed as mean density of LYVE-1 positive number per microscopic field. Bar, SE; *p < 0.05; ***p < 0.001.
Figure 4
Figure 4. Up-regulated IGFBP3 mRNA and protein in OSCC tissues
A. Increased IGFBP3 mRNA in oral squamous cell carcinoma (OSCC) in comparison with normal oral tissues by analysis of two probes. Data were obtained from (a) GEO/GSE13601 [28], (b) GEO/GSE6631 [29], (c) GEO/GSE9844 [30] and (d) GEO/GSE37991 [26]. B. The mRNA level of IGFBP3 was significantly higher in OSCC tissues with lymph node metastasis than that in OSCC tissues without lymph node metastasis. C. Immunohistochemical analysis of IGFBP3 on human OSCC samples. Upper left, H&E staining, showing the non-tumor epithelium (Epi) in a representative OSCC specimen. Upper right, IGFBP3 staining of the non-tumor epithelium, demonstrating cytoplasmic IGFBP3 staining in some basal cells (arrow heads) of the non-tumor epithelium. No apparent IGFBP3 staining was noted on the upper cell layers. Middle left, H&E staining of tumor nests (*) on the same OSCC specimen. Middle right, IGFBP3 staining, showing strong cytoplasmic staining of IGFBP3 on tumor nests compared to their corresponding non-tumor epithelium (bar, 200 μM). Lower left, H&E staining on another OSCC specimen. Lower right, although the less differentiated tumor cells located at the periphery of tumor nests demonstrated some degree of IGFBP3 staining (arrows), strong IGFBP3 staining was especially noted in the center-located, more differentiated tumor cells (**) (bar, 100 μM). D. Scoring of IGFBP3 staining intensity in 83 non-tumor epithelium (light grey bar) and 87 tumor specimens (heavy grey bar). 0: no; 1: weak; 2: moderate; 3: strong expression. E. Comparison of the IGFBP3 staining intensity between tumor parts (T) and non-tumor epithelium (N) based on each individual histological section.
Figure 5
Figure 5. Knockdown of IGFBP3 expression impairs lymph node metastasis
A. Levels of IGFBP3 mRNA in OEC-M1, LN1–1 and LN1–2 cells were analyzed by qRT-PCR. All amplifications were normalized to an endogenous β-actin control. The relative expression of IGFBP3 mRNA in LN1–1 and -2 cells was normalized to that in OEC-M1 cells. B. Levels of IGFBP3 protein in culture supernatant of OEC-M1, LN1–1 and LN1–2 cells were detected by ELISA. C. Levels of IGFBP3 mRNA in LN1–1 cells expressing with IGFBP3 shRNA (IGFBP3 sh4 and sh5) and the corresponding controls with lentiviral shRNA against GFP (pLKO-GFP) were determined by qRT-PCR. All amplifications were normalized to an endogenous β-actin control. The relative expression of IGFBP3 mRNA in shRNA expressing cells was normalized to that in the control cells. D. Levels of IGFBP3 protein in culture supernatant of LN1–1 cells with IGFBP3 knockdown and the corresponding controls were detected by ELISA. E. Quantification of tumor weight (left panel) and volume (right panel) in mice (n = 9–10) injected with LN1–1 pLKO-GFP, IGFBP3 sh4 and sh5 cells. F. Quantification of tumor area in lymph nodes of mice with orthotopic growth of LN1–1 pLKO-GFP, IGFBP3 sh4 and sh5 cells. The data were expressed as mean tumor area of lymph nodes in mice (n = 9–10) bearing orthotopic tumors. Bar, SE; *p < 0.05; **p < 0.01; ***p < 0.001.
Figure 6
Figure 6. IGF-independent IGFBP3 increases migration and transendothelial migration
A. Representative data shows the relative activities of migration and B. transendothelial migration of LN1–1 cells with IGFBP3 knockdown (IGFBP3 sh4 and sh5) and the corresponding controls (pLKO-GFP). The relative migration/transmigration activity was defined by normalizing the mean of migrated cell/per field in LN1–1 IGFBP3 sh4 or sh5 with that in LN1–1 pLKO-GFP cells. C. Immunoblot analysis of IGFBP3 protein in OEC-M1 cells with ectopic wild type and mutant IGFBP3 expression (OEC-M1 IGFBP3, GGG) and vector controls (OEC-M1 PB). α-tubulin serves as an internal control. D. Representative data shows the relative activities of migration and E. transendothelial migration of OEC-M1 IGFBP3, GGG and OEC-M1 PB cells. The relative migration/transmigration activity was defined by normalizing the mean of migrated cells/per field in OEC-M1 IGFBP3 or GGG cells with that in OEC-M1 PB cells. F. Representative data shows the relative migration activity of OEC-M1 cells treated with recombinant IGFBP3. G. Representative data shows the relative transmigration activity of OEC-M1 IGFBP3, OEC-M1 PB cells and OEC-M1 PB cells treated with IGFBP3 proteins. The relative migration/transendothelial migration activity was defined by normalizing the mean of migrated cells/per field in OEC-M1 IGFBP3 or IGFBP3 treated cells with that in the control cells. Bar, SE; *p < 0.05; **p < 0.01; ***p < 0.001.
Figure 7
Figure 7. Silencing of integrin β1 inhibits IGFBP3-induced migration
A. The activities of Cdc42, Rac1 and RhoA were detected in IGBBP3 knockdown cells (IGFBP3 sh4 and sh5) and the corresponding controls (pLKO-GFP). Equal amounts of input protein were subjected to Western blot using anti-Cdc42 (total Cdc42), anti-Rac1 (total Rac1), and anti-RhoA (total RhoA) antibodies. Equal amounts of protein were incubated with GST-PAK1 (detection of active Cdc42 or Rac1) and GST-Rhotekin (detection of active RhoA). Complexes were collected with gluthathione-Sepharose and resolved by Western blot. GTPγS was served as a positive control. Anti-GST antibodies were served as a loading control. B. The density of each band was measured by image J and normalized with the controls (LN1–1 pLKO-GFP). The activities of active small GTPase were conducted by dividing the density of active small GTPase to that of GST loading controls. The relative activities were obtained when the activity of active small GTPase in LN1–1 pLKO-GFP were set to 1. C. Representative data shows the relative migration activity of OEC-M1 cells with dominant-negative Cdc42 (Cdc42dn) and the corresponding controls (PB). The relative migration activity was defined by normalizing the mean of migrated cell /per field in OEC-M1 PB treated with treated with IGFBP3 and PB-Cdc42dn cells with/without IGFBP3 treatment with that in OEC-M1 PB cells. D. Representative data shows the relative migration activity of IGFBP3 expressing cells (OEC-M1 IGFBP3) and the corresponding controls (OEC-M1 PB) with anti-integrin β1 (200 ng/ml) treatment. The relative migration activity was defined by normalizing the mean of migrated cell /per field in OEC-M1 PB and IGFBP3 cells treated with anti-integrin β1 or OEC-M1 IGFBP3 cells treated with IgG antibodies (200 ng/ml) to that in OEC-M1 PB cells treated with IgG antibodies. E. Immunoblot analysis of integrin β1 protein in OEC-M1 cells with ITGB1 shRNA expression (OEC-M1 ITGB1 sh3 and sh4) and vector controls (OEC-M1 pLKO-GFP). α-tubulin serves as an internal control. F. Representative data shows the relative migration activity of OEC-M1 pLKO-GFP, ITGB1 sh3 and sh4 cells upon IGFBP3 (100 ng/ml) treatment. The relative migration activity was defined by normalizing the mean of migrated cell /per field in OEC-M1 with ITGB1 knockdown and IGFBP3 treatment with that in the control cells. G. Representative data showed the relative migration activity of OEC-M1 treated with 10, 20 uM of PD98059 (PD) and dimethyl sulfoxide (DMSO) upon IGFBP3 (100 ng/ml) treatment. The relative migration activity was defined by normalizing the mean of migrated cell/per field in OEC-M1 treated with PD98059 and IGFBP3 with that in the control cells. H. Immunoblot analysis revealed knockdown of ITGB1 inhibited IGFBP3-induced ERK phosphorylation at different time points in OEC-M1 cells (upper panel, 0, untreated; 10, 10 min; 30, 30 min for 100 ng/ml IGFBP3 treatment). The ratio of phosphorylated ERK/total ERK was obtained by dividing the intensity of phosphorylated ERK to that of total ERK. The relative expression was obtained when the ration of untreated cells were set to 1 (lower panel). Bar, SE; **p < 0.01; ***p < 0.001.

References

    1. Warnakulasuriya S. Global epidemiology of oral and oropharyngeal cancer. Oral Oncol. 2009;45:309–316. - PubMed
    1. Liao CT, Chang JT, Wang HM, Ng SH, Hsueh C, Lee LY, Lin CH, Chen IH, Huang SF, Cheng AJ, See LC, Yen TC. Pretreatment primary tumor SUVmax measured by FDG-PET and pathologic tumor depth predict for poor outcomes in patients with oral cavity squamous cell carcinoma and pathologically positive lymph nodes. Int J Radiat Oncol Biol Phys. 2009;73:764–771. - PubMed
    1. Zhang X, Liu Y, Gilcrease MZ, Yuan XH, Clayman GL, Adler-Storthz K, Chen Z. A lymph node metastatic mouse model reveals alterations of metastasis-related gene expression in metastatic human oral carcinoma sublines selected from a poorly metastatic parental cell line. Cancer. 2002;95:1663–1672. - PubMed
    1. Jogie-Brahim S, Feldman D, Oh Y. Unraveling insulin-like growth factor binding protein-3 actions in human disease. Endocr Rev. 2009;30:417–437. - PMC - PubMed
    1. Yu H, Spitz MR, Mistry J, Gu J, Hong WK, Wu X. Plasma levels of insulin-like growth factor-I and lung cancer risk: a case-control analysis. J Natl Cancer Inst. 1999;91:151–156. - PubMed

Publication types

MeSH terms

Substances