. 2015 Dec 22;6(41):43635-52.
doi: 10.18632/oncotarget.6018.

Integrative analysis to select cancer candidate biomarkers to targeted validation

Affiliations

Integrative analysis to select cancer candidate biomarkers to targeted validation

Rebeca Kawahara et al. Oncotarget. .

Abstract

Targeted proteomics has flourished as the method of choice for prospecting for and validating potential candidate biomarkers in many diseases. However, challenges still remain due to the lack of standardized routines that can prioritize a limited number of proteins to be further validated in human samples. To help researchers identify candidate biomarkers that best characterize their samples under study, a well-designed integrative analysis pipeline, comprising MS-based discovery, feature selection methods, clustering techniques, bioinformatic analyses and targeted approaches was performed using discovery-based proteomic data from the secretomes of three classes of human cell lines (carcinoma, melanoma and non-cancerous). Three feature selection algorithms, namely, Beta-binomial, Nearest Shrunken Centroids (NSC), and Support Vector Machine-Recursive Features Elimination (SVM-RFE), indicated a panel of 137 candidate biomarkers for carcinoma and 271 for melanoma, which were differentially abundant between the tumor classes. We further tested the strength of the pipeline in selecting candidate biomarkers by immunoblotting, human tissue microarrays, label-free targeted MS and functional experiments. In conclusion, the proposed integrative analysis was able to pre-qualify and prioritize candidate biomarkers from discovery-based proteomics to targeted MS.

Keywords: candidate biomarker; discovery; integrative analysis; proteomics; targeted.


Conflict of interest statement

CONFLICTS OF INTEREST

The authors declare that they have no conflicts of interest.

Figures

Figure 1
Figure 1. Experimental workflow and overview of the proteomics and bioinformatics analyses, validations and functional assays
Figure 2
Figure 2. Comparison of the three feature selection methods (Beta-binomial, SVM-RFE and NSC) used to identify differentially abundant proteins among carcinoma, melanoma and non-cancerous cells
A. Clustering of the whole secretome dataset before applying feature selection methods. From the 2,574 proteins identified and quantified by spectral counts, 1,697 (65.9%) compose the heat map. The 877 remaining proteins exhibited ≤2 spectral counts and were excluded from the analysis. B. Clustering after applying feature selection methods. 603 significant differentially abundant proteins among melanoma, carcinoma and non-cancerous classes selected by Beta-binomial, NSC and SVM-RFE analyses compose the heat map. C. Venn diagram showing the intersections among the optimal feature subsets (N) retrieved by the three methods. D. Jaccard similarity coefficient vs. the optimal feature subset (N) retrieved by each method. E. Clustering of the 12 significant differentially abundant proteins among melanoma, carcinoma and non-cancerous classes identified in the intersection of Beta-binomial, NSC and SVM-RFE analyses. The secretome dataset is composed by non-cancerous cells (HaCaT and HEK293), carcinoma (A-431 and SCC-9) and melanoma (A2038 and SK-MEL-28) cell lines.
Figure 3
Figure 3
Neighbor joining (NJ) clustering calculated from a Euclidean distance matrix of the secretome dataset samples, considering A. all features (1,697 proteins), B. Beta-binomial (601 proteins), C. NSC (130 proteins) and D. SVM-RFE (13 proteins) features. SC (tree) stands for silhouette coefficient calculated from the NJ tree and SC (data) stands for silhouette coefficient calculated directly from the original data of each analysis.
Figure 4
Figure 4
Interaction networks of the identified A. carcinoma and B. melanoma candidate biomarkers by Beta-binomial, NSC and SVM-RFE analyses. The selected most relevant enriched KEGG pathways (p ≤ 0.05) among the up-regulated (red), down-regulated (green), non-regulated (yellow) and background intermediary proteins (grey) from the IIS database are depicted by clustering with a circular layout proteins involved in each respective pathway. Clusters were assigned only to pathways containing more than three proteins with at least one protein from the proteome dataset (disease pathways or pathways specific for defined cell types were not considered); proteins belonging to more than one pathway were assigned to the pathway clusters with the best enrichment p-values; some proteins were also assigned to different pathway clusters based on complementary data from the Uniprot database. In magenta, pathway clusters exclusive of each network; in black, pathway clusters in common. The node sizes of up, down and non-regulated proteins are proportional to their fold change (−1.3 ≥ fold change ≥1.3, compared to the non-cancerous class). The protein-protein networks were built using the IIS software and visualized using Cytoscape.
Figure 5
Figure 5
Validation of the higher expression of A. tenascin-C and B. GDF15 (I-Benign lesion; II- Primary Melanoma; III-Metastatic Melanoma) on melanoma cancer tissue microarrays and C. CFB and D. C3 (I- Normal Mucosa; II- Oral SCC) on carcinoma cancer tissue microarrays. Tenascin-C showed statistically significant expression among the categories benign lesion, primary melanoma and metastatic melanoma, but not between primary melanoma and metastatic melanoma (One-way ANOVA, benign lesion vs. primary melanoma, p < 0.0001; benign lesion vs. metastatic melanoma, p < 0.0009; primary melanoma vs. metastatic melanoma, p = 0.1748). GDF15 showed statistically significant expression among the categories benign lesion, primary melanoma and metastatic melanoma (One-way ANOVA, benign lesion vs. primary melanoma, p < 0.0001; benign lesion vs. metastatic melanoma, p < 0.0001; primary melanoma vs. metastatic melanoma, p < 0.0001). CFB and C3 showed higher expression in OSCC compared with normal mucosa (Mann Whitney U, p = 0.009 and p = 0.0005, respectively).
Figure 6
Figure 6. CFB and C3 peptides showed higher normalized intensities in OSCC saliva samples than in healthy saliva samples
PseudoSRM analytical approach for peptides of C3 (precursor m/z 631.05, +3; 735.89, +2) and CFB (precursor m/z 638.33, +2; 939.13, +3) normalized with 5 fmol/μl of angiotensin (m/z 432.89, +3) as an internal reference peptide. These data represent two technical replicates of saliva samples from healthy patients (n = 7), saliva samples from patients who undergone surgical resection of OSCC (named no lesion, n = 7) and saliva samples from patients with active OSCC lesion without any treatment (named lesion, n = 10) (ANOVA followed by Tukey's test). The normalization to the internal reference peptide was performed for each run.
Figure 7
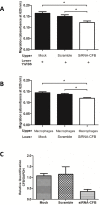
Figure 7. CFB knockdown decreased the migration of skin-derived epidermoid carcinoma (A431) cells and reduced the chemotaxis of human macrophages
A. A431/untreated (mock), A431/control (scrambled) and A431/siRNA CFB cells were seeded in serum-free media in the upper chamber of a 96-well transwell plates. RPMI media, which was supplemented with 1% FBS, was added in the lower chamber (n = 2, triplicate, one-way ANOVA followed by Tukey's test, *p < 0.05). B. Chemotaxis of human macrophages was reduced when were seeded in the upper chamber, and A431 cells treated with mock, control siRNA and siRNA against CFB were added in the lower chamber of the transwell (n = 2, triplicate, a one-way ANOVA followed by Tukey's test, *p < 0.05). C. Real-time quantitative PCR confirms the expression of CFB after transient transfections in A431 cells. The data were normalized with the (glyceraldehyde-3-phosphate dehydrogenase gene was used as internal reference). Each bar represents mean ± SD of three independent experiments.

References

    1. Kulasingam V, Diamandis EP. Strategies for discovering novel cancer biomarkers through utilization of emerging technologies. Nature clinical practice Oncology. 2008;5:588–99. - PubMed
    1. Wu CC, Hsu CW, Chen CD, Yu CJ, Chang KP, Tai DI, Liu HP, Su WH, Chang YS, Yu JS. Candidate serological biomarkers for cancer identified from the secretomes of 23 cancer cell lines and the human protein atlas. Molecular & cellular proteomics: MCP. 2010;9:1100–17. - PMC - PubMed
    1. Chen R, Pan S, Brentnall TA, Aebersold R. Proteomic profiling of pancreatic cancer for biomarker discovery. Molecular & cellular proteomics: MCP. 2005;4:523–33. - PubMed
    1. Shimwell NJ, Bryan RT, Wei W, James ND, Cheng KK, Zeegers MP, Johnson PJ, Martin A, Ward DG. Combined proteome and transcriptome analyses for the discovery of urinary biomarkers for urothelial carcinoma. British journal of cancer. 2013;108:1854–61. - PMC - PubMed
    1. White NM, Masui O, Desouza LV, Krakovska O, Metias S, Romaschin AD, Honey RJ, Stewart R, Pace K, Lee J, Jewett MA, Bjarnason GA, Siu KW, et al. Quantitative proteomic analysis reveals potential diagnostic markers and pathways involved in pathogenesis of renal cell carcinoma. Oncotarget. 2014;5:506–18. - PMC - PubMed

Publication types

Substances

LinkOut - more resources