. 2015 Nov 5:16:246.
doi: 10.1186/s13059-015-0802-2.

A transient ischemic environment induces reversible compaction of chromatin

Affiliations

A transient ischemic environment induces reversible compaction of chromatin

Ina Kirmes et al. Genome Biol. .

Abstract

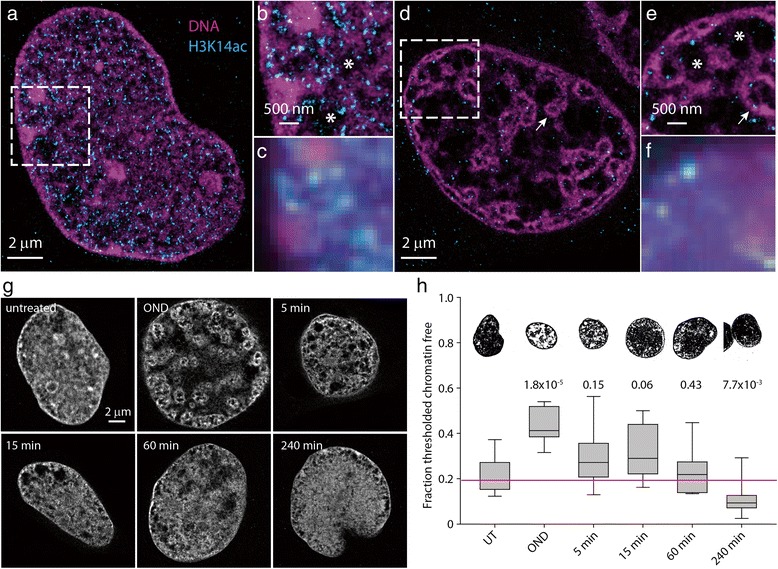
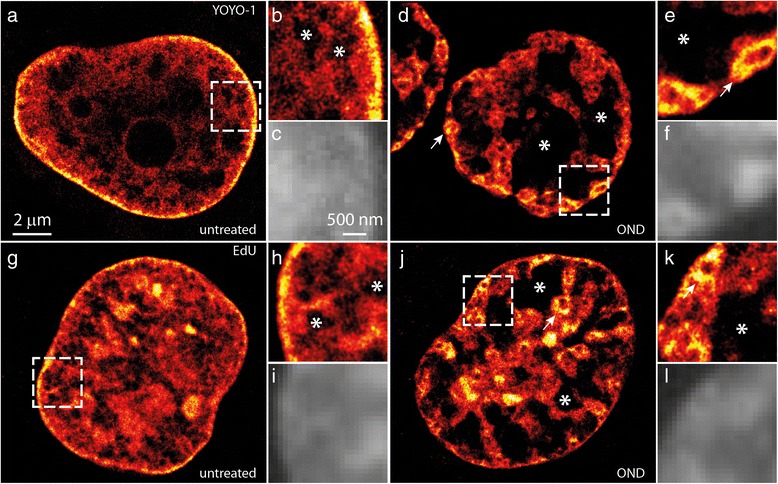
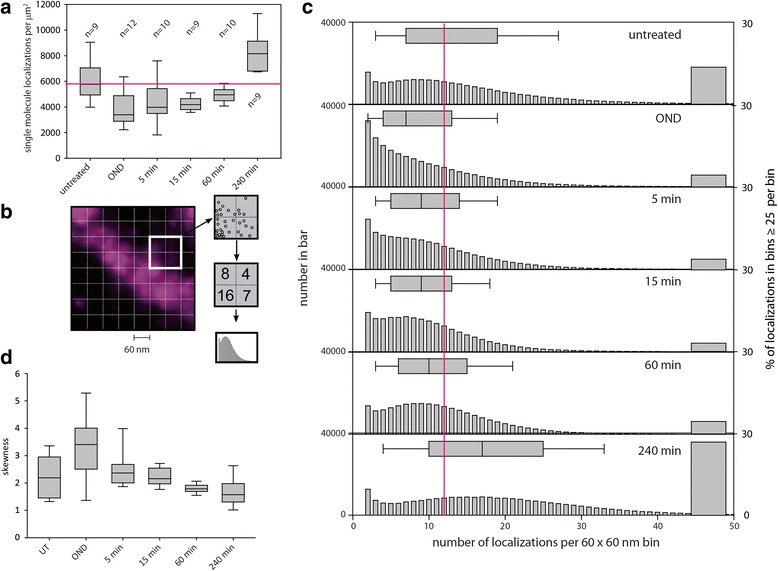
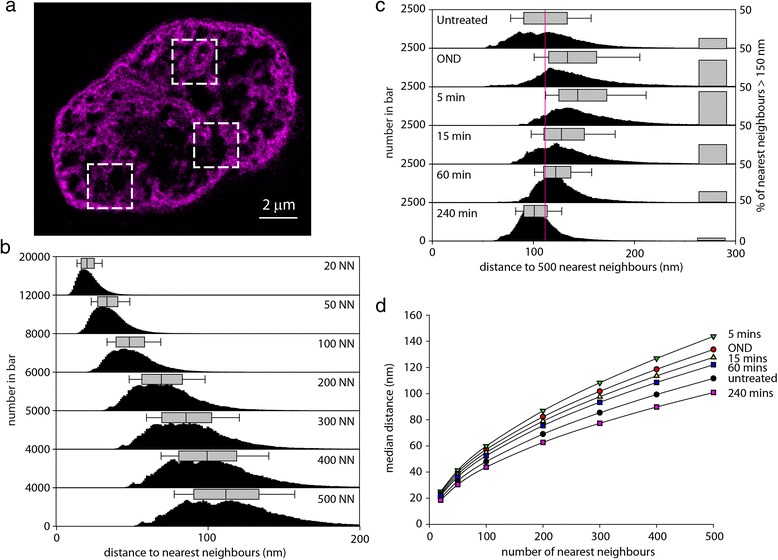
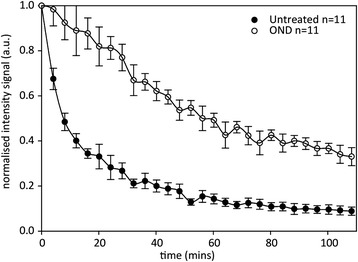
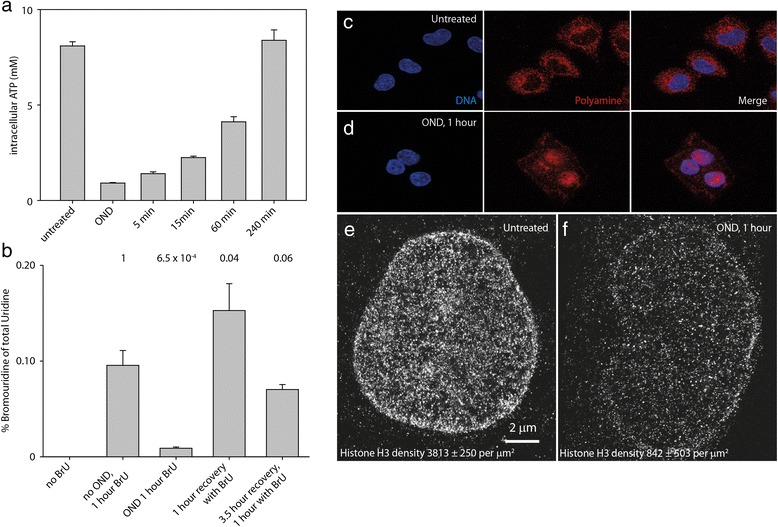
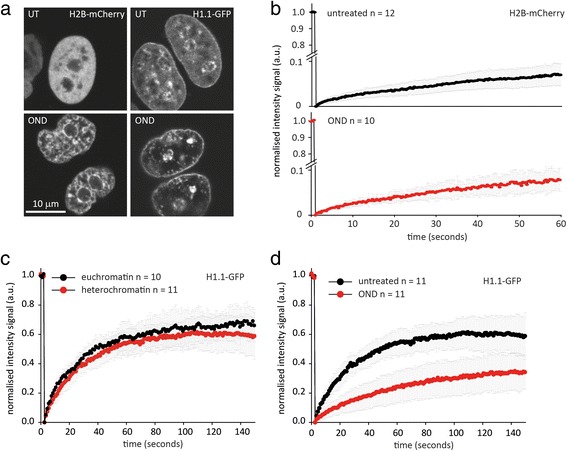
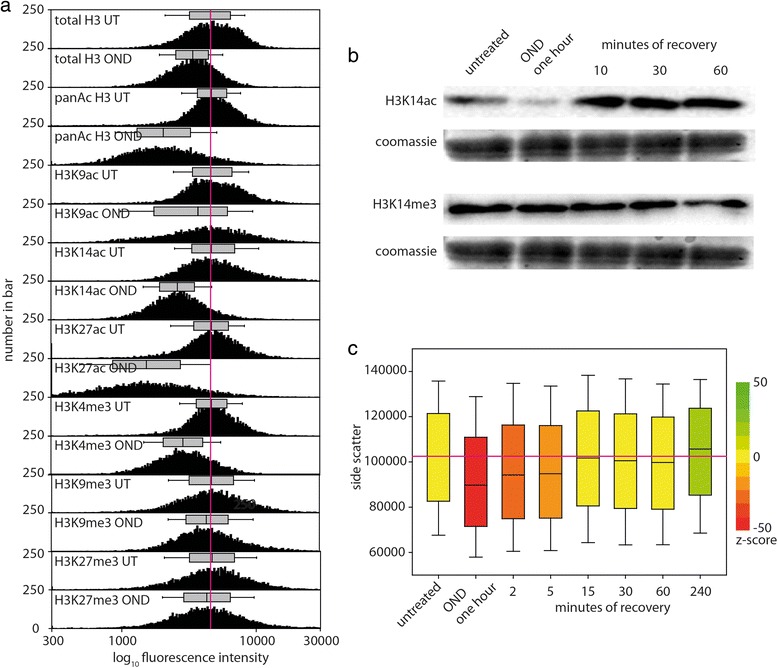
Background: Cells detect and adapt to hypoxic and nutritional stress through immediate transcriptional, translational and metabolic responses. The environmental effects of ischemia on chromatin nanostructure were investigated using single molecule localization microscopy of DNA binding dyes and of acetylated histones, by the sensitivity of chromatin to digestion with DNAseI, and by fluorescence recovery after photobleaching (FRAP) of core and linker histones.

Results: Short-term oxygen and nutrient deprivation of the cardiomyocyte cell line HL-1 induces a previously undescribed chromatin architecture, consisting of large, chromatin-sparse voids interspersed between DNA-dense hollow helicoid structures 40-700 nm in dimension. The chromatin compaction is reversible, and upon restitution of normoxia and nutrients, chromatin transiently adopts a more open structure than in untreated cells. The compacted state of chromatin reduces transcription, while the open chromatin structure induced upon recovery provokes a transitory increase in transcription. Digestion of chromatin with DNAseI confirms that oxygen and nutrient deprivation induces compaction of chromatin. Chromatin compaction is associated with depletion of ATP and redistribution of the polyamine pool into the nucleus. FRAP demonstrates that core histones are not displaced from compacted chromatin; however, the mobility of linker histone H1 is considerably reduced, to an extent that far exceeds the difference in histone H1 mobility between heterochromatin and euchromatin.

Conclusions: These studies exemplify the dynamic capacity of chromatin architecture to physically respond to environmental conditions, directly link cellular energy status to chromatin compaction and provide insight into the effect ischemia has on the nuclear architecture of cells.


Figures

Fig. 1
Fig. 1
Oxygen and nutrient deprivation induces compaction of chromatin. HL-1 cells were fixed, permeabilized, and immunostained with anti-acetylated histone H3K14 and then counter-stained with Vybrant DyeCycle Violet. Two-color SMLM was performed on untreated HL-1 cells (a, b) or on cells exposed to 1 hour of OND (d, e). The dashed boxes in (a, d) are shown as zoomed views in (b) and (e), respectively. For comparison, wide-field images of the inset regions are shown in (c, f). Chromatin voids are indicated by asterisks and atolls marked by the arrow. Representative SMLM images of Vybrant Dyecycle Violet-stained nuclei, either untreated, subjected to 1 hour of OND or 5, 15, 60 and 240 minutes after release from OND are shown in (g). A discriminatory threshold (pixel intensity ≤ 50) was applied to the experimental set of SMLM imaged nuclei (a minimum of nine cells were imaged), with box plots and representative images describing the median and range of the proportion of the nucleus with chromatin shown in (h). P values compared with untreated are reported above the box plots. UT untreated
Fig. 2
Fig. 2
Alternative dyes and labeling methodologies confirm OND-induced compaction of chromatin. HL-1 cells, either untreated (ac) or exposed to 1 hour of OND (df) were fixed, permeabilized, stained with the DNA binding dye YOYO-1 and subjected to SMLM (a, b, d, e). Alternatively, cells were labeled for 24 hours with 10 μM 5-ethynyl-2′-deoxyuridine (EdU), and then were either untreated (gi) or subjected to 1 hour of OND (jl). Following fixation, EdU incorporated into DNA was coupled via click chemistry to AlexaFluor 488, as described [46], and nuclear DNA determined by SMLM (g, h, j, k). The dashed boxes in (a, d, g, j) are shown as zoomed views in (b), (e), (h) and (k), respectively. For comparison, wide-field images of the inset regions are shown in (c, f, i, l). Chromatin voids are indicated by an asterisk, with atolls marked by an arrow
Fig. 3
Fig. 3
Quantification of chromatin compaction through binning. The influence of OND on the nuclear distribution and accessibility of chromatin was characterized by analysis of joint localization maps generated by SMLM. a The median and range of densities of single molecule localizations, calculated over the entire nucleus and for a minimum of nine cells, for untreated, OND exposed and recovering cells. A binning approach, outlined in (b), was then used to characterize the extent of chromatin compaction as cells transition from normal conditions through OND and in recovery from OND (c), with the median and range of the distribution shown above each histogram. The proportion of bins containing ≥ 25 localizations is presented as a bar on the right of each panel. d As the distributions of histograms of binned data differ significantly between time points, the skewness (deviation from the mean) was calculated for all of the images. UT untreated
Fig. 4
Fig. 4
Nearest neighbor characterization of OND-induced chromatin compaction. Nearest neighbor analysis was used to describe the extent of chromatin compaction upon deprivation of oxygen and nutrients using three internal regions of interest (ROIs; outlined with dashed boxes), as illustrated for an HL-1 cell subjected to 1 hour of OND (a). Results were generated for each experimental condition using three ROIs per nucleus and three nuclei per determination. b The effect of the number of nearest neighbors evaluated on the distance to the analyzed position is shown as a histogram and as a box plot showing the median and range of distribution of values for untreated cells. c The extent of chromatin compaction as cells transition from normal conditions through OND and in recovery from OND, using the distance to 500 nearest neighbors, with the median and range of distribution shown above each histogram. The proportion of bins with a distance to 100 nearest neighbors ≥ 80 nm is shown as a bar on the right of each panel. d The relationship between the number of nearest neighbors used in the analysis to the median distance to the set of nearest neighbors for each experimental condition
Fig. 5
Fig. 5
OND induces chromatin compaction as determined by resistance to digestion by DNAseI. HL-1 cells, either untreated or subject to 1 hour of OND, were fixed, permeabilized and stained with 5 μM DRAQ5 for 30 minutes. Cells were then digested with 5 U/ml DNAseI at 37 °C with cellular fluorescence measured on a confocal microscope, with images generated every 4 minutes, observing 11 cells in total for each experimental condition, a.u. arbitrary units
Fig. 6
Fig. 6
OND depletes intracellular ATP levels, inhibits transcription, induces relocation of the cellular polyamine pool to the nucleus and reduces the staining density of histone H3 with antibody. a The intracellular concentration of ATP in untreated, OND-exposed and recovering cells was determined using a luciferase dependent assay. b Global rates of transcription, determined by the incorporation of bromouridine into RNA, in untreated cells, cells under OND and cells recovering from OND are presented. HL-1 cells, either untreated or subjected to 1 hour of OND, were fixed, permeabilized and stained either with anti-polyamine antibody (c, d) or with anti-total H3 antibody (e, f) and counterstained with the fluorescent DNA binding dye Hoechst 33342. Cells were then examined using confocal microscopy. The content of immunostained histone H3 was evaluated by SMLM in untreated (e) and OND-treated (f) HL-1 cells. BrU bromouridine. The error bars represent the standard deviation of three independent samples
Fig. 7
Fig. 7
OND does not induce core histone displacement from chromatin but does decrease the mobility of the linker histone H1. We first demonstrated that HeLa cells stably transfected with either histone H2B-mCherry or histone H1.1-green fluorescent protein (GFP) respond to 1 hour of OND by undergoing chromatin compaction. a Comparison of untreated (UT) cells (top panels) with cells exposed to 1 hour of OND (bottom panels) by confocal microscopy clearly indicates that chromatin of HeLa cells compacts upon OND treatment. b We then evaluated the mobility of the core histone H2B using FRAP on untreated (upper panel) and on OND-treated (lower panel) cells. The recovery after photobleaching was extremely slow for both conditions, indicating that OND does not induce displacement of H2B from chromatin. c We then evaluated the mobility of the linker histone H1 in untreated and OND-treated HeLa cells. As previously reported [49, 50], histone H1 is mobile, and is somewhat less mobile in heterochromatin than in euchromatin. d OND-induced chromatin compaction dramatically reduces the mobility of histone H1, indicating that the extent of chromatin compaction in OND is considerably higher than that between euchromatin and heterochromatin
Fig. 8
Fig. 8
OND reduces access to chromatin by anti-histone antibodies and induces deacetylation of histones and a reduction in cellular granularity. HL-1 cells, either untreated or subjected to 1 hour of OND, were trypsinized to produce a monodisperse suspension, fixed, permeabilized, washed and immunostained with anti-histone H3 antibodies, as indicated. Cytometric analysis was performed on a minimum of 104 cells. a A comparison of the staining intensity of untreated (UT) and OND cells; each data pair is normalized to the median of the untreated total H3 with the median and range of the distribution shown above each histogram. b Western blot analysis of total H3K14ac and of H3K14me3 across the experimental time-course. c The distribution of side-scatter measurements, which are proportional to internal cellular granularity, is presented for 104 cells as box plots showing the median, 25 % and 75 % intervals as boxes and the 5 % and 95 % intervals as whiskers. The median value for untreated cells is shown as a horizontal line through all box plots. The z score between the untreated cell population and each other experimental condition, determined by the Mann-Whitney ranked sum test, is indicated by the color of the box according to the key on the right

References

    1. Brahimi-Horn MC, Pouyssegur J. Harnessing the hypoxia-inducible factor in cancer and ischemic disease. Biochem Pharmacol. 2007;73:450–7. doi: 10.1016/j.bcp.2006.10.013. - DOI - PubMed
    1. Kvietikova I, Wenger RH, Marti HH, Gassmann M. The transcription factors ATF-1 and CREB-1 bind constitutively to the hypoxia-inducible factor-1 (HIF-1) DNA recognition site. Nucleic Acids Res. 1995;23:4542–50. doi: 10.1093/nar/23.22.4542. - DOI - PMC - PubMed
    1. Wang GL, Jiang BH, Rue EA, Semenza GL. Hypoxia-inducible factor 1 is a basic-helix-loop-helix-PAS heterodimer regulated by cellular O2 tension. Proc Natl Acad Sci U S A. 1995;92:5510–4. doi: 10.1073/pnas.92.12.5510. - DOI - PMC - PubMed
    1. Carling D, Mayer FV, Sanders MJ, Gamblin SJ. AMP-activated protein kinase: nature’s energy sensor. Nat Chem Biol. 2011;7:512–8. doi: 10.1038/nchembio.610. - DOI - PubMed
    1. Ahn YJ, Kim H, Lim H, Lee M, Kang Y, Moon S, et al. AMP-activated protein kinase: implications on ischemic diseases. BMB Rep. 2012;45:489–95. doi: 10.5483/BMBRep.2012.45.9.169. - DOI - PubMed

Publication types

MeSH terms